What is Luck vs. Skill: Home Run to Fly-Ball Ratio and BABIP
I am fascinated by the intersection of statistics and psychology. It is very easy for the mind to be tricked by small sample sizes or incorrect assumptions. There are lots of examples in psychology using coin flips, which are of course completely random.
If I told you I was going to flip a coin ten times and have you predict the distribution of heads to tails, of course, you would say it should be five to five. And that is statistically correct, it is a 50/50 chance and five to five is the most likely outcome of ten coin flips. But, if you actually do this several times, it doesn’t come up five to five very often. You’ll have a bunch of six to four and seven to three heads-tail ratios, maybe even eight to two. The more times you flip a coin, the more likely it ends up closer to 50 percent heads and 50 percent tails. But, even at thousands of flips, it’s not going to come up exactly even.
Where it gets interesting is if I flip a coin 10 times and it comes up heads all ten times. Assuming there’s nothing funny about the coin itself, what happens to your assumptions after heads comes up 10 straight times? If I ask you to predict what the next flip will come up, there are three camps of people. The even-thinkers will say it is a 50/50 chance. But the vast majority of people will guess the next flip is going to be tails because it is supposed to even out. This is known of the gambler’s fallacy.
As it relates to sports, there are some people who will say, heads are on a roll, and predict the next flip to be heads. Of course, the correct answer is that the first 10 flips that came up heads have absolutely no bearing whatsoever on the next flip. No matter how many times you flip a coin, regardless of what happened on past flips, the next flip is always a 50/50 chance for heads or tails.
How is this relevant to daily fantasy baseball? There are events in baseball that are completely skill-based, and there are events that are random. If you can learn to separate the predictable from the unpredictable, both mathematically and psychologically, you will drastically increase your odds of success on a day-to-day basis. The two key pitching stats that are mostly random are BABIP and home run to fly ball ratio.
BABIP is ‘batting average on balls in play’. A ball in play excludes home runs, so this looks at every ball hit into the field of play and how often it goes for a hit.
Home run to fly ball ratio is the ratio of how many home runs are hit for every fly ball allowed by a pitcher.
BABIP
A landmark study on BABIP was published in 2000 by Voros McCracken, who was the first to present data that showed “there is little if any difference among Major League pitchers in their ability to prevent hits on balls hit into the field of play.” Essentially what the study showed, and subsequent studies have confirmed, is that all Major League pitchers over the long-term end up close to the league average .300 BABIP, regardless of who the pitcher is. The stance on this has softened slightly with inspection of things like ground ball and fly ball rates, so it’s not quite accurate to say that pitchers have absolutely no control over their BABIP, but it is accurate to say that almost all pitchers will end up clustered around that .300 mark, and anything substantially higher or lower is likely to regress.
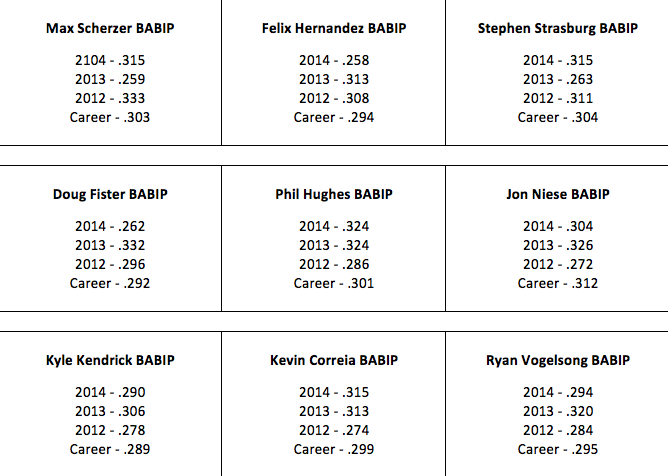
If you get a very large sample size of a better- or worse-than-average BABIP, at least 2,000 balls in play according to FanGraphs, you can begin to consider that pitcher may be able to beat the average. Generally speaking, since ground balls go for hits more often than fly balls, ground ball pitchers will see slightly higher BABIP rates than fly ball pitchers. To see these numbers in action, let’s take a look at the BABIP of three groups of pitchers: pitchers who are considered elite versus average versus below average.

If you have never looked at BABIP before, you might find it quite surprising how nearly identical the career numbers are of elite pitchers like Scherzer, Hernandez and Wainwright to journeymen innings-eaters like Kendrick, Correia, and Vogelsong. And, like the coin flip example, where most sets of 10 flips don’t actually end up five to five, not every season and certainly not every section of every season ends up with a BABIP of exactly .300. But everything is clustered near that mark and eventually regresses towards it.
Unlike pitchers, hitters do have some control over their own BABIP. Throughout their career, batters set their own benchmarks in BABIP. A speedster who hits a lot of ground balls, such as Jose Altuve, may have a BABIP in the .330 to .340 range, while a slow fly ball hitter, such as Brian McCann, can have a BABIP in the .260 range. When looking for outliers in DFS, you can always assume pitchers will regress back towards the league average, but when you see a hitter who is far off from that .300 mark midway through a season, you need to check his career baseline to see where you can expect him to end up.
Home Run to Fly Ball Ratio
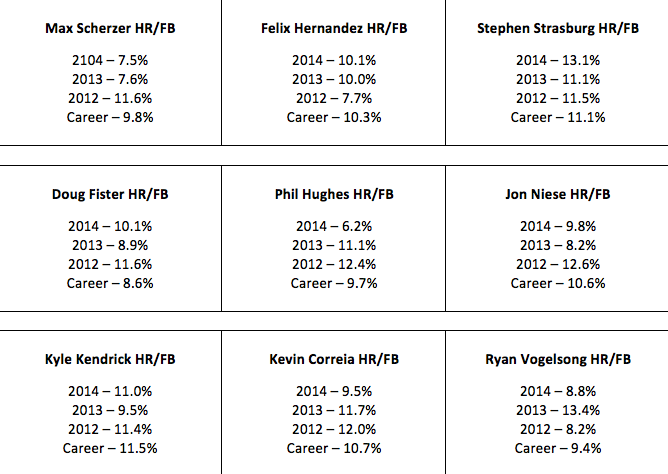
Home run to fly ball ratio gives us a study similar to BABIP. Let’s take a look at the same groups of elite versus average versus below average pitchers to see where they fall compared to the league average 10 percent home run to fly ball ratio.

As was the case with BABIP, we see virtually no difference between the top arms in the game versus the likes of Kevin Correia and Kyle Kendrick in home run to fly ball ratio. Some years it’s a little high, some years a little low, but no pitcher strays too far from that 10 percent average without trending back toward the mean.
Daily Fantasy Takeaways
These 2 data points, BABIP and home run to fly ball ratio, are crucial for understanding the foundation of what makes a pitcher who he is and what is just randomness that can be affected by a small sample size. You need to understand these metrics to use in connection with our upcoming looks at how to find hits and home runs for your DFS lineups.
Taken by themselves, what BABIP and home run to fly ball ratio can show you is whether a fast or slow start from a pitcher is due to bad luck or bad performance. The best scenario for DFS use is when you can see that a pitcher has benefited from fortunate luck through part of the season, carrying a low BABIP and low home run to fly ball ratio. You can use that situation to play against a pitcher who may have a good surface ERA and WHIP, causing other players to avoid hitters against him. You can then have an upside offense at a low ownership percentage.
p=.
p=.
p=.
p=.
Our Premium content will teach you how to be a successful DFS player
- To access this course, you need to have a subscription to RG Premium.
- A Premium subscription will allow you to access this course and all other RotoAcademy courses, as well as Consensus Value Rankings, daily analysis from top-ranked experts, and much more.
Get RG Premium today!
