Introducing PlateIQ Premium Bullpen Tools

RotoGrinders Premium is proud to present our first set of tools aimed at helping you understand MLB Bullpen matchups, the PlateIQ Premium Bullpen Tools.
— PlateIQ Bullpen Leaderboard
— PlateIQ Bullpen Team Dashboard
— Bullpen Dashboard Scenario Splits (Leading / Trailing)
— Bullpen Usage %
PlateIQ Bullpen Leaderboard
The PlateIQ Bullpen leaderboard uses our neutral situation weighted bullpen metrics to create a single view of all teams on today’s slate.
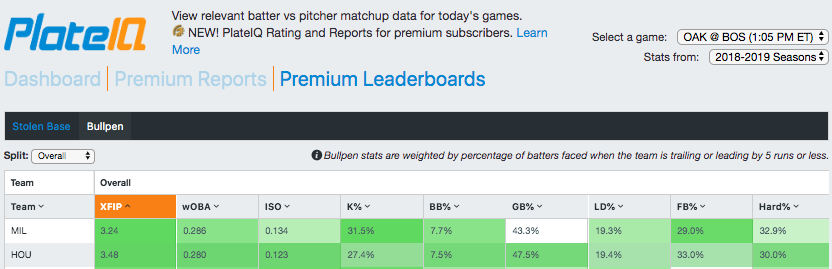
Bullpen stats are weighted (and scaled for currently available players) by percentage of batters faced when the team is trailing or leading by 4 runs or less. We’ll talk more about usage weights later. For now, know that you can now find bullpen metrics for all teams here in the Premium Leaderboards section.
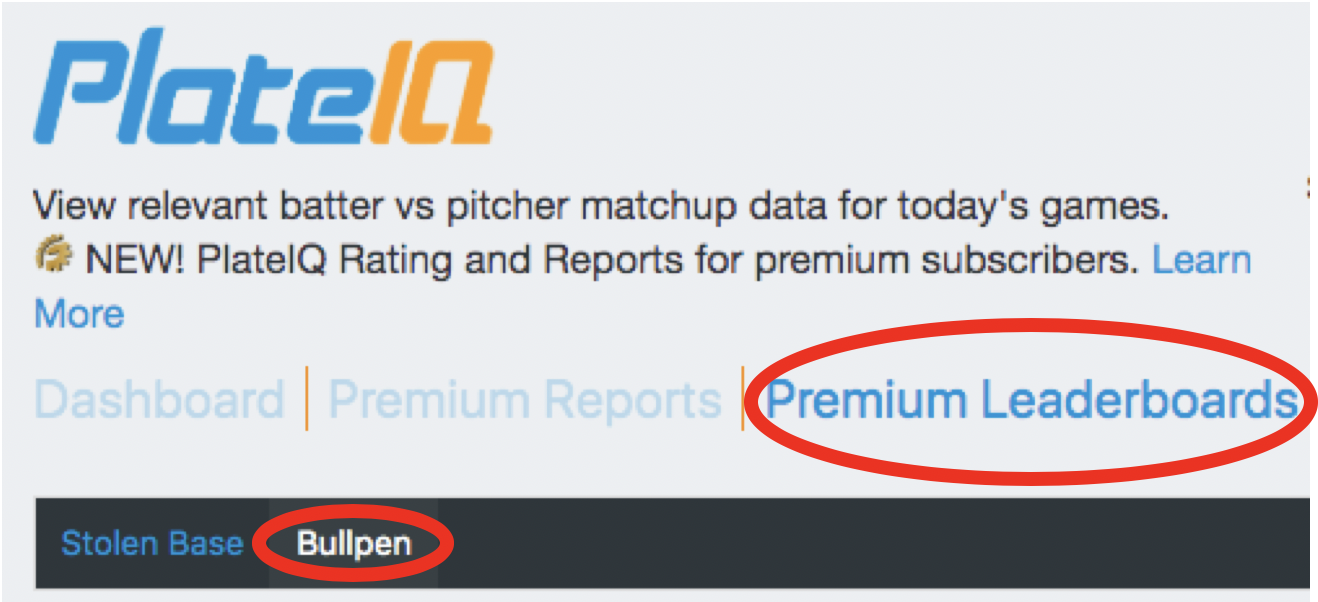
Be sure to stop in and check out who’s leading the pack for tonight’s action! You can find the Leaderboard using the navigation options shown above.
PlateIQ Bullpen Team Dashboard
Premium subscribers will also have access to view team bullpen metrics side by side with their opponents in the PlateIQ Dashboard. You can now select Bullpen options near the top right of the interface to display the current statistics for each team.
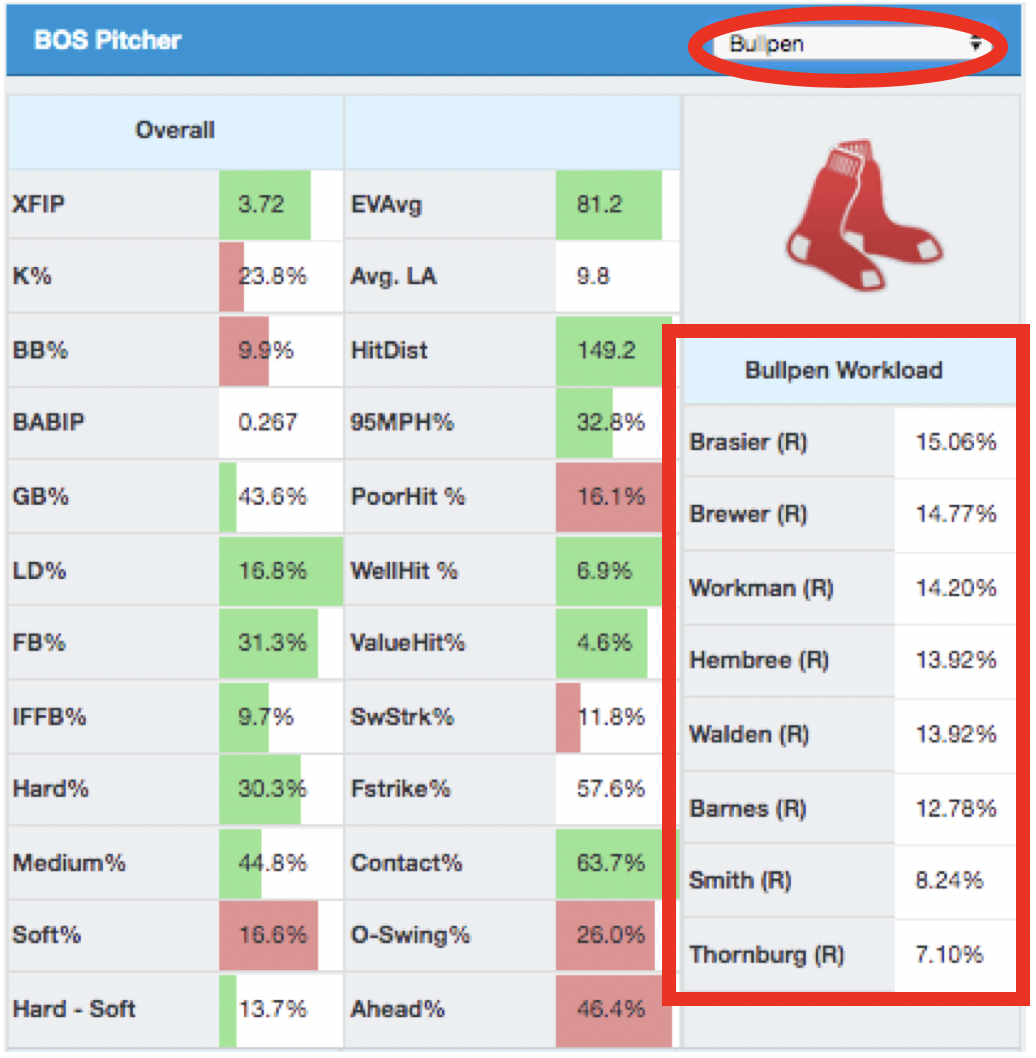
Just a few notes on the statistics you’ll see:
— They are only considering players on the active roster, as displayed underneath the team logo.
— Each player’s statistics are currently considered dating back to the start of 2018 as of now. We will adjust the timeframe as needed to ensure a relatively up to date accounting of pitcher skills.
— Each players usage is considered for their current team only. We have a system of checks in place to ensure the skills of new players are adjusted for when possible, as current arms will shuffle in and out of the active roster for various reasons. Usage is scaled to 100% for the night based on player availability.
— Statistics are weighted in the display based on the scaled usage rates.
— Neutral split usage is measured on a rolling 30-day basis.
PlateIQ Bullpen Scenario Splits (Leading / Trailing)
One thing we wanted to be certain of when we created our bullpen metrics was to acknowledge that not all situations call for the same relievers.
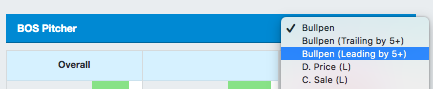
Normally when we target a bullpen, we’re really talking about the players that are likely to be used in a neutral situation. We define that as any score where it is possible to overcome the deficit with a single swing of the bat (within 4 runs). The vast majority of pitches our batters see fall within this range.
However, we may also want to look deeper at what the bullpen looks like when a team is leading or trailing by a large margin (more than 4 runs). In this case, we’ll constantly see that the usage rates shift dramatically on which bullpen arms managers will use in these scenarios. These decision-making adjustments will change the skill profiles you might expect to see for your batters.
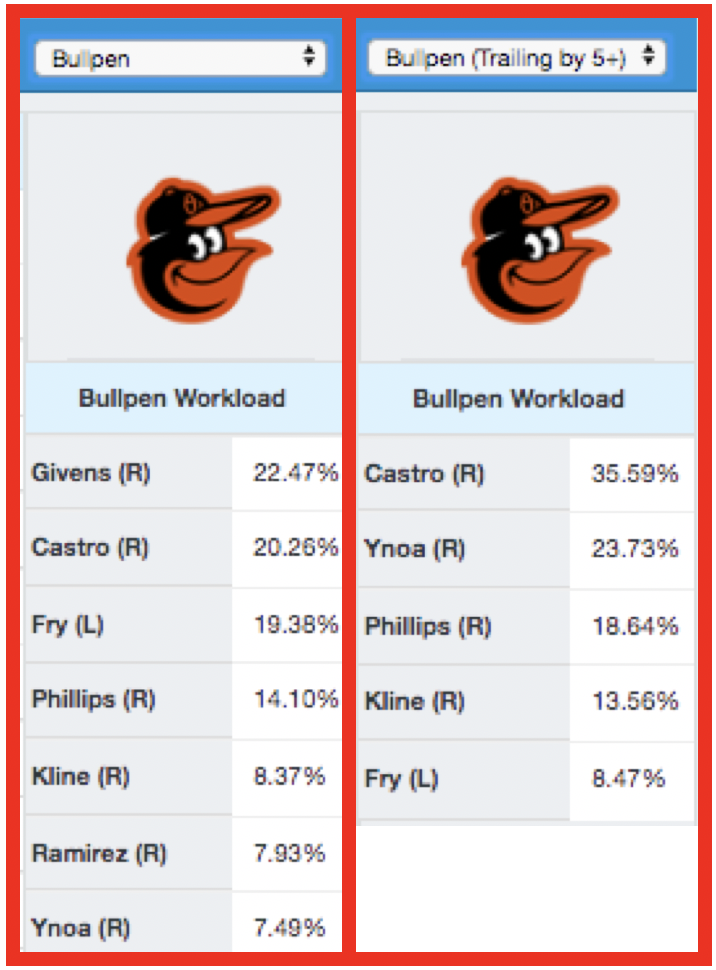
You can see in the example above that in just one month of action, the Orioles (one of the worst teams) don’t even use their best bullpen arms when trailing significantly. Givens and Fry are the players above that see lower usage when trailing by five or more runs, and that just makes sense.
Caution: Before you get too excited about these stats, just know the sample sizes will be much lower for leading and trailing splits. Especially early in the season, focus more on the core bullpen metrics when evaluating bullpens. That doesn’t mean you can’t be aware of usage changes, but certainly also be vigilant about the small samples for many teams.
You can find scaled 2019 PA splits vs. L and R in the dashboard.
Summary
We’ll continue to build off this foundation in the future, with enhancements that display and consider recent pitcher usage as well as better checks and adjustments for the constantly changing rosters of MLB teams. We’ll also look to incorporate bullpen information into the PlateIQ score, and even rate the bullpen itself as a “character.” For now, we’ve got a great tool you can use immediately to better understand the matchups in DFS. We’re looking forward to analyzing this data right alongside you as the 2019 season progresses.