
Is 13 Really Unlucky in Sports? NFL, NBA and NHL Data Says Otherwise

Friday the 13th is traditionally associated with bad luck, but does that superstition hold up in professional sports?
RotoGrinders analyzed 26,900 games across 10 seasons of NFL, NBA and NHL action to find out whether players wearing No. 13 perform worse than those wearing other numbers, and whether games played on Friday the 13th produce unusual results.
The research also examined 614 player-seasons involving 242 athletes who wore No. 13.
The findings suggest No. 13 might not be so unlucky after all. Players wearing the number recorded higher average statistical performance than those wearing other numbers across all three leagues.
Understanding the numbers: Player performance is measured using an index where 100 represents the average for a player’s position in that season. An index of 120 means 20% above-average statistical production, while 80 means 20% below average. For game results, percentages represent the proportion of games with a particular outcome, while scoring, turnovers and penalties are measured as averages per game.
Hopefully the below information might be useful to any DFS or sports enthusiasts! If you’re interested in applying this information on your next player picks, make sure to check out this sleeper promo code before you do.
Key findings
- NFL: No. 13 players recorded a performance index of 116.7, compared with 99.6 for other numbers. No. 13 wide receivers recorded an index of 118.7, compared with 98.6 for their peers.
- NBA: No. 13 players recorded an index of 109.2, compared with 99.7 for other numbers. Their All-Star selection rate was also more than double that of other jersey numbers.
- NHL: No. 13 players recorded an index of 104.2, compared with 99.9 for other numbers. They also appeared in an average of 57.1 games per season, compared with 45.6 for other players.
- NBA: None of the 43 games played on Friday the 13th went to overtime, compared with 5.3% of other NBA games.
- NHL: Teams with weaker pregame records won 55% of Friday the 13th games with a clear favorite, compared with 42.48% of other games.
- NBA: Players wearing No. 13 committed 2.81 fouls per appearance on Friday the 13th, compared with 1.96 on other Fridays.
Do Players Wearing No. 13 Perform Better?
Across 614 player-seasons involving 242 athletes wearing No. 13, the research found above-average statistical performance in all three leagues.
| League | No. 13 performance index | Other numbers | No. 13 player-seasons |
|---|---|---|---|
| NFL | 116.7 | 99.6 | 233 |
| NBA | 109.2 | 99.7 | 182 |
| NHL | 104.2 | 99.9 | 199 |
The NFL showed the largest difference, with No. 13 players recording an index 17.1 points higher than players wearing other numbers.
The NBA recorded a 9.5-point advantage, while the NHL recorded a 4.3-point advantage.
These performance averages use 518 qualifying No. 13 player-seasons. Seasons with insufficient playing time were excluded from the index calculations.
No. 13 players also recorded higher All-Star or Pro Bowl selection rates across all three leagues.
| League | No. 13 All-Star / Pro Bowl rate | Other numbers |
|---|---|---|
| NFL | 9.44% | 5.29% |
| NBA | 8.24% | 3.86% |
| NHL | 9.29% | 4.21% |
Rates measure selections per eligible player-season, not the percentage of individual athletes selected. The NHL calculation excludes seasons without recorded All-Star selections.
In the NBA and NHL, No. 13 players recorded more than double the All-Star selection rate of players wearing other numbers.
There were also differences in how often players appeared on the court, field or ice.
No. 13 player availability compared with other numbers
| League | No. 13 availability | Other numbers | Difference |
|---|---|---|---|
| NFL | 71.1% | 69.0% | +2.1 percentage points |
| NBA | 56.6% | 58.2% | -1.6 percentage points |
| NHL | 73.8% | 58.3% | +15.5 percentage points |
NHL players wearing No. 13 appeared in an average of 57.1 games per season, compared with 45.6 for players wearing other numbers, a difference of 11.5 games.
However, the stronger performance and All-Star figures did not translate into a clear championship advantage.
NFL No. 13 player-seasons had a championship rate of 3.86%, compared with 3.07% for other numbers. In the NBA, the figures were 3.30% versus 3.48%, while the NHL recorded 3.02% versus 3.30%.
Interested in trading on some NFL players wearing the No. 13 jersey? You can trade on Brock Purdy’s 49ers on platforms like Polymarket. You can check out the latest offers on our Polymarket invite code page.
Which Positions Perform Best Wearing No. 13?
The advantage was not equally distributed across positions.
| League | Position | No. 13 index | Other numbers | No. 13 player-seasons |
|---|---|---|---|---|
| NFL | Quarterback | 124.7 | 99.7 | 10 |
| NFL | Wide receiver | 118.7 | 98.6 | 181 |
| NFL | Running back | 22.9 | 100.2 | 4 |
| NBA | Guard | 112.0 | 99.7 | 62 |
| NBA | Forward | 110.6 | 99.7 | 62 |
| NBA | Center | 104.6 | 99.6 | 58 |
| NHL | Forward | 106.8 | 99.7 | 187 |
| NHL | Defenseman | 52.9 | 100.2 | 12 |
NFL wide receivers were particularly influential, accounting for 181 of the league’s 233 No. 13 player-seasons, or 77.7%.
NBA players wearing No. 13 performed above the benchmark across guards, forwards and centers, with guards recording the highest index at 112.0.
In the NHL, forwards wearing No. 13 recorded a performance index of 106.8, compared with 99.7 for other forwards.
There were exceptions. NFL running backs wearing No. 13 recorded an index of just 22.9, while NHL defensemen recorded 52.9. Both groups involved very small samples, with four and 12 player-seasons respectively.
The Sports Stars Who Made No. 13 Look Lucky
Some of the biggest names in professional sports have worn No. 13, helping explain the number’s strong performance.
- Mike Evans (NFL): Earned six Pro Bowl selections across 10 seasons wearing No. 13.
- Keenan Allen (NFL): Recorded six Pro Bowl selections during the study period, with an average performance index of 245.6 across nine qualifying seasons.
- Michael Thomas (NFL): Recorded a performance index of 346.2 in 2019, averaging 23.41 PPR fantasy points per game.
- James Harden (NBA): Averaged 36.1 points per game for the Houston Rockets in 2018-19, recording a performance index of 372.1.
- Paul George (NBA): Earned six All-Star selections across eight seasons wearing No. 13.
- Bam Adebayo (NBA): Recorded three All-Star selections while wearing No. 13.
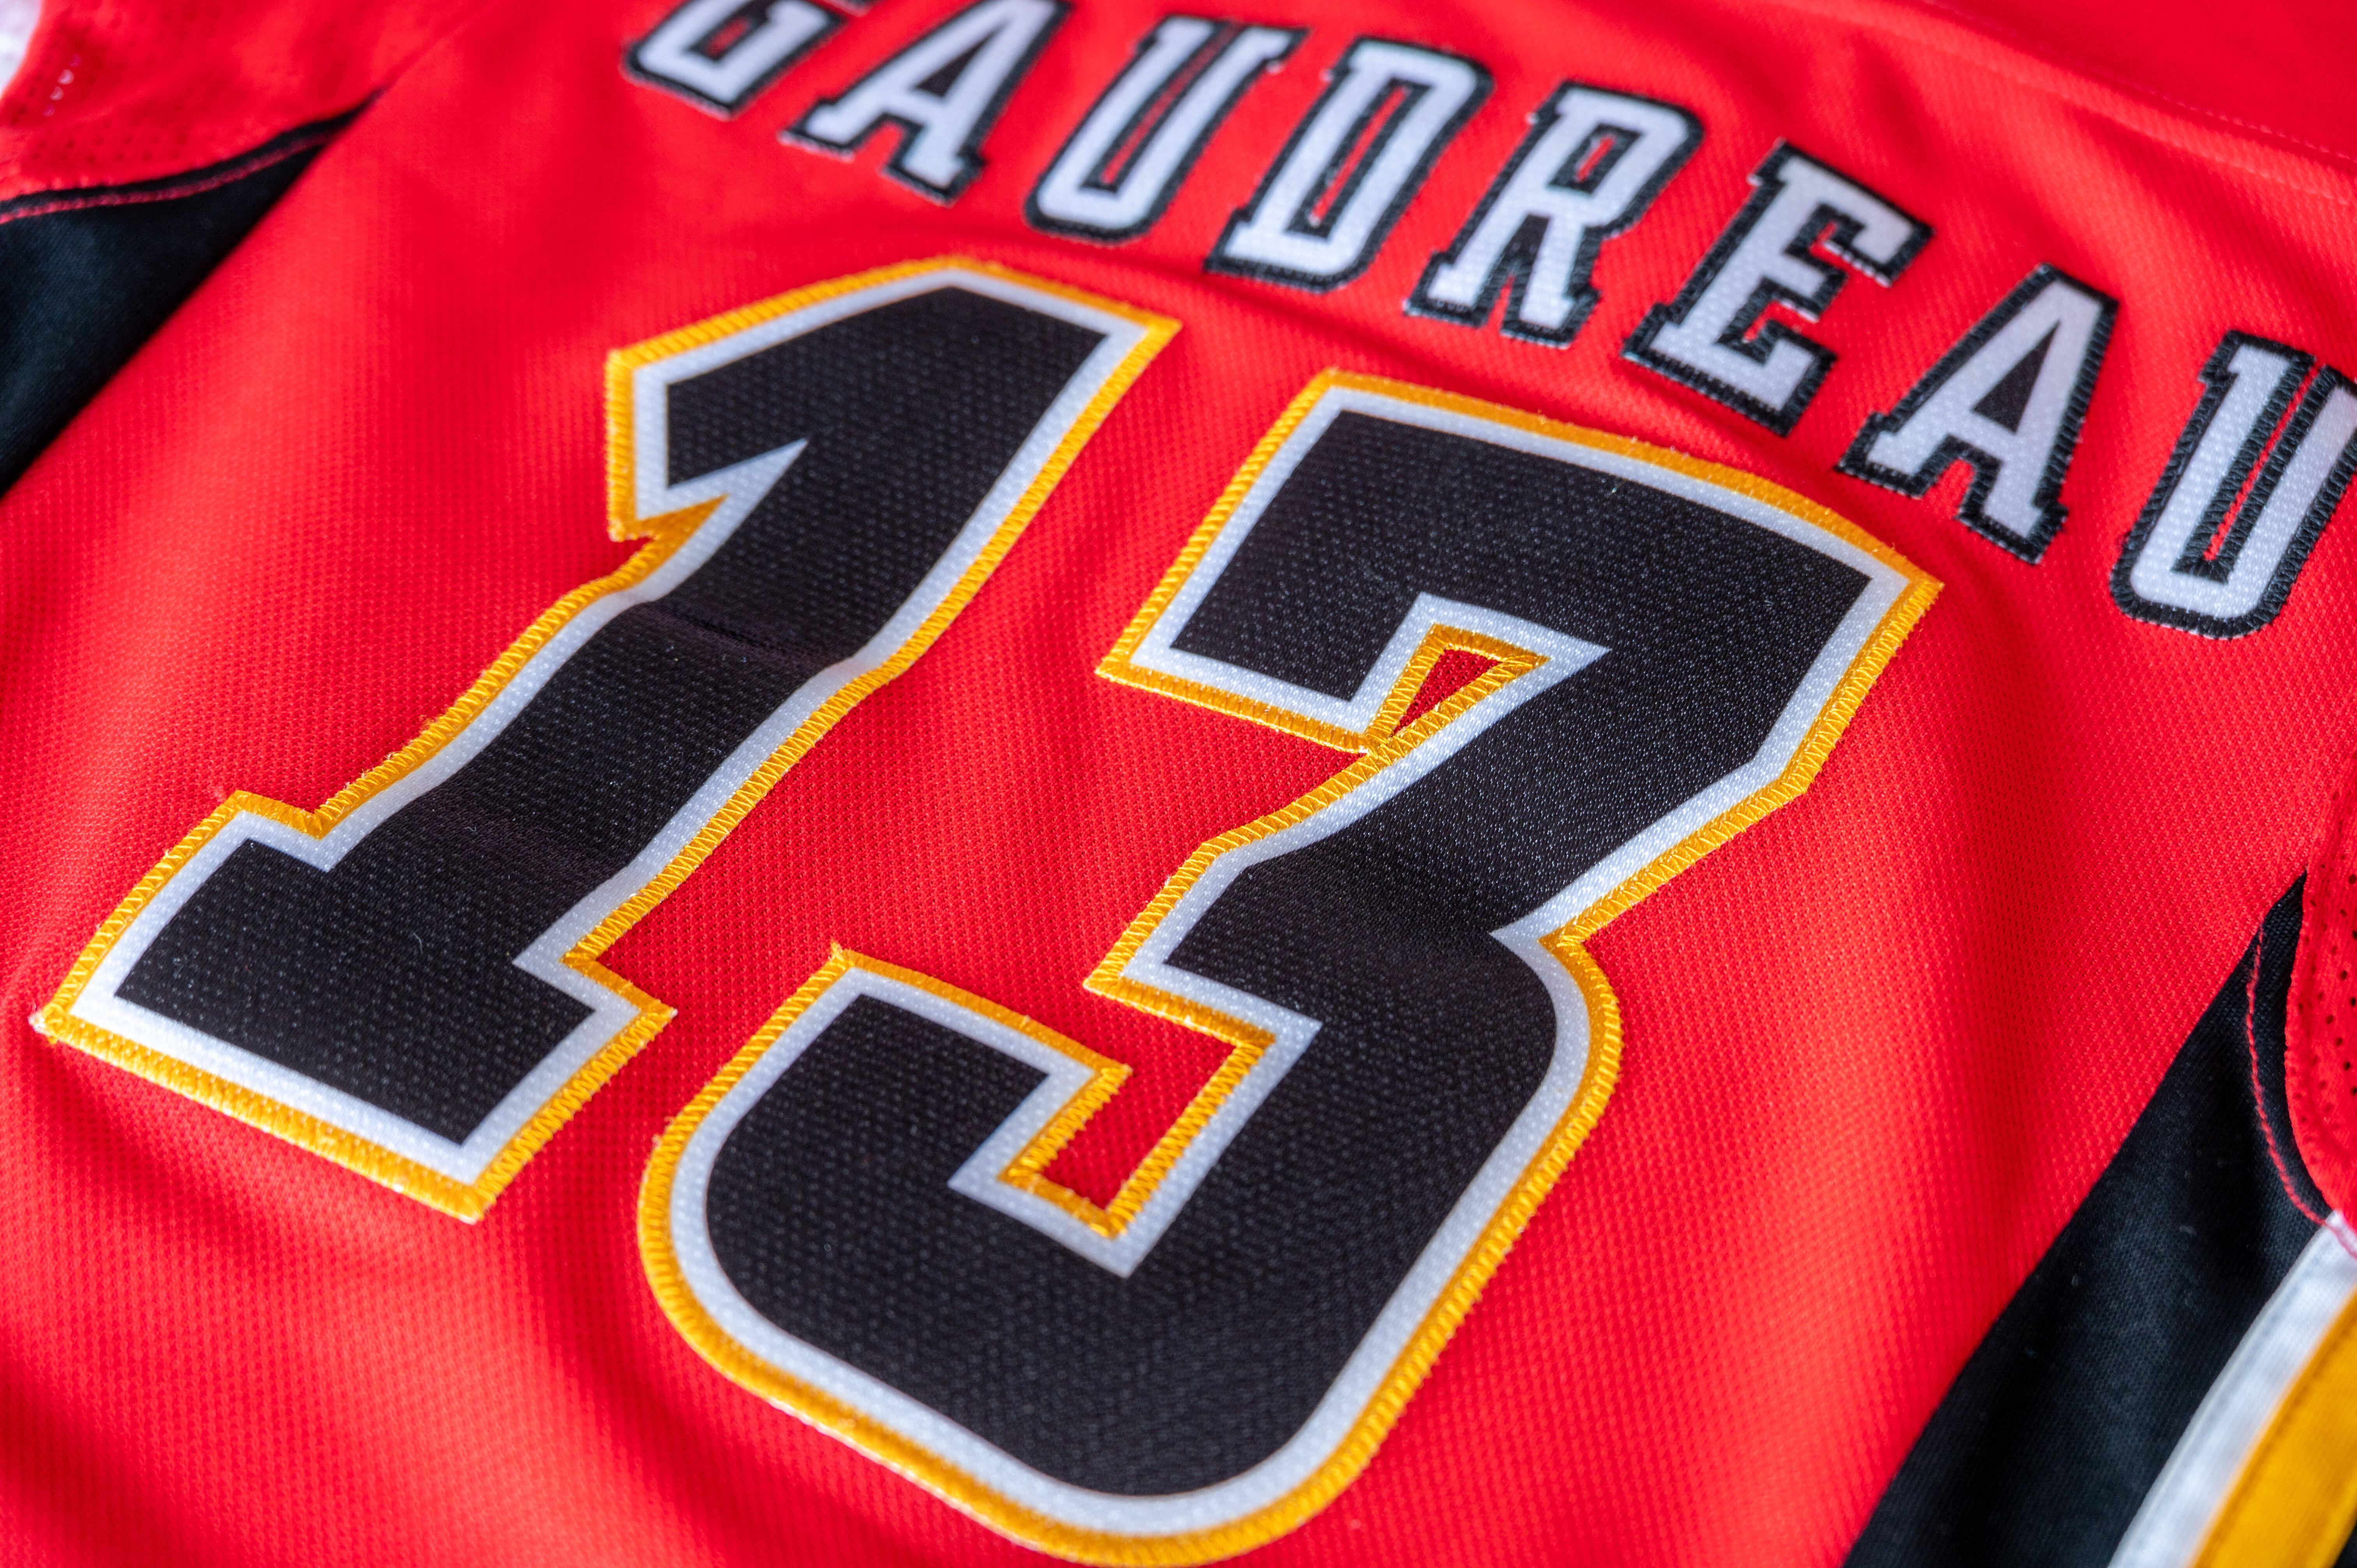
- Johnny Gaudreau (NHL): Earned five All-Star selections while wearing No. 13. His 2021-22 season produced 1.402 points per game and a performance index of 296.5.
- Mathew Barzal (NHL): Recorded three All-Star selections across 10 seasons.
- Sam Reinhart (NHL): Was part of two Stanley Cup-winning seasons with the Florida Panthers while wearing No. 13.
A small number of stars accounted for a large share of the No. 13 All-Star and Pro Bowl appearances.
In the NFL, Mike Evans and Keenan Allen combined for 12 of the 22 Pro Bowl player-seasons recorded by No. 13 players, or 54.5%.
In the NBA, James Harden and Paul George accounted for 11 of the 15 No. 13 All-Star player-seasons, or 73.3%.
Johnny Gaudreau and Mathew Barzal accounted for eight of the 13 recorded NHL No. 13 All-Star player-seasons, or 61.5%.
How Much Do Star Players Influence the Results?
To understand the influence of these athletes, RotoGrinders recalculated the No. 13 performance index after removing selected standout players.
| League | Original No. 13 index | Index without selected stars |
|---|---|---|
| NFL | 116.7 | 101.0 |
| NBA | 109.2 | 93.1 |
| NHL | 104.2 | 91.1 |
NFL excludes Mike Evans and Keenan Allen; NBA excludes James Harden and Paul George; NHL excludes Johnny Gaudreau, Sam Reinhart and Mathew Barzal.
The NFL average falls close to the benchmark of 100 without Evans and Allen, while the NBA and NHL averages drop below it after the selected stars are excluded.
This illustrates how heavily a small group of exceptional players can influence the overall results. The exclusions are illustrative rather than a statistical test of whether wearing No. 13 changes performance.
Does Friday the 13th Affect Sports Results?
RotoGrinders also examined whether games played on Friday the 13th produced different results from games played on other dates.
The research looked at scoring, close games, overtime, upsets, turnovers, penalties and blown leads.
There were 65 Friday the 13th games across the NBA and NHL during the study period. NFL games were analyzed separately using games played on the 13th of any month.
NHL: More Upsets and Penalties on Friday the 13th
NHL teams with weaker pregame records won 55% of Friday the 13th games, compared with 42.48% on other dates, a difference of 12.52 percentage points.
Friday the 13th games also saw more penalties, averaging 8.50 per game compared with 7.31 normally, an increase of approximately 16%.
Despite the higher upset rate, these games were less likely to be close or reach overtime.
Only 27.27% were classified as close games, compared with 41.42% normally, while 13.64% went to overtime against a usual rate of 22.49%.
Games on Friday the 13th also averaged fewer goals, with 5.59 combined goals compared with 6.00 on other dates.
NHL Friday the 13th statistics
| Metric | Friday the 13th | Other games |
|---|---|---|
| Games analyzed | 22 | 12,260 |
| Average combined goals | 5.59 | 6.00 |
| Close games | 27.27% | 41.42% |
| Overtime | 13.64% | 22.49% |
| Upsets | 55.00% | 42.48% |
| Turnovers per game | 17.23 | 19.86 |
| Penalties per game | 8.50 | 7.31 |
| Blown leads | 9.09% | 9.37% |
The upset comparison uses 20 Friday the 13th games with an identifiable favorite. All other Friday the 13th metrics cover 22 games.
Were No. 13 players responsible for the extra penalties?
Interestingly, NHL players wearing No. 13 were penalized less often on Friday the 13th than on other dates.
Across 24 No. 13 player appearances on Friday the 13th, just two penalties were recorded, an average of 0.083 per appearance.
That compares with 0.157 penalties per appearance for No. 13 players on other dates and 0.232 for players wearing other numbers on Friday the 13th.
Although overall NHL games saw more penalties on Friday the 13th, the No. 13 players in the sample did not follow that pattern.
The sample is small, however, with only 24 No. 13 player appearances.
NBA: Not a Single Friday the 13th Game Went to Overtime
None of the 43 NBA games played on Friday the 13th went to overtime, compared with 5.3% of games played on other dates.
Friday the 13th games were also less likely to produce upsets.
Teams with weaker pregame records won just 23.81% of these matchups, compared with 36.79% of other NBA games, a difference of 12.98 percentage points.
There were fewer close finishes, too. Only 23.26% of Friday the 13th games were classified as close, compared with 26.08% of other games.
Scoring was almost identical, with Friday the 13th games averaging 222.84 combined points against 223.18 on other dates.
NBA Friday the 13th statistics
| Metric | Friday the 13th | Comparison games |
|---|---|---|
| Games analyzed | 43 | 11,936 |
| Average combined points | 222.84 | 223.18 |
| Close games | 23.26% | 26.08% |
| Overtime | 0.00% | 5.30% |
| Upsets | 23.81% | 36.79% |
| Turnovers per game | 28.67 | 28.50 |
| Fouls per game | 40.30 | 39.79 |
| Blown leads | 13.95% | 17.41% |
Scoring, close games, overtime and upsets are compared with all other NBA games. Turnovers, fouls and blown leads are compared with other Friday games. The upset calculation uses 42 Friday the 13th games with an identifiable favorite.
While scoring and total fouls remained largely unchanged, the individual foul records reveal another interesting pattern involving players wearing No. 13.
NBA No. 13 players committed 44% more fouls per appearance on Friday the 13th than on other Fridays.
Across 21 appearances on Friday the 13th, players wearing No. 13 committed 59 personal fouls, an average of 2.81 per game.
On other Fridays, they averaged 1.96 fouls per appearance. Players wearing other jersey numbers averaged 1.92 fouls on Friday the 13th.
Three well-known No. 13 players each recorded five fouls on Friday, December 13, 2019: James Harden, Paul George and Jaren Jackson Jr.
The individual No. 13 sample remains small, but this is one area where the superstition produced a more unusual statistical result.
NFL: Games on the 13th Have Slightly Higher Scores and More Blown Leads
No NFL games fell on Friday the 13th during the study period, so RotoGrinders instead examined 87 NFL games played on the 13th of any month.
These games averaged 46.83 combined points, compared with 45.54 on other dates, an increase of 1.29 points per game.
Games on the 13th also had slightly more upsets, with teams holding weaker pregame records winning 40.30% of eligible matchups, compared with 36.62% normally.
The biggest difference involved blown leads. These occurred in 18.39% of games played on the 13th, compared with 15.36% on other dates, a rise of 3.03 percentage points.
Overtime was less frequent, occurring in 3.45% of games on the 13th compared with 5.53% of other NFL games.
NFL games played on the 13th
| Metric | Games on the 13th | Other games |
|---|---|---|
| Games analyzed | 87 | 2,552 |
| Average combined points | 46.83 | 45.54 |
| Close games | 55.17% | 52.98% |
| Overtime | 3.45% | 5.53% |
| Upsets | 40.30% | 36.62% |
| Turnovers per game | 2.74 | 2.61 |
| Penalties per game | 12.62 | 12.47 |
| Blown leads | 18.39% | 15.36% |
The upset comparison uses 67 games played on the 13th where a favorite could be identified. All other metrics cover 87 games.
Did wearing No. 13 make NFL players more likely to be penalized?
Players wearing No. 13 recorded 11 penalties across 87 player appearances on the 13th of a month, averaging 0.126 penalties per appearance.
On other dates, No. 13 players averaged 0.091 penalties per appearance.
However, players wearing other numbers averaged 0.128 penalties per appearance on the 13th, almost identical to the No. 13 group.
Unlike the NHL and NBA, the overall NFL results show relatively small differences across most measures. Games on the 13th were marginally higher scoring and slightly more likely to feature a blown lead, but there was no clear pattern suggesting the date produced substantially different outcomes.
So, Is 13 Really Unlucky?
The research found no consistent evidence that No. 13 is associated with worse sporting performance.
In fact, players wearing the number recorded higher average statistical production across the NFL, NBA and NHL, alongside higher All-Star and Pro Bowl selection rates.
The game-day results were more mixed.
NHL games on Friday the 13th saw more upsets and penalties, while NBA games were less likely to feature an upset or overtime. NBA No. 13 players also committed more personal fouls per appearance on Friday the 13th, despite overall game foul rates remaining largely unchanged.
NFL games played on the 13th showed only modest differences from other dates.
That doesn’t make 13 a lucky number, either. A relatively small group of star athletes contributed heavily to the player results, and removing selected stars substantially reduced the performance advantage.
The findings challenge the superstition, but they don’t suggest that the date or jersey number determines sporting success.
Methodology
RotoGrinders analyzed 10 regular seasons across the NFL (2016-2025), NBA and NHL (2016-17 to 2025-26).
The research covered:
- NFL: 2,639 regular-season games.
- NBA: 11,979 regular-season games.
- NHL: 12,282 regular-season games.
- Jersey No. 13 analysis: 614 player-seasons involving 242 distinct athletes.
Player performance
Player performance was measured against the average for the same position and season using:
- NFL: PPR fantasy points per game for quarterbacks, running backs, wide receivers and tight ends.
- NBA: Points per game.
- NHL: Points per game for skaters, or save percentage for goaltenders.
The performance index divides a player’s statistical output by the position-season average and multiplies the result by 100.
A score of 100 represents the average for that position and season.
The performance index required at least 10 games played, or four in the NFL. Only qualifying player-seasons were included in the index averages.
Availability was calculated as games played divided by the number of team games that season.
All-Star and Pro Bowl rates represent selections per player-season. NHL seasons without recorded All-Star selections were excluded from the All-Star rate calculation.
Championship percentages represent the share of player-seasons in which the player’s team won the league championship.
Friday the 13th game analysis
Friday the 13th comparisons included 43 NBA games and 22 NHL games.
NFL games were analyzed separately using the 13th of any month.
Game statistics were calculated as follows:
- Close games: Final margin of one goal or fewer in the NHL, five points or fewer in the NBA, and eight points or fewer in the NFL.
- Overtime: Games continuing beyond regulation, including NHL shootouts.
- Upsets: Games won by a team with a lower pregame win percentage than its opponent. NHL calculations used pregame points percentage. Games without an identifiable favorite were excluded.
- Blown leads: Games in which the team leading entering the final period went on to lose.
- Turnovers: Giveaways in the NHL, turnovers in the NBA, and interceptions plus lost fumbles in the NFL.
- Penalties: Recorded penalties in the NHL and NFL, and personal fouls in the NBA.
For NBA turnovers, fouls and blown leads, Friday the 13th games were compared with other games played on Fridays. Other comparisons used games on all other dates.
Individual No. 13 penalty comparisons used player-game appearances rather than distinct players. They were not adjusted for playing time.
Data was collected in October 2026 from Basketball-Reference, NHL official data sources, nflverse and Pro Bowl records.
Limitations: Friday the 13th game samples are small, and the research identifies associations rather than cause and effect. Players may choose their jersey numbers, while individual stars can heavily influence league averages. Different sports also use different performance statistics, so index scores should not be treated as directly comparable measures of overall player ability.
IMAGE CREDIT: ALAMY