
The Most Fantasy Football Obsessed States in 2026

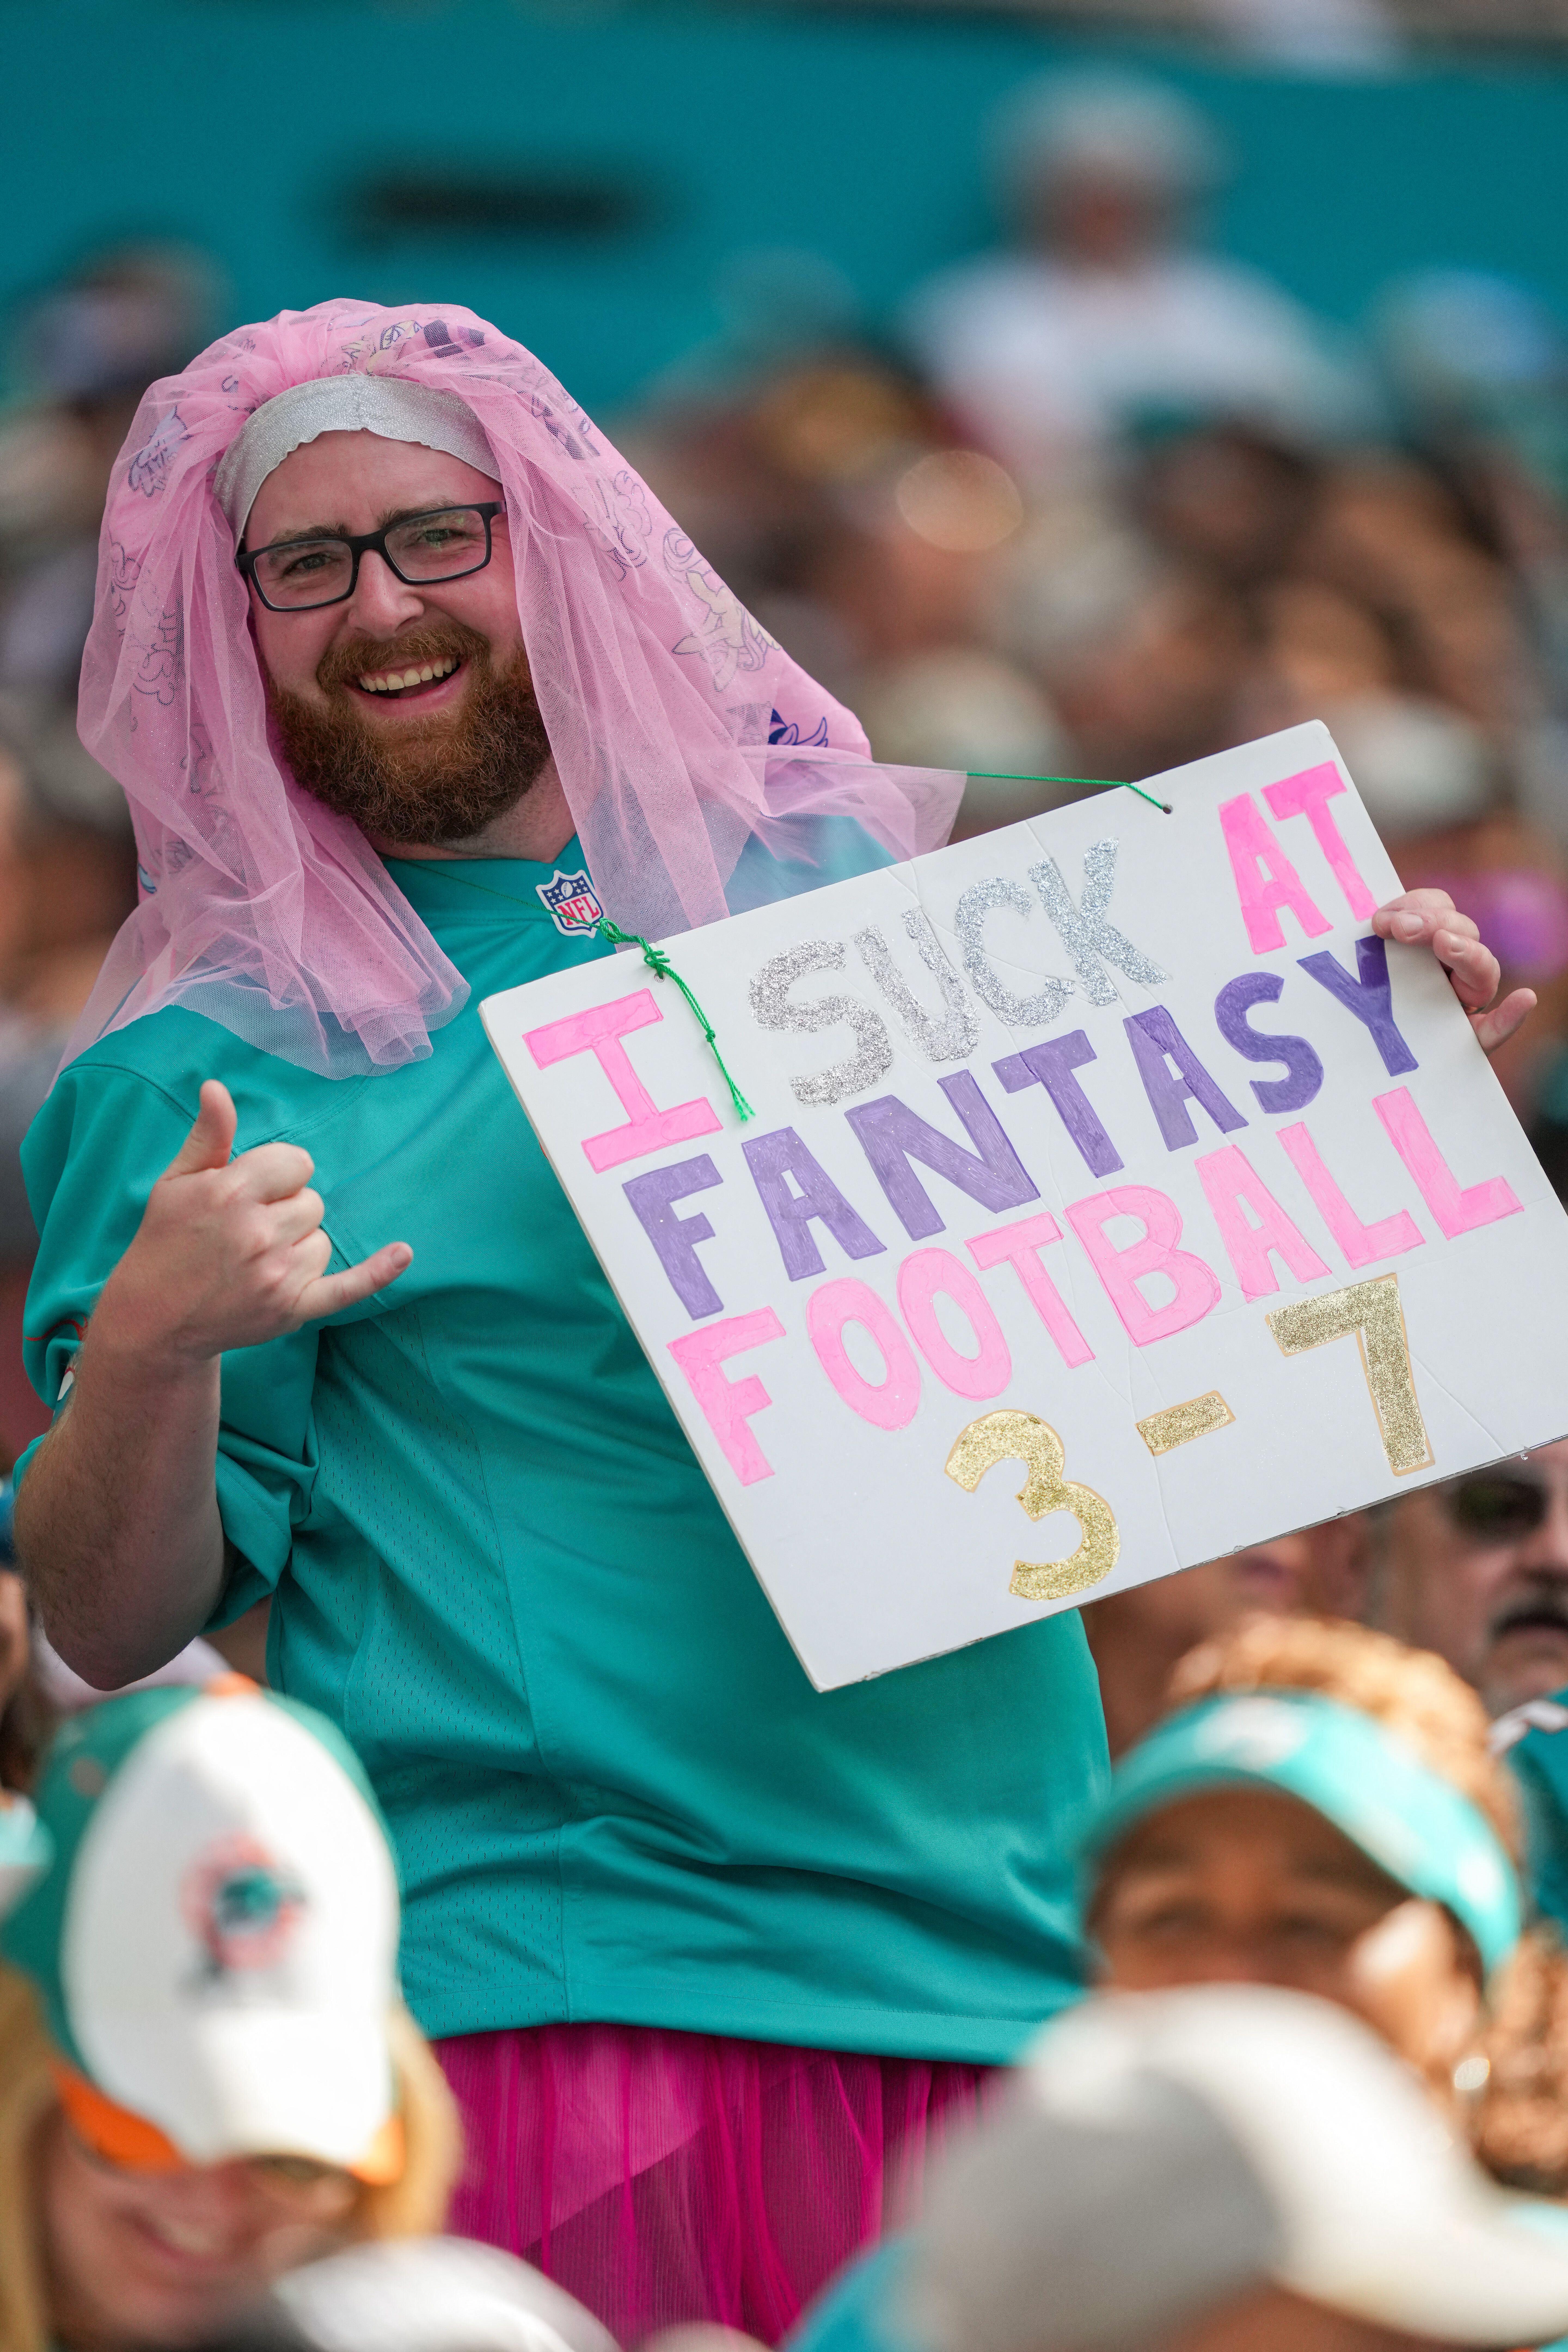
[PHOTO CREDIT: ALAMY]
With the NFL season bearing down, RotoGrinders analyzed Google search data across all 50 states and Washington, D.C. to find out where fantasy football obsession runs deepest. We pulled search volume for eight fantasy-specific terms, including “Fantasy Football,” “ESPN Fantasy,” “NFL Fantasy” and “Yahoo Fantasy,” then measured searches per 100,000 residents in every state to level the playing field between small and large populations.
Washington, D.C. tops the list, but Minnesota is the most obsessed actual state in the country, and the gap between the coasts and the South is stark. Fantasy managers drafting a team this year can also compare the best DFS apps to see where the rest of the country is putting its rosters together.
Washington, D.C. Searches Fantasy Football More Than Anywhere Else
D.C. posts 929.9 fantasy football searches per 100,000 residents, more than 2.5 times the national average of 370.7. The generic term “Fantasy Football” alone accounts for 2,900 of D.C.‘s 6,450 total searches, and ESPN Fantasy pulls in another 1,600. For a jurisdiction of just 693,645 people, that’s a search rate no state comes close to matching.
Minnesota Is the Most Fantasy Football Obsessed State
Strip out D.C. and Minnesota takes over at No. 1, posting 661.9 searches per 100,000 people, the highest of any actual state. Minnesotans ran 38,590 total fantasy football searches, led by 18,100 for “Fantasy Football” itself and 6,600 for ESPN Fantasy. Wisconsin (517.0) and Massachusetts (510.5) round out the next tier, both closing in on 30,000-plus total searches despite smaller populations than fantasy football hotbeds like Texas and Florida.
The 10 Most Fantasy Football Obsessed States
- District of Columbia — 929.9 searches per 100k
- Minnesota — 661.9 searches per 100k
- Wisconsin — 517.0 searches per 100k
- Massachusetts — 510.5 searches per 100k
- Pennsylvania — 503.1 searches per 100k
- Colorado — 501.6 searches per 100k
- Illinois — 490.6 searches per 100k
- Connecticut — 473.9 searches per 100k
- New Jersey — 467.3 searches per 100k
- New York — 454.4 searches per 100k
Pennsylvania and Illinois stand out for volume as much as rate. Pennsylvania logged 65,700 total fantasy football searches, the most of any state in the top 10, while Illinois racked up 62,400. Both states search “ESPN Fantasy” and “NFL Fantasy” at nearly identical rates (Pennsylvania: 12,100 and 4,400; Illinois: 12,100 and 3,600), suggesting a Midwest-to-Northeast fantasy corridor that spans platforms rather than favoring one. Managers in those states looking to add another platform to the rotation can lock in a Sleeper promo code before setting a lineup.
Where Fantasy Football Obsession Runs Coldest
Mississippi posts the lowest search rate in the country at 167.9 per 100,000 people, less than a fifth of D.C.‘s rate and well under half the national average. Arkansas (198.7), Alabama (199.7), New Mexico (208.0) and Alaska (219.7) round out the bottom five. Every state in the bottom five sits in the South or the most sparsely populated corners of the West, a pattern that holds up across the full 51-region dataset.
The Full Picture: A Northern and Coastal Game
Line up the top 10 against the bottom 10 and the split is almost entirely geographic. Every state in the top 10 sits in the Northeast, Upper Midwest or Mountain West. Every state in the bottom five is in the South. New York, at No. 10 with 454.4 searches per 100k, still searches fantasy football at more than double Mississippi’s rate, even though New York’s raw population of 20 million dwarfs Mississippi’s 2.95 million.
That gap shows up in scale, too. New York alone generated 90,900 fantasy football-related searches this year, more than the bottom 10 states combined. For anyone building a squad in a high-volume state like New York or Pennsylvania, an Underdog promo code is worth checking before the season kicks off.
Full State-by-State Ranking
| Rank | State | Searches per 100k | 2025 Est. Population | Total Searches |
|---|---|---|---|---|
| 1 | District of Columbia | 929.87 | 693,645 | 6,450 |
| 2 | Minnesota | 661.88 | 5,830,405 | 38,590 |
| 3 | Wisconsin | 517.01 | 5,972,787 | 30,880 |
| 4 | Massachusetts | 510.48 | 7,154,084 | 36,520 |
| 5 | Pennsylvania | 503.08 | 13,059,432 | 65,700 |
| 6 | Colorado | 501.62 | 6,012,561 | 30,160 |
| 7 | Illinois | 490.60 | 12,719,141 | 62,400 |
| 8 | Connecticut | 473.91 | 3,688,496 | 17,480 |
| 9 | New Jersey | 467.31 | 9,548,215 | 44,620 |
| 10 | New York | 454.44 | 20,002,427 | 90,900 |
| 11 | Iowa | 452.08 | 3,238,387 | 14,640 |
| 12 | North Dakota | 445.36 | 799,358 | 3,560 |
| 13 | Rhode Island | 439.65 | 1,114,521 | 4,900 |
| 14 | California | 419.00 | 39,355,309 | 164,900 |
| 15 | Hawaii | 418.75 | 1,432,820 | 6,000 |
| 16 | New Hampshire | 418.27 | 1,415,342 | 5,920 |
| 17 | Virginia | 409.23 | 8,880,107 | 36,340 |
| 18 | Washington | 396.32 | 8,001,020 | 31,710 |
| 19 | Maryland | 395.51 | 6,265,347 | 24,780 |
| 20 | Nebraska | 389.99 | 2,018,006 | 7,870 |
| 21 | Michigan | 389.22 | 10,127,884 | 39,420 |
| 22 | Missouri | 388.00 | 6,270,541 | 24,330 |
| 23 | Ohio | 383.34 | 11,900,510 | 45,620 |
| 24 | Delaware | 374.55 | 1,059,952 | 3,970 |
| 25 | South Dakota | 353.98 | 935,094 | 3,310 |
| 26 | Kansas | 352.01 | 2,977,220 | 10,480 |
| 27 | Maine | 349.85 | 1,414,874 | 4,950 |
| 28 | Arizona | 348.25 | 7,623,818 | 26,550 |
| 29 | Nevada | 345.50 | 3,282,188 | 11,340 |
| 30 | Vermont | 336.61 | 644,663 | 2,170 |
| 31 | Texas | 330.18 | 31,709,821 | 104,700 |
| 32 | Oregon | 329.70 | 4,273,586 | 14,090 |
| 33 | Indiana | 327.53 | 6,973,333 | 22,840 |
| 34 | North Carolina | 320.24 | 11,197,968 | 35,860 |
| 35 | Utah | 319.31 | 3,538,904 | 11,300 |
| 36 | Florida | 314.12 | 23,462,518 | 73,700 |
| 37 | Wyoming | 295.54 | 588,753 | 1,740 |
| 38 | Georgia | 291.08 | 11,302,748 | 32,900 |
| 39 | Montana | 284.79 | 1,144,694 | 3,260 |
| 40 | Idaho | 272.45 | 2,029,733 | 5,530 |
| 41 | South Carolina | 270.54 | 5,570,274 | 15,070 |
| 42 | Kentucky | 263.95 | 4,606,864 | 12,160 |
| 43 | Tennessee | 262.47 | 7,315,076 | 19,200 |
| 44 | Louisiana | 255.29 | 4,618,189 | 11,790 |
| 45 | West Virginia | 229.88 | 1,766,147 | 4,060 |
| 46 | Oklahoma | 228.22 | 4,123,288 | 9,410 |
| 47 | Alaska | 219.73 | 737,270 | 1,620 |
| 48 | New Mexico | 207.95 | 2,125,498 | 4,420 |
| 49 | Alabama | 199.69 | 5,193,088 | 10,370 |
| 50 | Arkansas | 198.73 | 3,114,791 | 6,190 |
| 51 | Mississippi | 167.90 | 2,954,160 | 4,960 |
Source: RotoGrinders analysis of Google Keyword Planner search volume across eight fantasy football-related terms, per 100,000 residents by state, 2025 estimated population.
Methodology
RotoGrinders used Google Keyword Planner to pull search volume for eight fantasy football-related terms in every U.S. state and Washington, D.C.: “Fantasy Football,” “ESPN Fantasy,” “CBS Sports Fantasy,” “Fantrax,” “Fleaflicker,” “MyFantasyLeague,” “NFL Fantasy” and “Yahoo Fantasy.” Total searches for each state were then divided by that state’s 2025 estimated population and expressed as a rate per 100,000 residents, allowing for a fair comparison between states of different sizes. States were ranked by that per-capita search rate, from most to least obsessed.