NFL DFS Optimal Stacks Tool: DraftKings


About The NFL DFS Optimal Stacks Tool
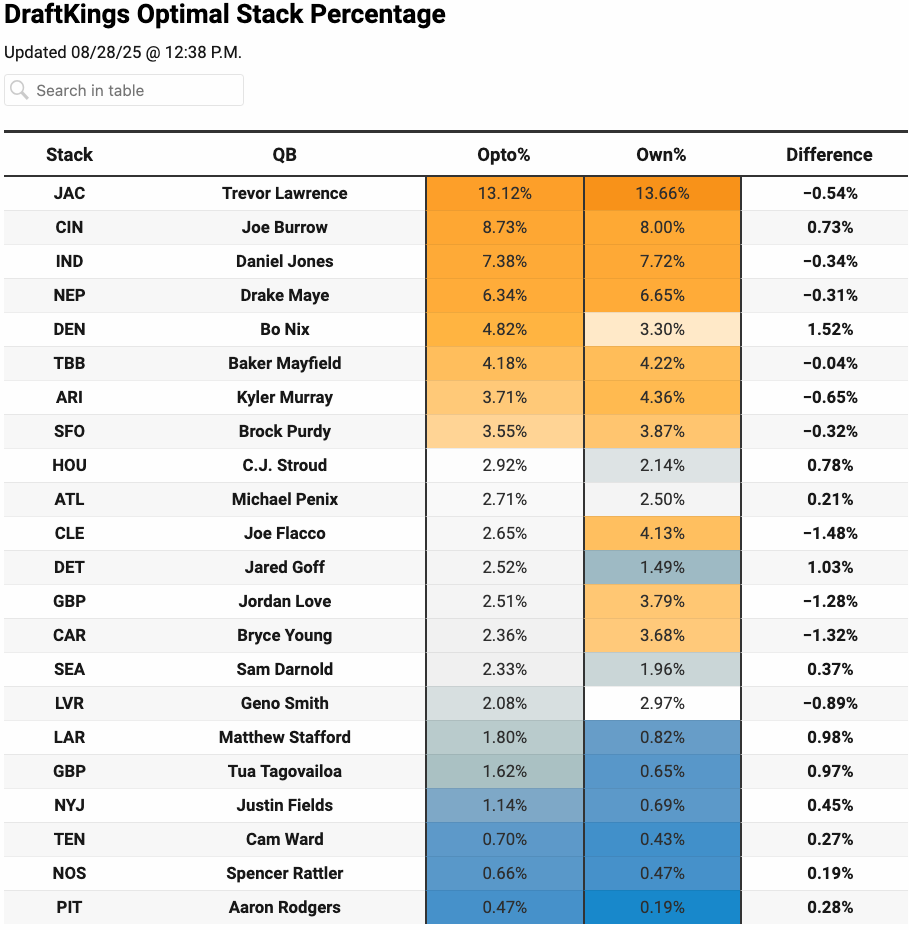
The DraftKings NFL DFS Optimal Stacks tool helps you visualize the expected success rate of team stack with the expected probability.
Using player correlations is a proven method to increase your chances of success in NFL DFS tournaments, and that means pairing a quarterback with at least one other member of his team on the vast majority of your lineups. This chart is intended to help you make decisions on which quarterback stacks to consider and the exposure to those quarterbacks across your lineups.
The optimal percentage is derived from a simulation of thousands of games on a play-by-play basis. This creates a realistic range of outcomes and set of data from which we can run analysis. From there, we find the top lineups from each simulated slate using the engine from our NFL lineup optimizer, LineupHQ. We tabulate the stats from those lineups and deliver to you the frequency in which each stack appeared relative to the sample.
You can apply your analysis from this table to your builds in LineupHQ and formulate a winning strategy for the upcoming slate. This table will be updated each time we run a simulation update, and the timestamp for our latest projection update is also available in LineupHQ.
Here is an example of what the chart looks like for our Premium Subscribers
Want to see more? Sign up for NFL Premium!
-
-
-
This content can help you make better NFL DFS picks
- To access this content, subscribe to NFL Premium or purchase a 3-day trial.
- An NFL subscription will allow you to access this content and much more!
About the Author
Chris Gimino is a top 4 most accurate fantasy football expert (per FantasyPros) and a key contributor at RotoGrinders. Alongside our team of specialists, his work drives projections, simulations, ownership insights, and analytics across 15+ sports, supporting betting, DFS, and fantasy pick’em contests.
A Best Ball Millionaire finalist, multiple-time DFS Live Finalist, winner of six-figure prizes, and the inaugural FastDraft Origins champion, Chris brings a wealth of experience to deliver actionable tools and expert advice for RotoGrinders Premium subscribers. Follow Chris on X – @ChrisGimino