
NFL Matchups Tool: Usage, Advanced Metrics, Team Rankings, Odds, and Matchups

What is this Tool?
The NFL matchups tool is a weekly research dashboard for NFL DFS and betting decisions. It pulls together team-level tendencies, player usage, and matchup context into one place so you can see not just what a player or team did, but why — and what to expect going forward. Instead of scrolling between many sources, you can access many important data points all in one place. You get pace, play-calling tendencies, red-zone usage, target share, route participation, and opponent strength all cross-referenced against each other, broken out by game state (leading, trailing, tied) and by rolling windows (season, last 6 games, last 4 games, last 2 games) so you can tell a real trend from one good week.
How to Use the Tool
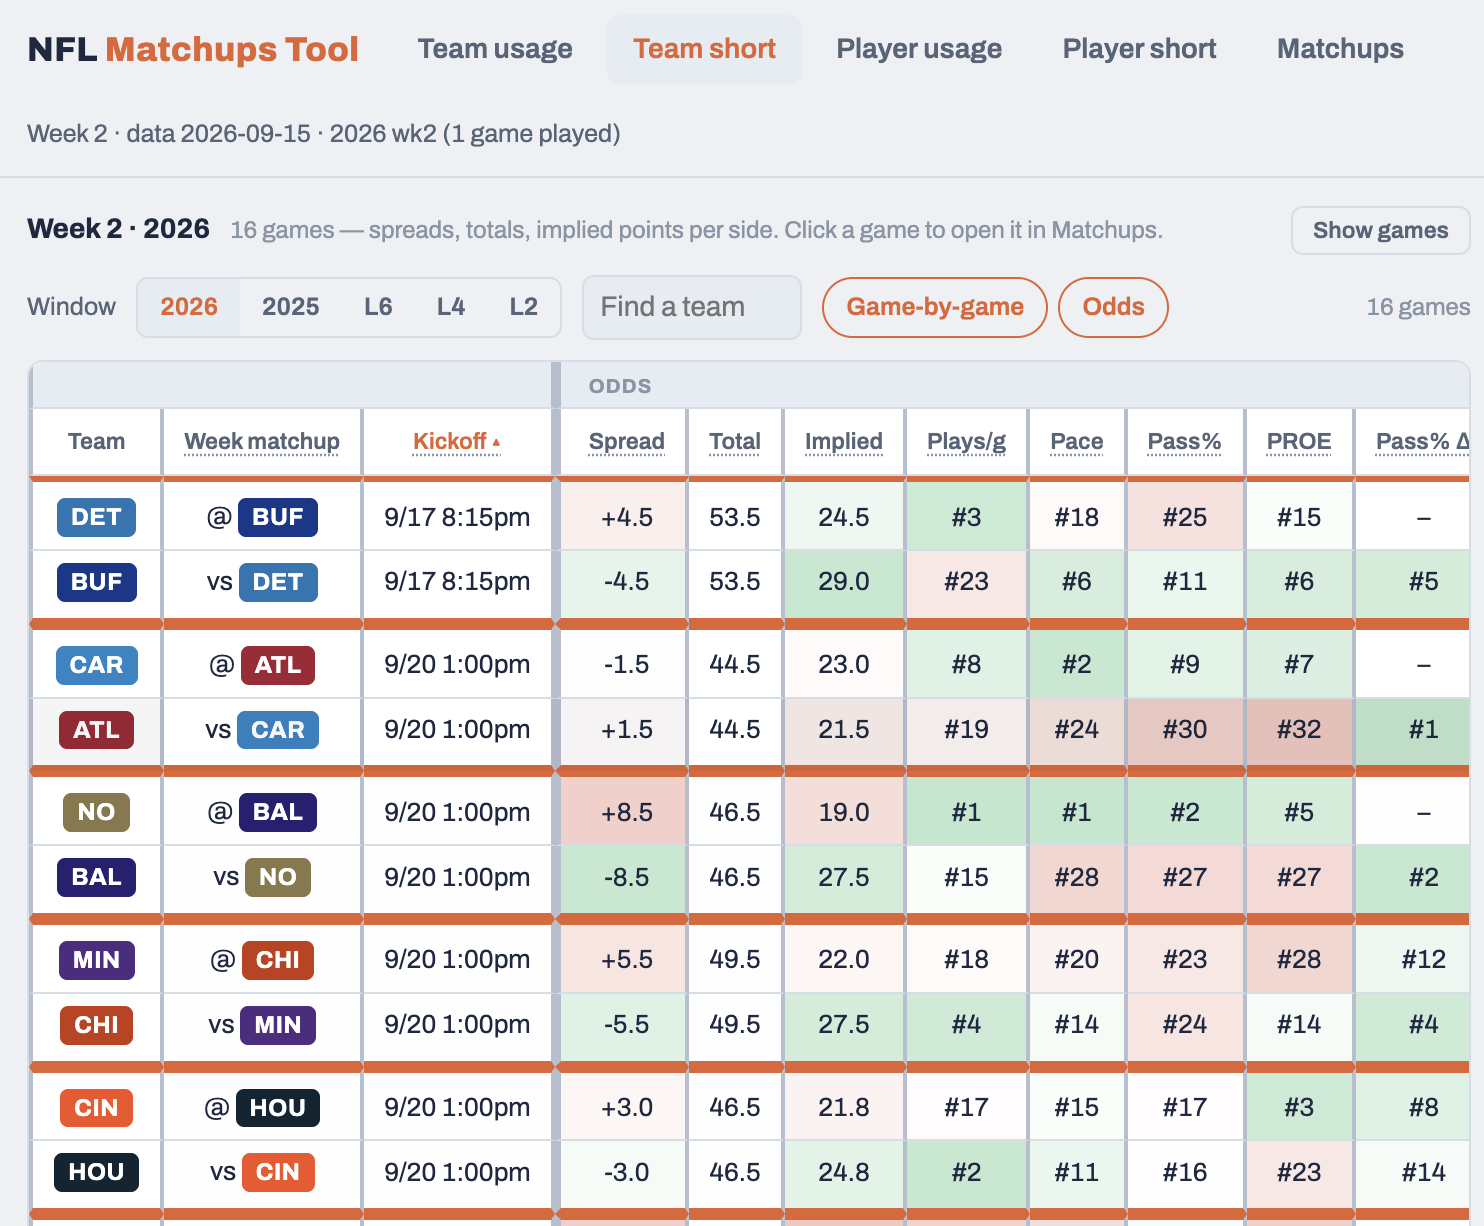
Team short — Use it to get a fast, scannable, league-wide view: every team ranked 1–32 across pace, pass rate, red zone, and more, so you can spot the fastest offenses and softest defenses at a glance.
Team usage — Use it to see the full numbers behind those ranks, split by game script (leading, trailing, tied), when you need actual figures instead of just a rank.
Player usage — Use it to dig into player-level detail: targets, carries, snap share, red-zone looks, efficiency, and workhorse/dominator role grades to separate real opportunity from a good box score. Find players who could experience performance changes not yet realized, or avoid unsustainable outliers who lack the signal to repeat strong performances.
Player short — Use it to get a condensed version of the same player data for a quicker read when you don’t need every column.
Matchups — Use it to line up one team’s offense against the opposing defense, position by position, with supporting metrics to help break down where production could possibly flow this week.
Why Data-Driven Analysis Matters for NFL DFS and Betting
Daily fantasy football and NFL betting both come down to the same underlying question: who is going to touch the ball, how often, and in what situations. Raw box scores only tell you what already happened — they don’t tell you whether a big game was a repeatable trend or a one-week outlier driven by matchup, game script, or plain luck. That distinction is where an edge actually lives. Bettors and DFS players who lean on deeper statistical context — usage rates, situational splits, efficiency metrics — are working from a fuller picture than anyone relying on last week’s fantasy points alone. Over a full season, that gap compounds into real, measurable value.
Player evaluation for fantasy football and prop betting starts with opportunity, not outcome. Target share, carry share, red-zone touches, and snap counts describe how big a player’s role actually is, independent of whether the ball bounced their way that week. A receiver running a full route tree on 90% of dropbacks is a fundamentally different bet than one who caught a long touchdown on 3 targets — even if their box scores look similar. Volume-based usage metrics are the foundation that turns a single good game into a projectable, repeatable expectation, which is exactly what a projection model or a DFS lineup needs to be built on.
On the team side, situational and pace-based data reshape how a game should be read before it’s even played. Pace of play, pass rate over expectation, red-zone efficiency, and defensive performance by opponent all shift depending on the score, the spread, and who’s on the other side of the ball. A defense that ranks poorly overall might be stout against the run and vulnerable through the air — or vice versa — and that split matters enormously for projecting which positions are set up to produce. Vegas lines themselves are a form of aggregated market data, and combining spread and total information with team-level tendencies gives a much sharper read on game environment than either signal does alone.
The real edge comes from putting usage, efficiency, and matchup context together rather than looking at any one in isolation. A player can have elite volume but face a brutal matchup, or the player can have modest volume in a matchup that’s about to open up. Layering role, opponent strength, and recent trend on top of raw production is how sharp DFS players and bettors separate signal from noise — spotting the players whose underlying usage says “buy” (even when last week’s box score said otherwise) and fading the ones riding an unsustainable hot streak.
Here is an example of the charts that Premium subscribers have access to
Want to see more? Sign up for NFL Premium!
-
-
This content can help you make better NFL DFS picks
- To access this content, subscribe to NFL Premium or purchase a 3-day trial.
- An NFL subscription will allow you to access this content and much more!
About the Author
While finishing up his college degree, Kyle Murray (aka kmurray03) became a full-time DFS player in 2018 after he won the first FanDuel FantaSea Live Final event for a $250,000 score. He has appeared in 6 Live Finals, qualifying for 10 total seats in that time, and has accumulated multiple 6-figure scores across several sports. In recent years, he has also added a focus towards prop betting, where he has turned a profit in multiple sports, such as NBA, MLB, and PGA. You can find all of Kyle’s sports betting analysis on our sister site, ScoresAndOdds. Follow Kyle on X – @KMurrDFS