NFL DFS Optimal Stacks Tool: FanDuel - Sunday Slate

This DFS content is a part of our Premium Content Schedule and designed to help you build better lineups on DraftKings, FanDuel, Yahoo!, SuperDraft, and other daily fantasy contest providers. Access NFL Projections, Expert Rankings, Projected Ownership, NFL DFS Picks, and other Data Tools using this content hub. For our world-class optimizer that offers a suite of tools and information designed to help you crush the competition, please head to LineupHQ!

Access DraftKings Stack Tool Here

About This Tool

The FanDuel NFL DFS Optimal Stacks tool helps you visualize the expected success rate of team stack with the expected probability.

Using player correlations is a proven method to increase your chances of success in NFL DFS tournaments, and that means pairing a quarterback with at least one other member of his team on the vast majority of your rosters. This chart is intended to help you make decisions on which quarterback stacks to consider, and the exposure to those quarterbacks across your lineups.

The optimal percentage is derived from a simulation of thousands of games on a play by play basis. This creates a realistic range of outcomes and set of data from which we can run analysis. From there, we find the top lineups from each simulated slate using the engine from LineupHQ. We tabulate the stats from those lineups, and deliver to you the frequency in which each stack appeared relative to the sample.

You can apply your analysis from this table to your builds in LineupHQ, and formulate a winning strategy for the upcoming week. This table will be updated each time we run a simulation update, and the time stamp for our latest projection update is also available in LineupHQ.

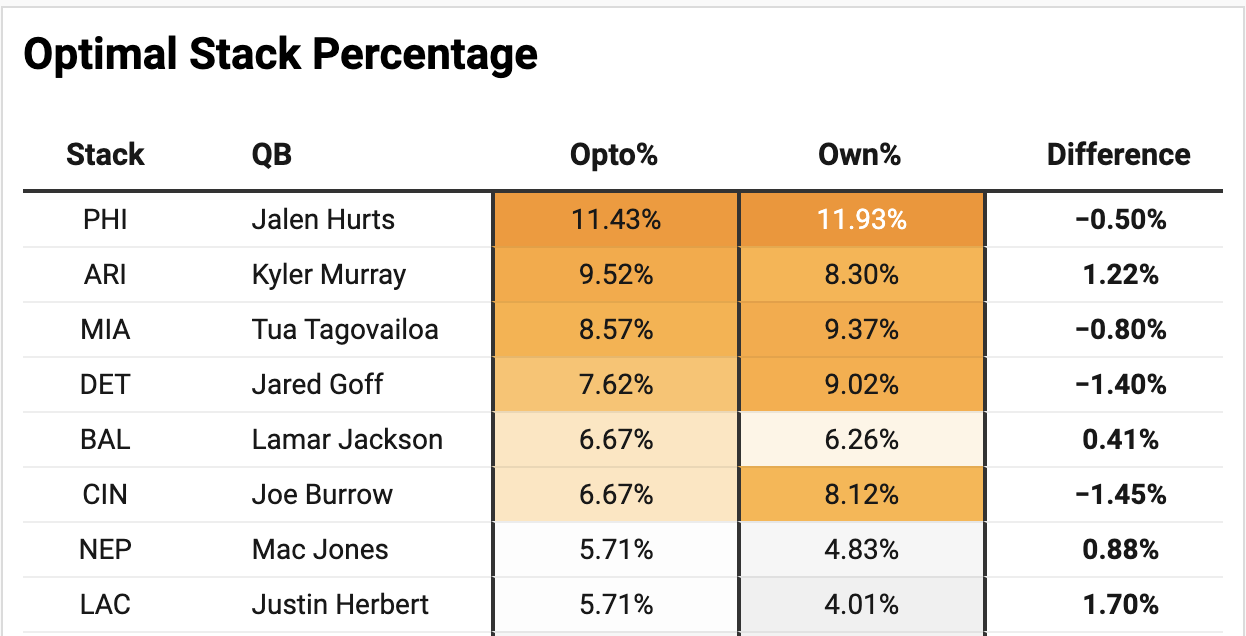
The NFL DFS Optimal Stacks tool helps you visualize the expected success rate of team stack with the expected probability. Using player correlations is a proven method to increase your chances of success in NFL DFS tournaments, and that means pairing a quarterback with at least one other member of his team on the vast majority of your rosters. This chart is intended to help you make decisions on which quarterback stacks to consider, and the exposure to those quarterbacks across your lineups.

The optimal percentage is derived from a simulation of thousands of games on a play by play basis. This creates a realistic range of outcomes and set of data from which we can run analysis. From there, we find the top lineups from each simulated slate using the engine from LineupHQ. We tabulate the stats from those lineups, and deliver to you the frequency in which each stack appeared relative to the sample.

You can apply your analysis from this table to your builds in LineupHQ, and formulate a winning strategy for the upcoming week. This table will be updated each time we run an simulation update, and the time stamp for our latest projection update is also available in LineupHQ.

Here is Sample of What This Chart Looks Like For Our Premium Subscribers

Want to read more? Sign up for Premium!

About the Author

  • Chris Gimino (ChrisGimino)

  • Chris Gimino is a top mind in the DFS industry and one of the primary contributors at RotoGrinders including one of the most accurate ownership projection systems in the industry. A multiple time live-finalist, Chris delivers actionable tools and advice for RotoGrinders Premium subscribers that helps them make informed decisions for their lineup builds.

New to DFS?

Be sure to click through our links and use our exclusive promo codes to receive the industry's best sign-up bonuses.