PGA First Look: Valero Texas Open

The PGA First Look is complete with sortable odds, salaries, Official World Golf Rankings, course history, and tee times.
Click here to follow Notorious on Twitter.
Course Preview
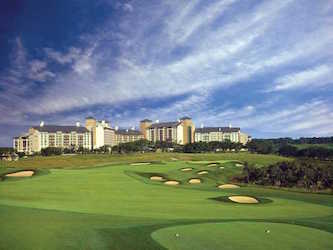
In what is becoming a trend at Harbour Town, Brendan Grace completed his come from behind win over Luke Donald. He came out firing on Sunday and managed to hold his lead on the tough back nine. After a week in South Carolina, the PGA Tour heads back to Texas for the Valero Texas Open. Since 2010, this event has been held at the Oaks Course at the TPC San Antonio. The course is a Par 72 that measures 7,522 yards. It is a very long track, but most of that length comes from the par fives and par threes. There are actually a number of short par fours on this course. The par fives will not be reachable in two by many, as three of the four measure at least 590 yards.
Given the length of the course, there will be a lot of approach shots in the 175-225 yard range. Being accurate with these long irons will be critical this week, especially for the shorter hitters. Driving accuracy isn’t all that important here, although you do want to stay out of the “native areas.” You have probably seen this video in every other golf article this week, but I had to include it in mine as well. A few years ago, Kevin Na scored a 16 on a par four at this event.
In terms of the type of golfer that we are looking for, think opposite of last week. There were only a few holes at Harbour Town where players were required to hit driver off the tee. Here at the TPC San Antonio, the driver may be the most important club in the bag. To tackle this lengthy course, you are going to need distance off the tee. To give you an idea of how little driving accuracy matters here, Jimmy Walker won last season while hitting only 53% of the fairways. Plus, if the weather goes as planned, it will give the bombers an even bigger advantage because the shorter hitters aren’t going to get as much roll on their drives.
There has been a lot of buzz around the industry about course history and it’s relevance in DFS. Some argue that it has no predictive value, while others argue that it does. My camp is somewhere in between. I don’t love the idea of relying on results from years in the past (because form is so streaky), but certain golfers tend to play well on different types of grass, different course lengths, and some just feel more confident at certain events. All of this is captured by course history. At the end of the day, it is one of many tools that we can use in DFS. It should not be the sole decision maker in your weekly process, but I’m certainly not going to go out of my way to avoid targeting golfers with good course history.
Fantasy Notes
Cut Rule: Top 70 and ties will move on after the first two rounds have concluded.
Recent Winners of this Event: Jimmy Walker (2015), Steven Bowditch (2014), Martin Laird (2013), Ben Curtis (2012), Brendan Steele (2011)
Weather: If you remember back to last season, weather played a critical role in this event. There was nearly a four stroke difference between the morning and afternoon waves of golfers due to wind. Weather could impact scoring again this week, although not nearly as bad as last year. Winds are projected to be around 6-12 MPH throughout the tournament and scattered thunderstorms could help soften the course.
Tee Times & Pairings: TBD
Salaries, Odds, and Course History (2011-2015)
| Golfer | Salary | S-Rank | Odds | O-Rank | + / – | OWGR | Cuts | 2015 | 2014 | 2013 | 2012 | 2011 |
|---|---|---|---|---|---|---|---|---|---|---|---|---|
| Jimmy Walker | $11,200 | 1 | 14 | 1 | 0 | 26 | 4/6 | 1 | 16 | 31 | 143 | 79 |
| Branden Grace | $10,900 | 2 | 18 | 2 | 0 | 11 | 2/2 | 30 | 79 | 500 | 500 | 500 |
| Matt Kuchar | $10,700 | 4 | 19 | 4 | 0 | 27 | 4/4 | 15 | 4 | 22 | 13 | 500 |
| Brooks Koepka | $10,400 | 6 | 22 | 6 | 0 | 18 | 1/1 | 500 | 36 | 500 | 500 | 500 |
| Phil Mickelson | $9,900 | 9 | 24 | 9 | 0 | 19 | 1/1 | 30 | 500 | 500 | 500 | 500 |
| J.B. Holmes | $10,100 | 8 | 23 | 7 | 1 | 21 | 3/4 | 500 | 64 | 500 | 108 | 11 |
| Zach Johnson | $10,800 | 3 | 19 | 3 | 0 | 17 | 2/3 | 20 | 6 | 500 | 500 | 500 |
| Patrick Reed | $10,600 | 5 | 20 | 5 | 0 | 13 | 1/2 | 500 | 500 | 113 | 35 | 500 |
| Brandt Snedeker | $10,300 | 7 | 24 | 8 | -1 | 16 | 1/1 | 500 | 500 | 500 | 500 | 4 |
| Bryson DeChambeau | $9,800 | 10 | 27 | 11 | -1 | 205 | 0/0 | 500 | 500 | 500 | 500 | 500 |
| Charley Hoffman | $9,600 | 11 | 26 | 10 | 1 | 57 | 6/6 | 11 | 11 | 3 | 13 | 2 |
| Billy Horschel | $9,400 | 13 | 30 | 12 | 1 | 47 | 4/5 | 3 | 113 | 3 | 75 | 74 |
| Ryan Palmer | $8,500 | 19 | 50 | 18 | 1 | 79 | 5/6 | 6 | 56 | 15 | 32 | 104 |
| Jason Kokrak | $9,300 | 14 | 38 | 13 | 1 | 90 | 3/4 | 11 | 31 | 15 | 82 | 500 |
| Kevin Chappell | $9,100 | 16 | 39 | 15 | 1 | 69 | 3/4 | 66 | 127 | 15 | 500 | 2 |
| Brendan Steele | $8,800 | 18 | 55 | 19 | -1 | 85 | 4/5 | 8 | 105 | 46 | 4 | 1 |
| Luke Donald | $9,500 | 12 | 39 | 14 | -2 | 68 | 0/0 | 500 | 500 | 500 | 500 | 500 |
| William McGirt | $8,200 | 21 | 56 | 21 | 0 | 104 | 4/5 | 40 | 31 | 37 | 91 | 36 |
| Chris Kirk | $9,000 | 17 | 49 | 17 | 0 | 54 | 2/2 | 8 | 500 | 500 | 500 | 48 |
| Russell Henley | $9,200 | 15 | 40 | 16 | -1 | 77 | 0/0 | 500 | 500 | 500 | 500 | 500 |
| Chez Reavie | $7,700 | 26 | 63 | 22 | 4 | 87 | 1/4 | 84 | 500 | 82 | 500 | 79 |
| Daniel Summerhays | $8,300 | 20 | 55 | 20 | 0 | 117 | 4/5 | 4 | 2 | 7 | 29 | 133 |
| Si Woo Kim | $7,600 | 27 | 75 | 26 | 1 | 141 | 0/0 | 500 | 500 | 500 | 500 | 500 |
| Keegan Bradley | $7,900 | 24 | 70 | 25 | -1 | 105 | 1/1 | 500 | 500 | 500 | 500 | 9 |
| Luke List | $6,900 | 40 | 103 | 36 | 4 | 289 | 1/1 | 500 | 500 | 46 | 500 | 500 |
| Aaron Baddeley | $7,400 | 30 | 78 | 27 | 3 | 241 | 4/4 | 20 | 67 | 15 | 500 | 500 |
| Kevin Streelman | $8,000 | 23 | 66 | 24 | -1 | 111 | 2/2 | 500 | 500 | 500 | 13 | 15 |
| Freddie Jacobson | $8,100 | 22 | 64 | 23 | -1 | 100 | 6/6 | 50 | 16 | 15 | 18 | 5 |
| Francesco Molinari | $7,400 | 30 | 80 | 28 | 2 | 83 | 0/0 | 500 | 500 | 500 | 500 | 500 |
| Patrick Rodgers | $7,300 | 32 | 89 | 31 | 1 | 130 | 0/0 | 500 | 500 | 500 | 500 | 500 |
| Kyle Reifers | $7,500 | 28 | 87 | 30 | -2 | 154 | 2/2 | 11 | 500 | 500 | 50 | 500 |
| Andrew Loupe | $6,500 | 53 | 138 | 52 | 1 | 182 | 1/2 | 84 | 4 | 500 | 500 | 500 |
| Jhonattan Vegas | $7,100 | 36 | 104 | 38 | -2 | 278 | 2/3 | 68 | 113 | 500 | 500 | 44 |
| John Huh | $7,300 | 32 | 98 | 34 | -2 | 188 | 3/4 | 35 | 81 | 72 | 2 | 500 |
| Colt Knost | $7,200 | 34 | 92 | 33 | 1 | 179 | 1/3 | 500 | 500 | 106 | 102 | 78 |
| Chad Campbell | $6,700 | 46 | 130 | 47 | -1 | 191 | 4/5 | 40 | 500 | 82 | 50 | 59 |
| Bryce Molder | $7,500 | 28 | 83 | 29 | -1 | 160 | 3/3 | 20 | 500 | 22 | 500 | 36 |
| John Senden | $6,700 | 46 | 115 | 43 | 3 | 99 | 2/3 | 76 | 42 | 500 | 500 | 23 |
| Ernie Els | $6,900 | 40 | 107 | 40 | 0 | 202 | 1/2 | 500 | 81 | 500 | 500 | 500 |
| Matt Jones | $6,600 | 49 | 133 | 49 | 0 | 70 | 3/4 | 26 | 500 | 500 | 32 | 128 |
| K.J. Choi | $7,800 | 25 | 92 | 32 | -7 | 101 | 2/4 | 15 | 105 | 6 | 91 | 500 |
| Brian Harman | $6,900 | 40 | 114 | 42 | -2 | 116 | 3/4 | 110 | 16 | 22 | 18 | 500 |
| Jerry Kelly | $7,000 | 38 | 103 | 37 | 1 | 161 | 2/4 | 76 | 6 | 95 | 18 | 500 |
| Kyle Stanley | $6,500 | 53 | 143 | 54 | -1 | 269 | 1/3 | 500 | 95 | 78 | 500 | 119 |
| Cameron Tringale | $7,000 | 38 | 112 | 41 | -3 | 95 | 5/6 | 40 | 46 | 82 | 8 | 5 |
| Johnson Wagner | $6,800 | 43 | 120 | 44 | -1 | 192 | 3/6 | 126 | 26 | 74 | 119 | 15 |
| Retief Goosen | $6,600 | 49 | 124 | 45 | 4 | 184 | 2/3 | 58 | 127 | 53 | 500 | 500 |
| Hunter Mahan | $7,100 | 36 | 104 | 39 | -3 | 109 | 0/0 | 500 | 500 | 500 | 500 | 500 |
| Thongchai Jaidee | $6,600 | 49 | 137 | 50 | -1 | 43 | 0/0 | 500 | 500 | 500 | 500 | 500 |
| Troy Merritt | $7,200 | 34 | 100 | 35 | -1 | 84 | 2/3 | 71 | 46 | 500 | 500 | 500 |
| Seung-yul Noh | $6,400 | 58 | 153 | 60 | -2 | 231 | 4/4 | 50 | 16 | 46 | 13 | 500 |
| Michael Thompson | $6,500 | 53 | 145 | 56 | -3 | 360 | 2/3 | 44 | 16 | 500 | 500 | 124 |
| George McNeill | $6,700 | 46 | 126 | 46 | 0 | 164 | 1/1 | 20 | 500 | 500 | 500 | 500 |
| Roberto Castro | $6,200 | 67 | 168 | 65 | 2 | 283 | 0/2 | 500 | 500 | 141 | 108 | 500 |
| Hudson Swafford | $6,200 | 67 | 200 | 75 | -8 | 236 | 1/2 | 35 | 134 | 500 | 500 | 500 |
| Cameron Percy | $6,400 | 58 | 148 | 57 | 1 | 417 | 3/3 | 15 | 500 | 37 | 500 | 500 |
| Scott Pinckney | $6,600 | 49 | 137 | 51 | -2 | 235 | 1/1 | 8 | 500 | 500 | 500 | 500 |
| Camilo Villegas | $6,300 | 62 | 166 | 63 | -1 | 216 | 1/2 | 99 | 77 | 500 | 500 | 500 |
| Padraig Harrington | $6,500 | 53 | 144 | 55 | -2 | 134 | 1/2 | 500 | 95 | 10 | 500 | 500 |
| Chris Stroud | $6,800 | 43 | 142 | 53 | -10 | 170 | 1/5 | 115 | 500 | 82 | 24 | 92 |
| David Hearn | $6,300 | 62 | 157 | 61 | 1 | 152 | 1/3 | 121 | 500 | 500 | 11 | 92 |
| Spencer Levin | $6,500 | 53 | 152 | 59 | -6 | 263 | 2/4 | 126 | 500 | 500 | 35 | 92 |
| Will MacKenzie | $6,800 | 43 | 132 | 48 | -5 | 351 | 3/3 | 74 | 2 | 500 | 41 | 500 |
| Chesson Hadley | $6,400 | 58 | 151 | 58 | 0 | 266 | 2/2 | 4 | 56 | 500 | 500 | 500 |
| Shawn Stefani | $6,100 | 74 | 196 | 73 | 1 | 239 | 1/2 | 26 | 500 | 141 | 500 | 500 |
| Greg Owen | $6,100 | 74 | 230 | 87 | -13 | 169 | 1/1 | 500 | 500 | 500 | 500 | 500 |
| Nick Taylor | $5,900 | 91 | 200 | 75 | 16 | 288 | 0/0 | 500 | 500 | 500 | 500 | 500 |
| Ricky Barnes | $6,300 | 62 | 161 | 62 | 0 | 262 | 2/4 | 84 | 500 | 129 | 50 | 36 |
| Derek Fathauer | $6,400 | 58 | 180 | 68 | -10 | 226 | 1/1 | 64 | 500 | 500 | 500 | 500 |
| Bronson Burgoon | $6,100 | 74 | 195 | 72 | 2 | 272 | 0/0 | 500 | 500 | 500 | 500 | 500 |
| Mark Hubbard | $6,200 | 67 | 193 | 69 | -2 | 387 | 0/1 | 99 | 500 | 500 | 500 | 500 |
| Geoff Ogilvy | $6,200 | 67 | 194 | 71 | -4 | 197 | 2/3 | 132 | 11 | 500 | 500 | 23 |
| Brett Stegmaier | $5,900 | 91 | 232 | 88 | 3 | 247 | 0/0 | 500 | 500 | 500 | 500 | 500 |
| Jason Gore | $6,000 | 83 | 218 | 81 | 2 | 177 | 1/2 | 500 | 500 | 500 | 82 | 500 |
| Luke Guthrie | $6,200 | 67 | 193 | 69 | -2 | 353 | 2/2 | 50 | 64 | 500 | 500 | 500 |
| Brendon de Jonge | $6,200 | 67 | 218 | 81 | -14 | 204 | 4/5 | 123 | 36 | 22 | 77 | 23 |
| Tyler Aldridge | $6,300 | 62 | 168 | 66 | -4 | 280 | 0/0 | 500 | 500 | 500 | 500 | 500 |
| Carlos Ortiz | $6,000 | 83 | 241 | 90 | -7 | 325 | 1/1 | 15 | 500 | 500 | 500 | 500 |
| Jeff Overton | $6,000 | 83 | 223 | 83 | 0 | 352 | 2/3 | 50 | 127 | 7 | 500 | 500 |
| Sung Kang | $5,900 | 91 | 213 | 79 | 12 | 178 | 0/0 | 500 | 500 | 500 | 500 | 500 |
| Tyrone Van Aswegen | $6,100 | 74 | 216 | 80 | -6 | 297 | 1/1 | 500 | 77 | 500 | 500 | 500 |
| Whee Kim | $6,100 | 74 | 179 | 67 | 7 | 307 | 0/0 | 500 | 500 | 500 | 500 | 500 |
| Justin Leonard | $6,300 | 62 | 166 | 63 | -1 | 437 | 5/6 | 76 | 31 | 37 | 35 | 30 |
| Rory Sabbatini | $6,100 | 74 | 232 | 88 | -14 | 220 | 0/0 | 500 | 500 | 500 | 500 | 500 |
| Brendon Todd | $5,900 | 91 | 227 | 85 | 6 | 146 | 3/3 | 30 | 6 | 61 | 500 | 500 |
| Andres Romero | $6,100 | 74 | 205 | 77 | -3 | 316 | 3/3 | 66 | 46 | 61 | 500 | 500 |
| Zac Blair | $6,200 | 67 | 198 | 74 | -7 | 148 | 0/0 | 500 | 500 | 500 | 500 | 500 |
| James Hahn | $5,800 | 99 | 254 | 96 | 3 | 127 | 1/3 | 76 | 16 | 95 | 500 | 500 |
| John Merrick | $5,900 | 91 | 250 | 93 | -2 | 515 | 4/4 | 15 | 79 | 53 | 500 | 44 |
| Ben Crane | $6,100 | 74 | 211 | 78 | -4 | 384 | 0/1 | 500 | 95 | 500 | 500 | 500 |
| Harold Varner III | $5,800 | 99 | 307 | 110 | -11 | 271 | 0/0 | 500 | 500 | 500 | 500 | 500 |
| Dawie Van Der Walt | $6,000 | 83 | 268 | 100 | -17 | 250 | 0/0 | 500 | 500 | 500 | 500 | 500 |
| Robert Garrigus | $5,700 | 108 | 277 | 101 | 7 | 518 | 1/2 | 58 | 500 | 500 | 500 | 500 |
| Thomas Aiken | $6,100 | 74 | 229 | 86 | -12 | 208 | 0/0 | 500 | 500 | 500 | 500 | 500 |
| Brice Garnett | $6,000 | 83 | 241 | 90 | -7 | 425 | 2/2 | 30 | 31 | 500 | 500 | 500 |
| Tom Hoge | $5,800 | 99 | 289 | 105 | -6 | 291 | 0/1 | 76 | 500 | 500 | 500 | 500 |
| Hiroshi Iwata | $5,800 | 99 | 245 | 92 | 7 | 123 | 0/0 | 500 | 500 | 500 | 500 | 500 |
| Alex Prugh | $5,700 | 108 | 396 | 122 | -14 | 503 | 1/3 | 119 | 72 | 500 | 500 | 104 |
| Steve Marino | $5,900 | 91 | 225 | 84 | 7 | 242 | 0/1 | 500 | 500 | 129 | 500 | 500 |
| Jon Curran | $5,800 | 99 | 252 | 94 | 5 | 233 | 1/1 | 44 | 500 | 500 | 500 | 500 |
| Matt Every | $6,000 | 83 | 252 | 94 | -11 | 176 | 4/4 | 35 | 500 | 79 | 2 | 30 |
| Carl Pettersson | $5,700 | 108 | 286 | 103 | 5 | 246 | 2/3 | 76 | 16 | 500 | 500 | 500 |
| Henrik Norlander | $6,000 | 83 | 264 | 99 | -16 | 363 | 1/1 | 500 | 500 | 53 | 500 | 500 |
| Peter Malnati | $5,800 | 99 | 304 | 108 | -9 | 171 | 0/1 | 500 | 119 | 500 | 500 | 500 |
| Scott Langley | $6,000 | 83 | 261 | 98 | -15 | 411 | 3/4 | 58 | 134 | 71 | 50 | 500 |
| Tim Wilkinson | $5,600 | 117 | 279 | 102 | 15 | 808 | 2/3 | 99 | 62 | 500 | 500 | 500 |
| Scott Stallings | $5,700 | 108 | 307 | 110 | -2 | 306 | 2/3 | 99 | 500 | 53 | 500 | 11 |
| Michael Putnam | $5,400 | 132 | 407 | 127 | 5 | 511 | 2/4 | 75 | 42 | 500 | 135 | 104 |
| Michael Kim | $5,700 | 108 | 259 | 97 | 11 | 364 | 0/0 | 500 | 500 | 500 | 500 | 500 |
| Kelly Kraft | $5,700 | 108 | 309 | 112 | -4 | 383 | 0/1 | 500 | 500 | 500 | 91 | 500 |
| Stuart Appleby | $5,900 | 91 | 288 | 104 | -13 | 408 | 2/3 | 500 | 72 | 46 | 108 | 500 |
| Rod Pampling | $5,600 | 117 | 300 | 107 | 10 | 264 | 0/1 | 500 | 500 | 82 | 500 | 500 |
| Andrew Landry | $5,900 | 91 | 296 | 106 | -15 | 535 | 0/0 | 500 | 500 | 500 | 500 | 500 |
| Wes Roach | $5,800 | 99 | 325 | 114 | -15 | 433 | 1/1 | 500 | 16 | 500 | 500 | 500 |
| Justin Hicks | $5,600 | 117 | 304 | 108 | 9 | 703 | 2/4 | 110 | 15 | 106 | 500 | 69 |
| J.J. Henry | $5,700 | 108 | 385 | 121 | -13 | 249 | 2/6 | 84 | 105 | 95 | 41 | 69 |
| Martin Piller | $5,700 | 108 | 355 | 118 | -10 | 244 | 1/1 | 500 | 500 | 500 | 500 | 23 |
| Mark Wilson | $5,600 | 117 | 318 | 113 | 4 | 429 | 0/3 | 119 | 81 | 500 | 500 | 500 |
| Rhein Gibson | $5,600 | 117 | 343 | 116 | 1 | 323 | 0/0 | 500 | 500 | 500 | 500 | 500 |
| Brian Davis | $5,600 | 117 | 343 | 116 | 1 | 501 | 3/3 | 50 | 46 | 29 | 500 | 500 |
| D.J. Trahan | $5,700 | 108 | 335 | 115 | -7 | 829 | 1/1 | 500 | 500 | 15 | 500 | 500 |
| Billy Hurley III | $5,400 | 132 | 418 | 128 | 4 | 490 | 2/3 | 35 | 113 | 500 | 32 | 500 |
| Rob Oppenheim | $5,500 | 124 | 400 | 124 | 0 | 413 | 0/0 | 500 | 500 | 500 | 500 | 500 |
| Brian Stuard | $5,500 | 124 | 404 | 125 | -1 | 498 | 1/2 | 64 | 500 | 500 | 500 | 500 |
| Tim Herron | $5,800 | 99 | 357 | 119 | -20 | 537 | 2/4 | 500 | 500 | 82 | 24 | 113 |
| Derek Ernst | $5,500 | 124 | 454 | 130 | -6 | 629 | 0/2 | 135 | 500 | 144 | 500 | 500 |
| Chad Collins | $5,400 | 132 | 464 | 131 | 1 | 494 | 1/2 | 84 | 26 | 500 | 500 | 500 |
| Hunter Stewart | $5,600 | 117 | 368 | 120 | -3 | 1101 | 0/0 | 500 | 500 | 500 | 500 | 500 |
| D.A. Points | $5,800 | 99 | 404 | 125 | -26 | 687 | 1/2 | 115 | 500 | 53 | 500 | 500 |
| Frank Lickliter II | $5,500 | 124 | 396 | 122 | 2 | 3/3 | 500 | 500 | 500 | 13 | 69 | |
| Miguel Angel Carballo | $5,300 | 138 | 471 | 133 | 5 | 571 | 2/2 | 500 | 46 | 500 | 24 | 500 |
| Ryan Ruffels | $5,400 | 132 | 421 | 129 | 3 | 778 | 0/0 | 500 | 500 | 500 | 500 | 500 |
| Andres Gonzales | $5,300 | 138 | 539 | 145 | -7 | 480 | 0/3 | 99 | 500 | 113 | 500 | 79 |
| John Rollins | $5,400 | 132 | 468 | 132 | 0 | 1111 | 0/4 | 500 | 81 | 500 | 108 | 79 |
| Cameron Beckman | $5,300 | 138 | 471 | 133 | 5 | 1192 | 3/6 | 44 | 36 | 134 | 63 | 79 |
| Tom Gillis | $5,400 | 132 | 475 | 135 | -3 | 413 | 2/3 | 500 | 500 | 95 | 35 | 500 |
| Darron Stiles | $5,500 | 124 | 486 | 139 | -15 | 538 | 0/1 | 500 | 500 | 134 | 500 | 500 |
| Ben Curtis | $5,200 | 144 | 475 | 135 | 9 | 3/4 | 99 | 46 | 31 | 1 | 500 | |
| D.H. Lee | $5,200 | 144 | 512 | 144 | 0 | 362 | 0/2 | 500 | 81 | 106 | 500 | 500 |
| Abraham Ancer | $5,500 | 124 | 511 | 143 | -19 | 469 | 0/0 | 500 | 500 | 500 | 500 | 500 |
| Brian Gay | $5,200 | 144 | 482 | 138 | 6 | 4/4 | 500 | 56 | 61 | 4 | 23 | |
| Richard H. Lee | $5,300 | 138 | 477 | 137 | 1 | 0/0 | 500 | 500 | 500 | 500 | 500 | |
| Dicky Pride | $5,300 | 138 | 582 | 147 | -9 | 393 | 0/3 | 500 | 500 | 113 | 108 | 500 |
| Michael Bradley | $5,500 | 124 | 489 | 140 | -16 | 1071 | 1/1 | 500 | 500 | 500 | 500 | 500 |
| Robert Allenby | $5,200 | 144 | 786 | 149 | -5 | 748 | 0/3 | 76 | 81 | 95 | 500 | 500 |
| Lucas Lee | $5,200 | 144 | 507 | 142 | 2 | 444 | 0/0 | 500 | 500 | 500 | 500 | 500 |
| Billy Mayfair | $5,500 | 124 | 504 | 141 | -17 | 3/4 | 500 | 500 | 113 | 56 | 48 | |
| Marc Turnesa | $5,300 | 138 | 579 | 146 | -8 | 0/2 | 500 | 500 | 500 | 122 | 119 | |
| Omar Uresti | $5,200 | 144 | 750 | 148 | -4 | 1/3 | 500 | 500 | 500 | 108 | 113 |
Color Coding
Course history in BLUE indicates a top ten finish.
Course history in GREEN indicates a top 25 finish.
Course history in YELLOW indicates a made cut with a finish outside of the top 25.
Course history in RED indicates a missed cut.
Legend
| Term | Description |
|---|---|
| S-Rank | Each golfer’s salary rank compared to the field, with one being the most expensive. |
| O-Rank | Each golfer’s odds rank compared to the field, with one the biggest favorite. |
| + / – | The difference between a golfer’s salary and odds rank. The bigger the number, the better. |
| OWGR | Official World Golf Ranking |
| Cuts | Cut record of each golfer at this event in the last ten seasons. |
| 2011 – 2015 Columns | Course history at this event over the last five seasons. |