PGA First Look: Valspar Championship

The PGA First Look is complete with a course preview, odds, salaries, Official World Golf Rankings, and course history.
Click here to follow Notorious on Twitter.
Event Preview
After a brief stint in Mexico, the PGA Tour heads back to Florida for the Valspar Championship. Before we get into the course specifics, let’s quickly recap the WGC-Mexico. Dustin Johnson dominated the front nine on Sunday and eventually built a four-shot lead. It was quickly erased after Jon Rahm made a move on the back nine and Rahm even held the lead after he birdied the par five 15th. Rahm ended up bogeying his next two holes, which opened the door for Johnson, who quickly birdied the same par five and regained the lead. Tommy Fleetwood shot four-under on the back nine and made a huge putt on the 18th to cut the lead to one stroke. Johnson put his drive in the fairway bunker, but hit a tremendous off-balance shot on the green and calmly two-putted for another win on the PGA Tour. If he continues this run of golf, he could be the number one ranked in the world for quite a while.
This event has had a few different names throughout the years, but has been the Valspar Championship for each of the last three. While the name has changed, the course has been a mainstay for this event since 2000. The Copperhead Course at Innisbrook Resort is a Par 71 that measures 7,340 yards. It is not your typical Par 71, as it features four par fives and five par threes. This is a course that plays a lot longer than 7,340 yards, as there are very few opportunities to hit driver off the tee. When you take the driver out of play, it lengthens the course drastically. Not only that, but four of the five par threes measure over 200 yards and all four of the par fives measure at least 550 yards.
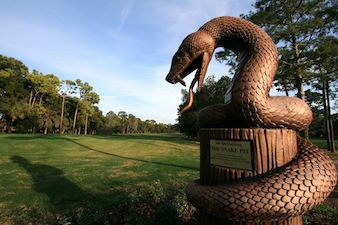
This course features tree-lined fairways and tough to hit greens. Most people would think to target driving accuracy, but the bombers are going to hit their drivers sparingly, so it’s tough to trust that statistic. Rather than focusing on off the tee stats, I want golfers with good approach games, especially with their long irons. There are a number of doglegs on this course and it is anything but a bomber’s course. With the description of the course, it makes sense that it is routinely ranked in the top five in terms of difficulty on tour. Copperhead is home to the famous “Snake Pit” that is one of the toughest three hole stretches in golf. If your golfer heads to 16, 17, and 18 needing three pars to make the cut, the odds are stacked against him. All three holes play well over par each year.
In terms of the type of golfer I’m looking for, I want a strong approach game and will be putting an emphasis on Par 3 scoring. I will also be heavily factoring in course history, as the same golfers seem to play well here year in and year out.
Cut Rule: Top 70 and ties move on after the first two rounds.
Recent Winners of this Event: Charl Schwartzel (2016), Jordan Spieth (2015), John Senden (2014), Kevin Streelman (2013), Luke Donald (2012)
Key Statistics (In Order of Importance)
1) Strokes Gained Tee to Green
2) Birdie or Better %
3) Strokes Gained Approach
4) Bogey Avoidance
5) Par 3 Scoring
Salaries, Odds, and Course History (2012-2016)
| Golfer | Salary | OWGR | Odds to Win | Odds +/- | SGT2G | SGPut | Cuts | 2016 | 2015 | 2014 | 2013 | 2012 |
|---|---|---|---|---|---|---|---|---|---|---|---|---|
| Justin Thomas | $11,900 | 7 | 10 | 0% | 1.69 | 0.52 | 2/2 | 18 | 10 | 500 | 500 | 500 |
| Henrik Stenson | $11,700 | 6 | 11 | 0% | 2/2 | 11 | 4 | 500 | 500 | 500 | ||
| Matt Kuchar | $10,200 | 20 | 26 | -33% | 0.61 | 0.35 | 5/5 | 11 | 33 | 38 | 14 | 10 |
| Daniel Berger | $10,100 | 36 | 27 | -75% | 0.22 | 0.61 | 1/2 | 11 | 72 | 500 | 500 | 500 |
| Patrick Reed | $9,700 | 12 | 27 | -60% | -0.25 | 0.56 | 2/3 | 7 | 2 | 500 | 130 | 500 |
| Charles Howell | $9,400 | 65 | 37 | -67% | 0.85 | 0.50 | 3/3 | 5 | 10 | 14 | 500 | 500 |
| Bill Haas | $9,200 | 44 | 26 | 43% | 1.20 | 0.37 | 2/2 | 2 | 500 | 14 | 500 | 500 |
| Ryan Moore | $9,000 | 37 | 26 | 63% | 0.23 | 0.43 | 2/4 | 3 | 5 | 500 | 142 | 124 |
| Gary Woodland | $8,900 | 34 | 27 | 33% | 1.24 | 0.33 | 3/5 | 42 | 103 | 8 | 78 | 29 |
| Charl Schwartzel | $8,800 | 28 | 36 | 10% | 1/2 | 1 | 500 | 500 | 500 | 133 | ||
| Kevin Na | $8,700 | 47 | 45 | -27% | 0.71 | 0.18 | 4/4 | 22 | 10 | 2 | 500 | 38 |
| Webb Simpson | $8,500 | 59 | 56 | -67% | 1.10 | -0.34 | 2/4 | 85 | 500 | 96 | 17 | 10 |
| Graham DeLaet | $8,400 | 132 | 40 | 15% | 0.39 | 0.74 | 3/4 | 5 | 500 | 8 | 17 | 115 |
| Bubba Watson | $8,300 | 16 | 43 | 14% | -0.32 | -0.52 | 0/0 | 500 | 500 | 500 | 500 | 500 |
| Sean O’Hair | $8,200 | 79 | 64 | -53% | 0.48 | 0.40 | 3/4 | 500 | 2 | 74 | 69 | 124 |
| Graeme McDowell | $8,100 | 87 | 60 | -31% | 0.06 | 0.17 | 0/1 | 71 | 500 | 500 | 500 | 500 |
| Patrick Rodgers | $8,000 | 129 | 72 | -76% | 0.21 | -0.58 | 0/1 | 94 | 500 | 500 | 500 | 500 |
| Jason Dufner | $7,900 | 70 | 44 | 28% | 0.44 | 0.22 | 5/5 | 22 | 24 | 14 | 21 | 10 |
| Billy Horschel | $7,900 | 72 | 48 | 6% | 0.93 | -0.12 | 1/1 | 500 | 500 | 500 | 56 | 500 |
| Russell Knox | $7,800 | 21 | 47 | 20% | -0.63 | -0.13 | 3/3 | 56 | 33 | 25 | 500 | 500 |
| Luke Donald | $7,800 | 88 | 49 | 10% | -0.09 | 0.78 | 5/5 | 22 | 53 | 4 | 4 | 1 |
| Russell Henley | $7,700 | 136 | 71 | -23% | 0.73 | 0.71 | 0/1 | 71 | 500 | 500 | 500 | 500 |
| Tony Finau | $7,700 | 77 | 77 | -50% | 1.08 | -0.36 | 0/2 | 71 | 133 | 500 | 500 | 500 |
| Stewart Cink | $7,600 | 221 | 96 | -71% | 1.11 | 0.27 | 3/5 | 134 | 60 | 96 | 14 | 70 |
| Jason Kokrak | $7,600 | 103 | 86 | -54% | -0.02 | -0.17 | 2/5 | 85 | 7 | 14 | 110 | 131 |
| Wesley Bryan | $7,500 | 78 | 46 | 42% | 0.53 | 0.22 | 0/0 | 500 | 500 | 500 | 500 | 500 |
| Harris English | $7,500 | 86 | 85 | -38% | 0.24 | 0.31 | 3/5 | 85 | 10 | 38 | 7 | 106 |
| Seung-Yul Noh | $7,500 | 235 | 98 | -65% | 0.06 | 0.24 | 1/3 | 42 | 500 | 500 | 120 | 115 |
| Martin Laird | $7,400 | 108 | 72 | 0% | 1.14 | 0.66 | 3/4 | 85 | 33 | 500 | 70 | 77 |
| Byeong-Hun An | $7,400 | 48 | 53 | 34% | 0.97 | -0.28 | 0/0 | 500 | 500 | 500 | 500 | 500 |
| Steve Stricker | $7,400 | 106 | 67 | 14% | 1/1 | 7 | 500 | 500 | 500 | 500 | ||
| Charley Hoffman | $7,400 | 68 | 71 | 10% | 0.59 | -0.42 | 4/5 | 11 | 141 | 25 | 75 | 14 |
| Kevin Streelman | $7,400 | 134 | 103 | -52% | 0.29 | -0.28 | 4/5 | 131 | 40 | 38 | 1 | 10 |
| Lee McCoy | $7,300 | 584 | 175 | -100% | 1/1 | 4 | 500 | 500 | 500 | 500 | ||
| Trey Mullinax | $7,300 | 316 | 193 | -118% | -0.18 | 0.34 | 0/0 | 500 | 500 | 500 | 500 | 500 |
| Seamus Power | $7,300 | 317 | 224 | -156% | -0.17 | 0.57 | 0/0 | 500 | 500 | 500 | 500 | 500 |
| K.J. Choi | $7,300 | 180 | 197 | -121% | 0.05 | -0.28 | 4/5 | 62 | 116 | 44 | 21 | 46 |
| Si Woo Kim | $7,300 | 63 | 207 | -135% | -2.63 | -0.31 | 0/1 | 134 | 500 | 500 | 500 | 500 |
| Jim Furyk | $7,200 | 50 | 62 | 44% | -0.10 | 0.47 | 4/4 | 500 | 40 | 20 | 7 | 2 |
| J.J. Spaun | $7,200 | 114 | 66 | 38% | 0.39 | 0.24 | 0/0 | 500 | 500 | 500 | 500 | 500 |
| Brian Harman | $7,200 | 102 | 89 | 3% | -0.09 | 0.89 | 2/5 | 71 | 95 | 25 | 14 | 85 |
| Daniel Summerhays | $7,200 | 82 | 133 | -44% | 0.07 | 0.13 | 4/4 | 22 | 10 | 70 | 63 | 500 |
| Billy Hurley | $7,200 | 125 | 217 | -113% | -0.21 | 0.42 | 1/3 | 116 | 17 | 119 | 500 | 500 |
| Grayson Murray | $7,200 | 154 | 172 | -69% | -0.19 | 0.22 | 0/0 | 500 | 500 | 500 | 500 | 500 |
| Morgan Hoffmann | $7,200 | 184 | 174 | -72% | -0.49 | -0.09 | 1/3 | 104 | 116 | 25 | 500 | 500 |
| Cody Gribble | $7,200 | 198 | 224 | -123% | -0.72 | 0.81 | 0/0 | 500 | 500 | 500 | 500 | 500 |
| Ollie Schniederjans | $7,100 | 128 | 76 | 32% | 0.61 | 0.16 | 0/1 | 500 | 95 | 500 | 500 | 500 |
| Nick Watney | $7,100 | 351 | 79 | 26% | 0.29 | 0.06 | 3/3 | 500 | 53 | 500 | 43 | 51 |
| Luke List | $7,100 | 188 | 138 | -23% | 1.20 | -0.08 | 0/2 | 104 | 500 | 500 | 120 | 500 |
| Shawn Stefani | $7,100 | 355 | 179 | -47% | 0.28 | -0.02 | 3/3 | 56 | 17 | 500 | 7 | 500 |
| Michael Kim | $7,100 | 255 | 218 | -81% | 0.14 | 0.78 | 0/1 | 138 | 500 | 500 | 500 | 500 |
| David Hearn | $7,100 | 195 | 268 | -130% | 0.04 | -0.57 | 2/5 | 71 | 53 | 8 | 120 | 93 |
| Derek Fathauer | $7,100 | 196 | 254 | -115% | -0.88 | 0.83 | 0/2 | 94 | 85 | 500 | 500 | 500 |
| George McNeill | $7,100 | 510 | 229 | -91% | 4/5 | 11 | 127 | 7 | 30 | 46 | ||
| Fredrik Jacobson | $7,100 | 216 | 250 | -113% | 2/3 | 124 | 47 | 20 | 500 | 500 | ||
| Smylie Kaufman | $7,100 | 149 | 282 | -138% | -0.72 | -0.57 | 0/0 | 500 | 500 | 500 | 500 | 500 |
| Chez Reavie | $7,000 | 127 | 123 | 14% | 0.53 | 0.45 | 3/4 | 22 | 127 | 500 | 63 | 20 |
| Kyle Stanley | $7,000 | 220 | 129 | 7% | 1.68 | -0.49 | 1/2 | 53 | 500 | 132 | 500 | 500 |
| Jamie Lovemark | $7,000 | 93 | 127 | 11% | 0.38 | 0.30 | 2/2 | 37 | 500 | 500 | 500 | 44 |
| Sung Kang | $7,000 | 183 | 146 | -11% | 0.56 | -0.32 | 2/2 | 22 | 500 | 500 | 500 | 55 |
| John Senden | $7,000 | 191 | 143 | -7% | 0.02 | -0.33 | 2/5 | 71 | 85 | 1 | 90 | 38 |
| JT Poston | $7,000 | 248 | 136 | 0% | 0.04 | -0.07 | 0/0 | 500 | 500 | 500 | 500 | 500 |
| Nick Taylor | $7,000 | 324 | 203 | -37% | -0.20 | -0.03 | 1/2 | 94 | 24 | 500 | 500 | 500 |
| Brian Stuard | $7,000 | 143 | 213 | -44% | 0.27 | -0.19 | 1/3 | 500 | 85 | 115 | 43 | 500 |
| Ryan Blaum | $7,000 | 358 | 242 | -65% | -0.12 | 0.36 | 0/0 | 500 | 500 | 500 | 500 | 500 |
| Ryo Ishikawa | $7,000 | 112 | 217 | -46% | 0.11 | -0.28 | 1/4 | 500 | 103 | 25 | 110 | 106 |
| Patrick Cantlay | $7,000 | 264 | -81% | 0/1 | 500 | 500 | 500 | 90 | 500 | |||
| Hunter Mahan | $7,000 | 541 | 350 | -121% | -1.63 | -0.02 | 1/1 | 53 | 500 | 500 | 500 | 500 |
| Lucas Glover | $6,900 | 161 | 79 | 51% | 1.44 | -0.14 | 2/5 | 104 | 24 | 96 | 38 | 106 |
| Chris Kirk | $6,900 | 80 | 71 | 59% | 0.12 | 0.73 | 1/1 | 42 | 500 | 500 | 500 | 500 |
| Keegan Bradley | $6,900 | 110 | 74 | 55% | 0.80 | -0.10 | 0/1 | 71 | 500 | 500 | 500 | 500 |
| Scott Piercy | $6,900 | 41 | 91 | 42% | 0.62 | -0.18 | 1/2 | 500 | 500 | 500 | 110 | 5 |
| Scott Brown | $6,900 | 115 | 90 | 43% | -0.49 | 0.63 | 2/5 | 7 | 72 | 85 | 27 | 115 |
| Scott Stallings | $6,900 | 267 | 108 | 35% | 0.09 | -0.39 | 0/5 | 71 | 122 | 119 | 147 | 106 |
| Michael Thompson | $6,900 | 223 | 189 | -6% | -0.66 | 1.17 | 2/4 | 500 | 72 | 58 | 110 | 16 |
| Jonas Blixt | $6,900 | 251 | 236 | -33% | -0.42 | 0.20 | 2/4 | 22 | 122 | 85 | 38 | 500 |
| Beau Hossler | $6,900 | 271 | -58% | 0/0 | 500 | 500 | 500 | 500 | 500 | |||
| Vijay Singh | $6,900 | 222 | 317 | -75% | -0.67 | -0.35 | 4/5 | 64 | 10 | 115 | 38 | 63 |
| Ken Duke | $6,900 | 330 | 294 | -67% | -0.42 | -0.33 | 4/5 | 56 | 63 | 82 | 110 | 5 |
| Andrew Loupe | $6,900 | 290 | 514 | -99% | -2.18 | -0.65 | 0/1 | 104 | 500 | 500 | 500 | 500 |
| Adam Hadwin | $6,800 | 98 | 98 | 48% | 0.20 | 0.81 | 1/2 | 94 | 71 | 500 | 500 | 500 |
| Robert Garrigus | $6,800 | 211 | 125 | 38% | 0.11 | -0.21 | 4/4 | 500 | 47 | 4 | 56 | 2 |
| David Lingmerth | $6,800 | 85 | 113 | 43% | 0.07 | -0.13 | 2/2 | 500 | 500 | 58 | 51 | 500 |
| Jim Herman | $6,800 | 89 | 139 | 27% | 0.69 | -0.11 | 0/2 | 104 | 500 | 500 | 130 | 500 |
| Soren Kjeldsen | $6,800 | 66 | 131 | 32% | -0.75 | 0.64 | 0/0 | 500 | 500 | 500 | 500 | 500 |
| Willy Wilcox | $6,800 | 289 | 232 | -12% | 0/0 | 500 | 500 | 500 | 500 | 500 | ||
| Ben Martin | $6,800 | 208 | 276 | -37% | -0.70 | -0.48 | 0/1 | 500 | 500 | 128 | 500 | 500 |
| Brian Gay | $6,800 | 511 | 314 | -47% | -0.64 | 0.64 | 2/4 | 139 | 500 | 77 | 120 | 55 |
| Ernie Els | $6,800 | 392 | 272 | -36% | -0.58 | -0.07 | 1/4 | 128 | 95 | 85 | 500 | 5 |
| Spencer Levin | $6,800 | 287 | 422 | -63% | -1.40 | -0.39 | 1/3 | 104 | 60 | 119 | 500 | 500 |
| Steve Marino | $6,800 | 417 | 436 | -65% | -0.92 | -0.79 | 0/0 | 500 | 500 | 500 | 500 | 500 |
| Carl Pettersson | $6,800 | 748 | 417 | -60% | -1.22 | 0.00 | 2/5 | 128 | 53 | 20 | 78 | 93 |
| Hudson Swafford | $6,700 | 92 | 120 | 49% | -0.01 | -0.16 | 1/2 | 56 | 72 | 500 | 500 | 500 |
| Patton Kizzire | $6,700 | 118 | 179 | 26% | -0.73 | 0.52 | 1/1 | 33 | 500 | 500 | 500 | 500 |
| Cameron Tringale | $6,700 | 212 | 167 | 30% | -0.31 | 0.15 | 4/5 | 131 | 17 | 25 | 3 | 46 |
| Danny Lee | $6,700 | 111 | 197 | 19% | -0.05 | -0.68 | 1/2 | 500 | 7 | 96 | 500 | 500 |
| Chad Campbell | $6,700 | 203 | 203 | 16% | 0.12 | -0.51 | 1/4 | 94 | 24 | 500 | 78 | 93 |
| Harold Varner | $6,700 | 130 | 200 | 17% | 0.16 | -0.65 | 0/1 | 104 | 500 | 500 | 500 | 500 |
| Geoff Ogilvy | $6,700 | 189 | 188 | 24% | 0.00 | -0.27 | 2/4 | 116 | 500 | 96 | 61 | 16 |
| Kelly Kraft | $6,700 | 170 | 221 | 8% | 0.13 | -0.21 | 0/0 | 500 | 500 | 500 | 500 | 500 |
| Bryce Molder | $6,700 | 213 | 282 | -20% | -0.97 | 0.33 | 2/5 | 71 | 85 | 96 | 30 | 20 |
| Brett Stegmaier | $6,700 | 296 | 289 | -23% | -0.88 | 0.05 | 1/1 | 18 | 500 | 500 | 500 | 500 |
| Chad Collins | $6,700 | 305 | 264 | -11% | -0.85 | 0.23 | 1/3 | 94 | 500 | 38 | 500 | 138 |
| J.J. Henry | $6,700 | 481 | 372 | -38% | -0.49 | -0.24 | 2/4 | 500 | 138 | 96 | 51 | 66 |
| Cameron Smith | $6,600 | 121 | 139 | 44% | 0.71 | 0.52 | 1/1 | 42 | 500 | 500 | 500 | 500 |
| John Huh | $6,600 | 227 | 149 | 39% | 0.33 | 0.18 | 2/5 | 22 | 33 | 96 | 90 | 131 |
| James Hahn | $6,600 | 74 | 129 | 49% | 0.04 | 0.05 | 1/3 | 124 | 500 | 38 | 130 | 500 |
| Cheng-Tsung Pan | $6,600 | 122 | 146 | 41% | -0.26 | 0.40 | 0/0 | 500 | 500 | 500 | 500 | 500 |
| Retief Goosen | $6,600 | 257 | 265 | -1% | 4/5 | 11 | 69 | 44 | 104 | 20 | ||
| Tyrone Van Aswegen | $6,600 | 240 | 239 | 11% | -0.24 | -0.49 | 0/1 | 71 | 500 | 500 | 500 | 500 |
| Boo Weekley | $6,600 | 319 | 244 | 10% | 0.26 | -0.91 | 2/5 | 124 | 85 | 84 | 2 | 85 |
| Troy Merritt | $6,600 | 205 | 303 | -12% | 0.29 | -0.11 | 1/2 | 104 | 6 | 500 | 500 | 500 |
| Jon Curran | $6,600 | 160 | 314 | -13% | -0.23 | -0.26 | 1/2 | 116 | 40 | 500 | 500 | 500 |
| Mark Hubbard | $6,600 | 490 | 428 | -27% | -0.97 | -0.36 | 1/1 | 64 | 500 | 500 | 500 | 500 |
| Matt Every | $6,600 | 858 | 717 | -31% | -4.08 | -0.57 | 3/5 | 42 | 138 | 8 | 78 | 77 |
| Steven Bowditch | $6,600 | 497 | 753 | -32% | -2.26 | -0.95 | 0/4 | 140 | 103 | 96 | 120 | 500 |
| Bud Cauley | $6,500 | 179 | 128 | 56% | 0.68 | -0.52 | 1/1 | 500 | 500 | 500 | 500 | 16 |
| Ian Poulter | $6,500 | 202 | 122 | 59% | -0.29 | 0.28 | 2/2 | 67 | 24 | 500 | 500 | 500 |
| Robert Streb | $6,500 | 116 | 188 | 39% | 0.06 | -0.22 | 1/1 | 500 | 500 | 500 | 51 | 500 |
| Richy Werenski | $6,500 | 234 | 208 | 31% | -0.12 | -0.07 | 0/0 | 500 | 500 | 500 | 500 | 500 |
| Martin Flores | $6,500 | 230 | 228 | 24% | -0.27 | 0.48 | 1/4 | 500 | 72 | 96 | 51 | 115 |
| Whee Kim | $6,500 | 281 | 244 | 19% | -0.01 | 0.20 | 1/1 | 53 | 500 | 500 | 500 | 500 |
| Blayne Barber | $6,500 | 239 | 244 | 19% | -0.21 | 0.45 | 1/2 | 42 | 133 | 500 | 500 | 500 |
| Ben Crane | $6,500 | 414 | 258 | 13% | -0.21 | -0.29 | 1/4 | 104 | 116 | 32 | 104 | 500 |
| Aaron Baddeley | $6,500 | 153 | 325 | -4% | -0.60 | -0.30 | 1/2 | 500 | 500 | 119 | 56 | 500 |
| Kyle Reifers | $6,500 | 173 | 331 | -7% | 0.26 | -0.75 | 2/3 | 64 | 72 | 500 | 500 | 38 |
| Ricky Barnes | $6,500 | 253 | 381 | -10% | -1.13 | 0.12 | 2/4 | 124 | 53 | 77 | 78 | 500 |
| Greg Chalmers | $6,500 | 303 | 350 | -8% | -0.84 | 0.11 | 4/4 | 500 | 47 | 44 | 4 | 29 |
| Alex Cejka | $6,400 | 193 | 264 | 20% | -0.51 | -0.68 | 1/2 | 500 | 53 | 500 | 500 | 93 |
| Sam Saunders | $6,400 | 244 | 26% | -0.60 | -0.30 | 2/2 | 22 | 24 | 500 | 500 | 500 | |
| Zac Blair | $6,400 | 272 | 249 | 23% | 0.26 | -0.35 | 0/2 | 134 | 72 | 500 | 500 | 500 |
| Jason Bohn | $6,400 | 275 | 265 | 18% | -0.45 | 0.07 | 3/4 | 500 | 17 | 65 | 90 | 44 |
| Bryson DeChambeau | $6,400 | 151 | 294 | 11% | 0.53 | -0.96 | 0/0 | 500 | 500 | 500 | 500 | 500 |
| Johnson Wagner | $6,400 | 214 | 325 | 5% | -0.31 | -0.01 | 0/1 | 500 | 500 | 132 | 500 | 500 |
| Rod Pampling | $6,400 | 144 | 325 | 5% | 0.40 | -0.51 | 0/2 | 500 | 85 | 500 | 500 | 93 |
| Dominic Bozzelli | $6,400 | 233 | 294 | 11% | -0.30 | -0.37 | 0/0 | 500 | 500 | 500 | 500 | 500 |
| Peter Malnati | $6,400 | 380 | 419 | -2% | -0.63 | 0.24 | 0/1 | 85 | 500 | 500 | 500 | 500 |
| Zach Wright | $6,400 | 442 | -5% | 0/0 | 500 | 500 | 500 | 500 | 500 | |||
| Jimmy Stanger | $6,400 | 475 | -5% | 0/0 | 500 | 500 | 500 | 500 | 500 | |||
| Rod Perry | $6,400 | 1056 | -9% | 0/4 | 94 | 133 | 96 | 152 | 500 |
Color Coding
Course history in BLUE indicates a top ten finish.
Course history in GREEN indicates a top 25 finish.
Course history in YELLOW indicates a made cut with a finish outside of the top 25.
Course history in RED indicates a missed cut.
Legend
| Term | Description |
|---|---|
| OWGR | Official World Golf Ranking |
| Odds +/- | The percentage differential between a golfer’s salary rank and odds rank. The higher the %, the better. |
| SGT2G | Strokes Gained Tee to Green in 2017. |
| SGP | Strokes Gained Putting in 2017. |
| Cuts | Cut record of each golfer at this course in the last five seasons. |
| 2012 – 2016 Columns | Course history at this event in the last five seasons. |