PlateIQ Formatting FAQ

PlateIQ is an awesome tool, but without knowledge of what is good and what is not good… it can be confusing. That’s why we’ve looked at the statistics and created a color coded scale for each. You can now quickly view the PlateIQ Dashboard, and know instantly what the stats mean as compared to the league median value.
Note: PlateIQ Conditional Formats are only available to Premium Members
Below, you’ll find a brief summary of how to read the formats.
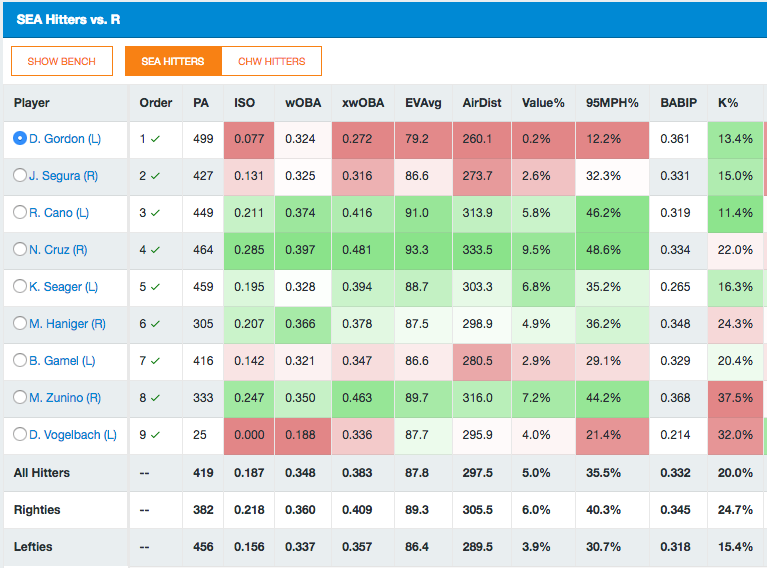
Conditional Format in Batter Grids
Red: The statistic is inferior in the median. A darker shade of red is worse. A lighter shade of red is closer to the league median.
Green: The statistic is superior the median. A darker shade of green is better. A lighter shade of gren is closer to the league median.
No Color: The statistic is very close to the median.
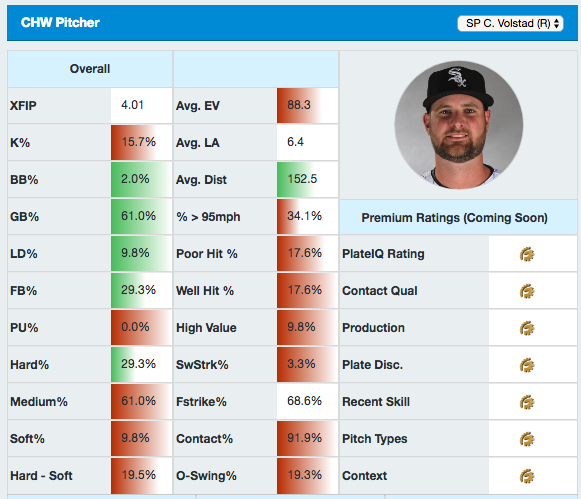
Conditional Format in the Pitcher Dashboard
Red: The statistic is inferior to the median. The progress bar indicates the severity. More shading in the progress bar is bad. Less shading in the progress bar is closer to league median.
Green: The statistic is superior to the median. The progress bar indicates the severity. More shading in the progress bar is good. Less shading in the progress bar is closer to league median.
No Color: The statistic is very close to the median.
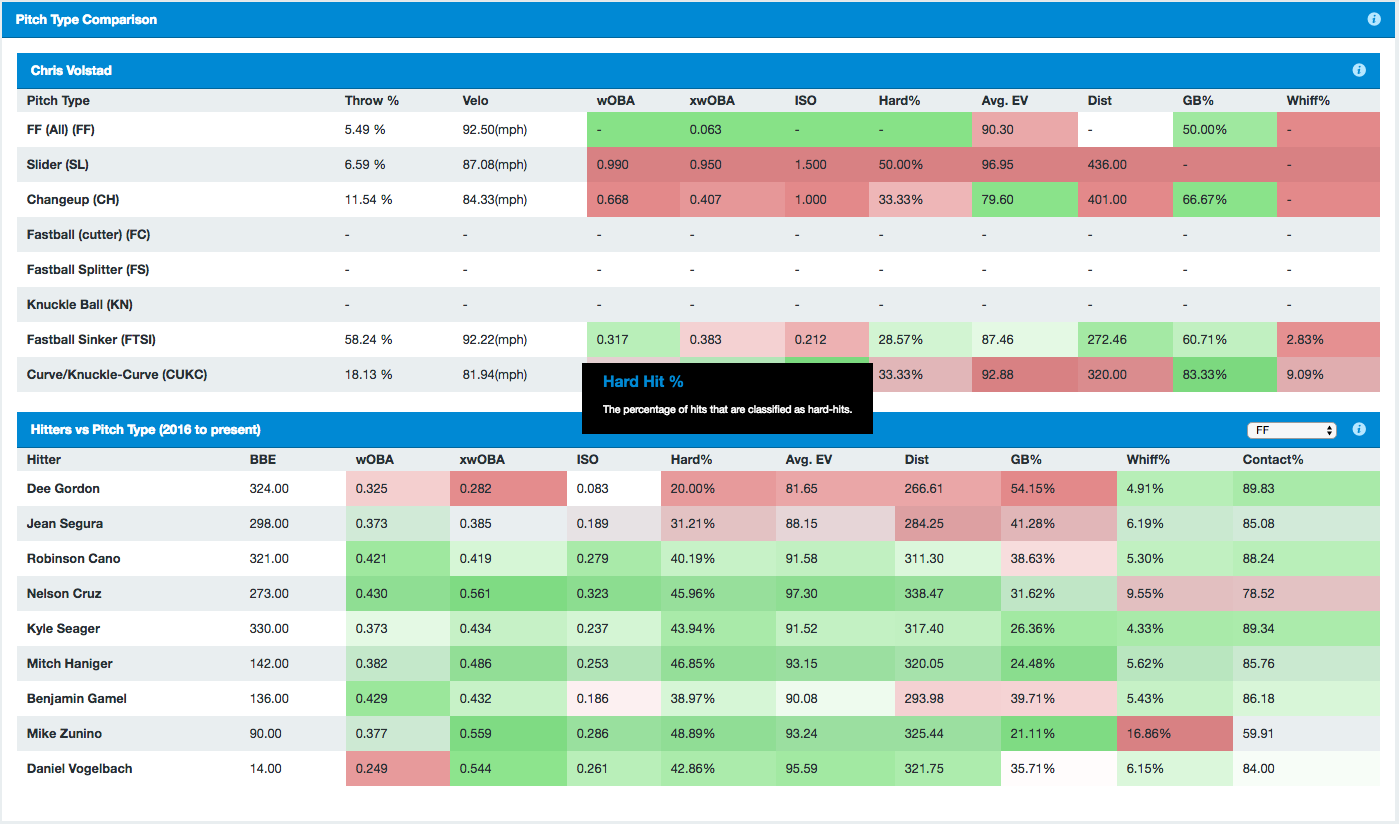
Conditional Format in the Pitch Type Comparison
Red: The statistic is inferior in the median for that pitch. A darker shade of red is worse. A lighter shade of red is closer to the league median.
Green: The statistic is superior the median for that pitch. A darker shade of green is better. A lighter shade of gren is closer to the league median.
No Color: The statistic is very close to the median.