Explanation of Model Methodology and Results

For the past five months our PGA tour DFS projections have been based off of a model that simulates each tournament 10,000 times. We’ve provided median, ceiling and floor fantasy points projections based on the model, and now we’re applying the simulations to various betting options for the 2018 Open Championship: to-win futures, top-5/top-10 finishes, and various tournament matchups.
Note: All betting lines used in this analysis are from mybookie.ag and may have subsequently moved.
Model methodology
Before we get into the results of the model, I’m going to spend a little time breaking down how it works. The model incorporates PGA, Euro and Web.com tour data for every player-round going back to 2008. The player-rounds are then adjusted for strength of field through an iterative process that makes incremental adjustments to field strength to account for previous results.
Once the model has the field-strength adjustments, it’s trained to predict the expected round score for each golfer based on a number of features narrowed down through extensive testing: 1) Rolling 18-month round score, 2) Rolling two-month round score, 3) Course difficulty adjustment, 4) Days since last tournament, and 5) Course history. There is also an interactive term in the regression that gives more weight to players with extensive historical data, and discounts those who have played fewer rounds over the last 18 months.
The model then adds or lowers the expected round score for each simulated round based on each golfer’s variance distribution. Below a threshold of 200 rounds in the past 18 months, a golfer’s distribution is blended with that of the average PGA tour golfer . In other words, if the golfer has played 200 or more over the last 18 months, his actual distribution is used. If the golfer had only played 100 round, the distribution is based on an equal blend (100/100) of his historical distribution and an average golfers.
There are also additional adjustments to the model to account for lower-than-average expected performances for golfers who are either in their first tournament, or have a very limited historical data.
With the expected round scores and variance distributions ready for each golfer, the model then simulates 10,000 four round tournaments. The probabilities you’ll find in this package are based on the actual results of these 10,000 simulations, i.e. if a golfer has a 10% model to-win probability, he had the lowest tournament score in 1,000 of the 10,000 simulations.
How to interpret the results
Comparing the probabilities for to-win, top-5 and top-10 to those implied by betting line is fairly intuitive. The results below are the top-10 to-win bets sorted by ROI (as percentage). The “Betting Lines” are listed without the traditional “+”, so 1000 is +1000 to win. As you can see, the highest expected returns are mostly on long-shot, lower probability golfers.
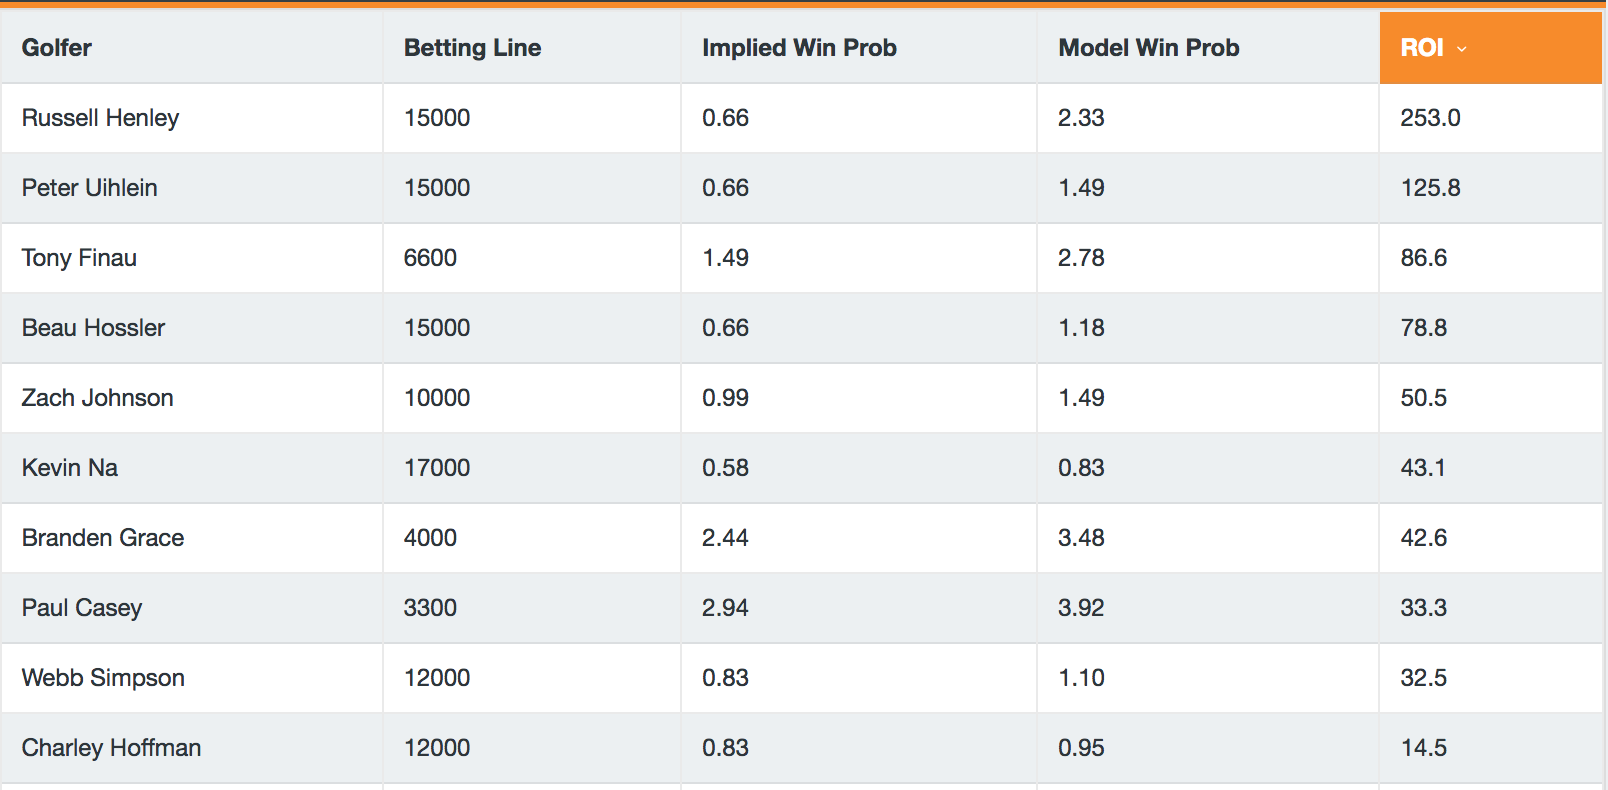
You’ll notice that the vast majority of golfers are seen as negative ROI bets by the model. This is mostly due to line pricing that build in profit for bookmakers.
Assessing the results of the golfer matchups is a little more opaque. Sometimes golfers with lower overall win probabilities can be favored in matchups because they play a lower variance game, meaning their median outcome is better. This is the case for Justin Rose versus Dustin Johnson. The model projects Rose to win more often head-to-head, but also gives him less upside and a lower chance to win the tournament.
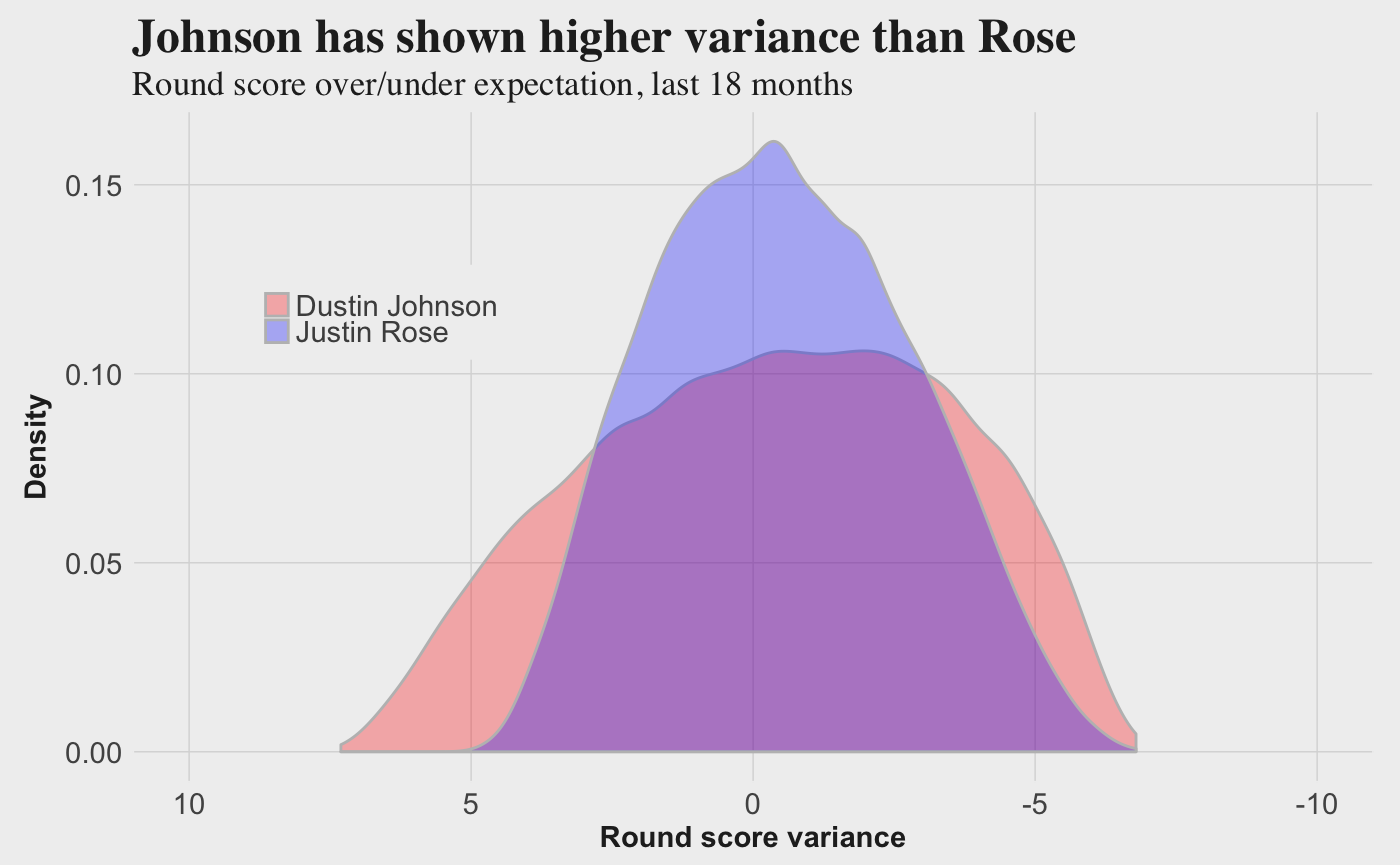
The results presented from the model account for this by comparing the tournament scores for the two golfers in each of the 10,000 simulations and then calculating the percentage of time each has the lower score, in addition to the likelihood they tie with the same score.
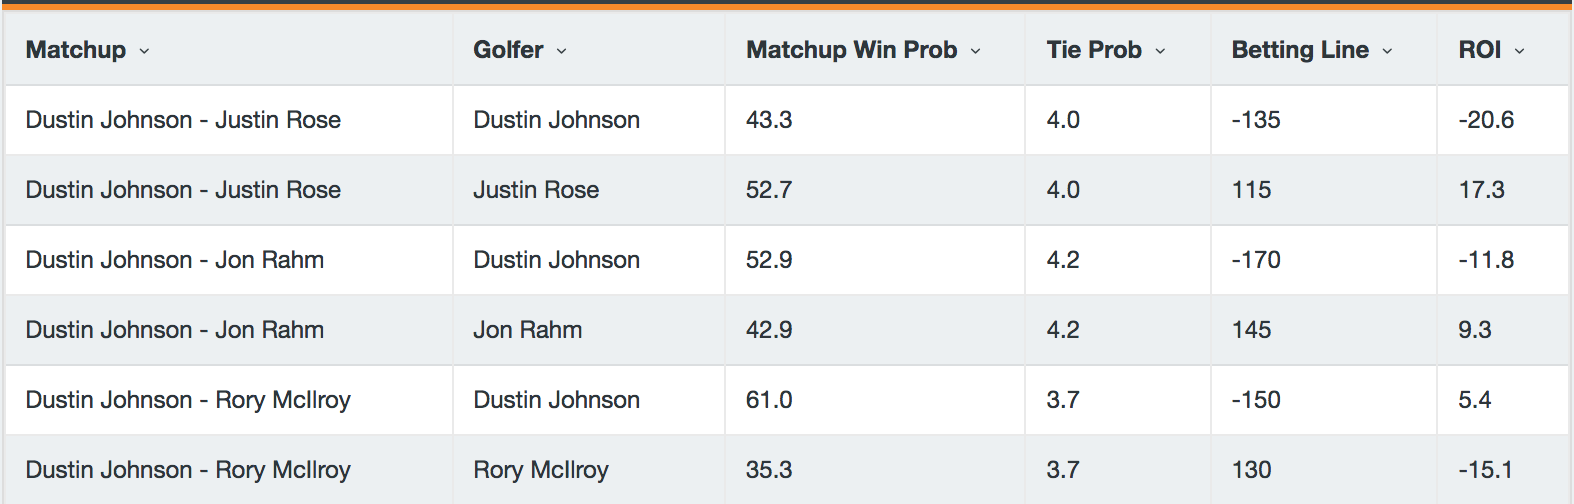
Each of the matchups provided an expected return on invest based on difference between the win probabilities implied by the betting line and those from the model. Here are examples of the model output for some of the headline matchups featuring Dustin Johnson.
Model are tools, not answers
I’m fond of a saying, “All model are wrong, but some are useful.” This golf model uses extensive data, powerful machine learning algorithms, and has been through extensive testing. That said, its results are only as good as the unbiased data can provide. There will always be more that goes into human performance than any model can encompass.
What models are best at is providing a framework for predicting outcomes based on historical performance, not narratives or untested wisdom. Good luck!