Can we predict batted ball profiles?

Answer: Yes, we can, so here’s how to leverage that information into an advantage.
The most challenging position to forecast in the NFL is quarterback. So little of NFL quarterback success is dictated my measurables—college stats, Combine numbers, and so on—that it’s really more of a qualitative evaluation process. You could say that, for teams selecting in the NFL Draft, the quarterback position is more or less of a crapshoot.

But not really, because there’s a very strong correlation between draft round and quarterback success in the NFL. Some of that is probably a self-fulfilling prophecy since top picks get more opportunities, but certainly the Tom-Brady-esque late-round quarterback successes are an anomaly—an exception to the rule that the best quarterbacks come early in the draft. Thus, although the chances of hitting on any quarterback are minimal and somewhat random, there are still underlying percentages that dictate what teams should do.
But what if quarterback draft picks were indeed totally random? That’s actually similar to what we see with running backs (in the NFL Draft) and kickers (in fantasy drafts). Since 2000, running backs drafted after the second round have a higher YPC and success rate than those drafted in the first two rounds. NFL teams suck at evaluating running back talent. Similarly, kickers have a near-zero correlation when it comes to fantasy points from one season to the next; their production is more or less random.
The level of randomness and predictability inherent to a player, position, or stat is a fundamental component of determining cost. Note that something can be extremely important without being valuable; importance and value are two separate traits.
In daily fantasy football, for example, kicker performance is absolutely vital to your GPP success. To win a large tournament, you basically need your kicker to have a big day. But that doesn’t mean that you should be paying top-dollar for what you believe is the top kicker; because kicker performances are extremely volatile, it doesn’t make sense to pay a lot of cash for one. With any player, you should be asking, “How can I replicate this production at a similar price?” The ability to replicate production is fundamentally tied to consistency and predictability; if we can’t predict a particular phenomenon, we shouldn’t be allocating a lot of salary cap space in an attempt to gain exposure to it.
This is the foundation behind the idea that you should pay up for elite pitching in daily fantasy baseball. That general heuristic holds water in cash games, and even GPPs.
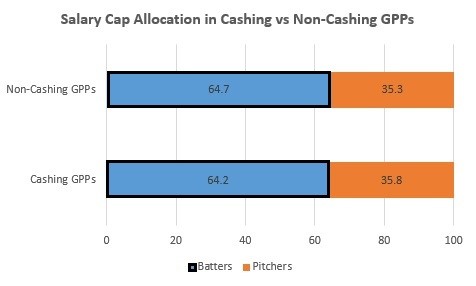
Cashing lineups spend a higher percentage of their cap on their pitching, which is beneficial because pitching is far, far less volatile—and thus more predictable—than batting.
Our ability to leverage batted ball profiles into a competitive advantage, then, extends only insofar as our ability to predict how batters are going to hit the ball.
Batted Ball Consistency
Luckily for us, batted ball profiles are the single most consistent stat in all of baseball. That goes for both pitchers and batters. Using data from FanGraphs, I researched GB/FB ratios for players over the past few seasons. I charted everything in Excel, and anecdotally, the consistency of GB/FB ratios has been incredible.
It turns out that there’s a 0.852 r-value for GB/FB consistency for hitters. Another way to think of that is that 85 percent of a batter’s batted ball profile—85 percent of how often he puts the ball into the air or on the ground—is due to factors that will repeat themselves, while only 15 percent is the result of variance.
Translation: fly ball rates are extremely predictable. We rarely, rarely see a batter hit a high percentage of balls on the ground in one season and then a low percentage the next. Of the players I analyzed, nearly two-in-three saw their GB/FB ratios change by 15 percent or less.
And the same is true for pitchers. Below, I created a matrix displaying the correlations between a number of stats.
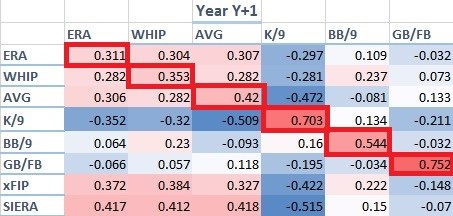
The strongest correlation there is GB/FB ratio—even stronger than the notoriously consistent K/9. Yes, you can predict what percentage of ground balls and fly balls a pitcher will allow even more accurately than how many players he will strike out.
Ultimately, this incredible consistency with batted ball profiles contributes immensely to their value to us as daily fantasy players.
How Batters and Pitchers Match Up
We can trust past batted ball profiles as an accurate representation of how a hitter will perform in the future. That’s important when you want to categorize players and analyze smaller sample sizes, which provides value when dealing with batted ball profiles.
The reason that is advantageous is because certain types of hitters match up better with certain types of pitchers in terms of batted balls (in the same way that certain batters crush fastballs more so than breaking balls or how righties usually match up better with lefty arms).
Here’s a look at nine different buckets showing a batter’s True Average based on his batted ball profile and that of the pitcher. To be considered a fly ball batter or pitcher, a player had to have a fly ball percentage at least one standard deviation from the mean (and the same goes for ground ball batters).
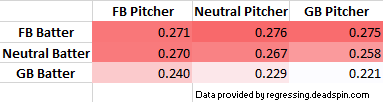
Fly ball hitters dominate in just about every category, particularly against neutral and ground ball pitchers. Actually, fly ball hitters are the only category of batter to perform better against ground ball pitchers. With the league rapidly shifting to an emphasis on ground ball pitching, you can see why the A’s have loaded up on batters who can put the ball into the air.
With this data in mind, I have three tips when assessing batter/pitching matchups by batted ball profiles.
1. Fly ball hitters as a whole offer value, regardless of the pitcher type. That value doesn’t change much based on the pitcher, and it’s also not fully priced into daily fantasy salaries.
2. Avoid ground ball and neutral hitters against ground ball pitchers. Pitchers who induce ground balls are really, really bad for most batters.
3. Ground ball and neutral hitters can offer value versus fly ball pitchers, assuming you’re getting a discount based on their overall stats. I wouldn’t say you should never, ever use a ground ball hitter, but I would say pretty much never use one against anything other than a fly ball pitcher.
Defining Batter and Pitcher Types
The batters/pitchers that can be categorized as either ‘ground ball’ or ‘fly ball’ (as opposed to neutral) are basically those who rank in the top third in each category. Using stats from last season, here are those percentages.
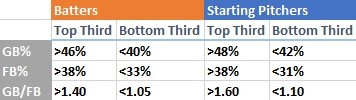
A hitter who hits more than 38 percent of his balls in the air is considered a fly ball batter, for example. The bottom third in fly ball rate is anything below 33 percent—not much lower—which shows the incredible impact that small changes in batted ball profile can have on other stats.
I think what we’re actually seeing with that effect is more predictive value. Guys who consistently put the ball in the air typically see the biggest benefit from those fly balls, even on a per-hit basis. For example, ground ball batters don’t turn as high of a percentage of their fly balls into home runs as fly ball batters.
Anyway, to sum up this lesson in caveman terms: for bats, fly ball good, ground ball no good.