The Importance of Fly Balls

Prior to writing my book Fantasy Baseball for Smart People, I was messing around with FanGraphs’ statistical database performing searches on win probability and other advanced metrics that women find irresistible. Seriously, they can’t help themselves once I whip out my ISO. “Tell me again how it’s a perfect measure of raw power,” they exclaim.

If there’s one unique stat that the ladies love, though, it’s batted ball profiles. Consequently, I spend a lot of time studying ground ball and fly ball percentages. I just don’t want to be that guy who gets rejected by a girl because he can’t tell her which team led Major League Baseball in fly ball rate last season.
While looking at last year’s batted ball profiles on the team level, I noticed the Oakland Athletics were a pretty sizeable outlier in terms of fly ball rate.
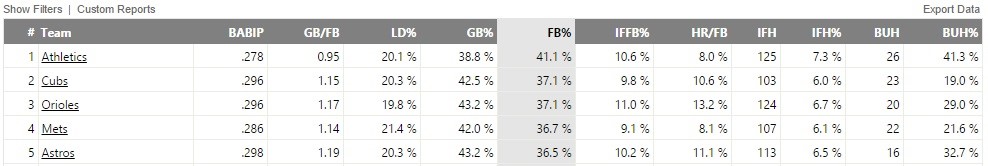
The difference between Oakland’s 41.1 percent fly ball rate and that of the second-place team—the Cubs—was greater than the difference between Chicago and the next 19 teams in baseball.
And it wasn’t just last season. Oakland ranked first in fly ball rate, by a wide margin, in the prior season as well. And the one before that.
Over the past decade, no team other than Oakland has seen more than 45 percent of their at-bats come from fly-ball batters—hitters whose ground ball rate is one standard deviation below the league mean. Most teams are around 17 percent. Last season, the A’s saw 60 percent of their at-bats come from fly-ball hitters.
Oakland has clearly placed an emphasis on finding batters who put the ball into the air. Whenever the data-driven Athletics target a specific player or stat to such an extreme, I’m interested. More so than any other sport, daily fantasy baseball players can learn a lot from studying smart MLB GMs.
So why are the A’s emphasizing fly ball rate to such a ridiculous degree?
The Numbers Behind Fly Balls
Here’s what I had to say about batted ball profiles in my book…
There’s been a recent shift among MLB teams to more and more ground ball pitchers, and Oakland has tried to exploit that trend by securing as many hitters as possible who can take advantage of those arms.
Here’s a look at slugging percentage versus GB/FB ratio…
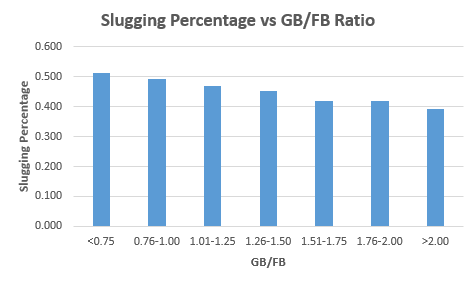
There’s a very linear relationship, with higher ground ball rates leading to less and less power. That makes sense, obviously, since you generally need to get the ball into the air to hit for extra bases. It’s worth noting that GB/FB ratio is one of the most consistent stat out there for pitchers, too, with a 0.75 strength of correlation from year to year—more consistent than a pitcher’s K/9.
That means that we can predict ground ball and fly ball rates with really quality accuracy; the same bats tend to hit the ball into the air and the same arms tend to allow the ball to be hit into the air.
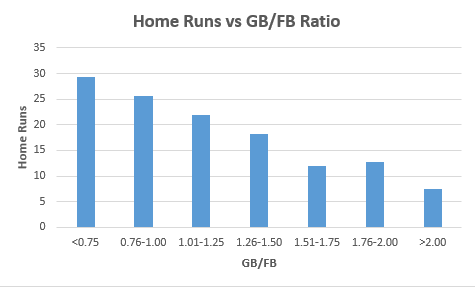
And if we look at the average number of home runs broken down by GB/FB ratio, we see that it’s the hitters who can avoid ground balls who continually offer the most power, and thus the most access to home runs and, ultimately, fantasy production.
And here’s a look at the average number of at-bats per home run allowed since 2000 for the three categories of pitchers…
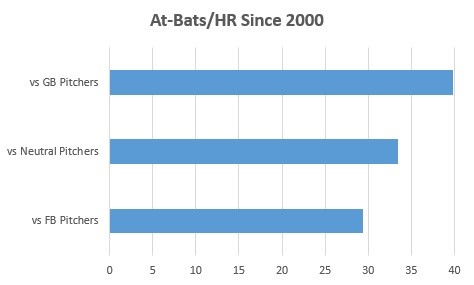
Fly ball pitchers allow a batter to go deep around 25 percent more often than ground ball pitchers. If you’re continually giving yourself exposure to batters with favorable splits in terms of both handedness and batted ball profiles, you can significantly enhance your probability of squeezing home runs out of your lineup.
I wanted to take this analysis to the next level by examining the correlations between batted ball profiles and various baseball statistics. Here’s a matrix of some stats and how closely they’re linked to ground balls per fly ball (GB/FB), ground ball percentage (GB%), and fly ball percentage (FB%). Again, all of these numbers can be found at FanGraphs.
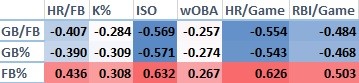
There’s a strong positive correlation between FB% and every single stat listed here, and a strong negative correlation between both GB/FB and GB% and every stat. Let’s break them down one-by-one.
HR/FB: Fly ball hitters are able to convert a much greater percentage of their fly balls into home runs.
K%: Fly ball hitters also strike out more often than ground ball hitters. All of the upside fly ball hitters provide, however, makes the extra strikeout downside worth the risk. I think that’s even true in cash games; if a player can’t hit for power or steal bases, I generally don’t want him in my lineup.
ISO: This is the strongest correlation for GB/FB, GB%, and FB%. ISO is a measure of raw power, and fly ball hitters are much, much more likely than ground ball batters to hit for extra bases.
wOBA: I thought that this was a really important correlation to study because wOBA is often defended as one of the best catch-call statistics in baseball—a true measure of offensive quality and a really nice predictor of total fantasy success. It rewards players who get on base and power hitters alike, so the fact that fly ball batters dominate ground ball hitters in this category is important.
HR/Game: Batters who hit a large percentage of balls on the ground obviously have a far greater time going deep with consistency.
RBI/Game: Fly ball hitters drive in significantly more runs than ground ball hitters.
So yeah, these results are pretty obvious; fly ball hitters are much superior to ground ball hitters as a whole. They provide the power and upside you need to win in daily fantasy baseball. And this course is designed to show you how to do something that very, very few daily fantasy baseball players have ever attempted—leverage batted ball profiles into profit.