Using Fly Ball Rate to Predict Home Runs

In middle school, I hit a ground ball down the first baseline that I ended up legging out for a home run. I stopped the game and made the opposing pitcher toss me my “home run ball,” which is still on display at my mom’s house (it’s whatever). Chicks dig the long-ball.*

I also remember in that same game there was a really attractive female in the stands and my friend on the team said something like, “Wow, she has a gorgeous complexion,” and we made fun of him for a long time since we didn’t think that was appropriate language for human beings of our age. I didn’t really care though because I was just on Cloud Nine that the girl with the gorgeous complexion saw my (three-run) home run ground ball.
I thought my newfound power might propel me to the big leagues, but as I later found out, professional baseball players don’t hit a ton of ground ball home runs. Turns out most of ‘em are hit in the air.
We know there’s a strong correlation between the percentage of balls a player hits into the air and the number of home runs he hits, but there’s also a strong correlation between the percentage of balls a player hits into the air and the rate at which his fly balls leave the park, i.e. fly ball hitters hit more home runs per at-bat than any other type of batter, but also more home runs per fly ball.
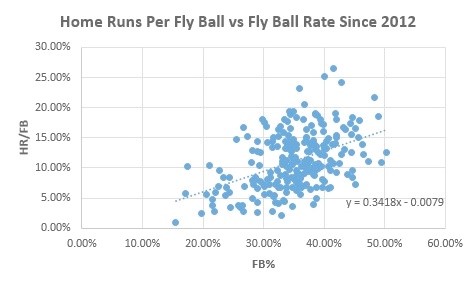
This graph shows the fly ball percentage and home run per fly ball percentage of every batter with at least 1,000 plate appearances since 2012 (237 batters). You can see the obvious relationship between the two variables.
If we knew nothing about a batter’s home runs per fly ball, we could probably make an accurate guess by multiplying his fly ball percentage one-third (also known as dividing by three to us math geeks). So for batters who hit 30 percent of their balls into the air, the most likely HR/FB number is probably around .10, or 10 percent.
Why is this useful? It’s useful because fly balls are easy to predict, but home runs aren’t as easy. We know Josh Donaldson is going to hit more home runs than Brett Gardner, but it’s more challenging to predict if Donaldson is more likely to hit 25 or 35 dongs this year. Knowing his fly ball rate can help with that.
Understanding season-long trends is useful on the daily level, but I think this is a particularly useful tool to understand which players have gotten lucky/unlucky with home runs, especially early in their careers. We know that HR/FB is a volatile stat, but it isn’t totally random; we see that here since fly ball hitters get more home runs per fly ball than ground ball hitters.
So when a young gun comes out of the gates with five home runs in his first 20 games, we can look at his FB% and HR/FB to more accurately determine how much luck was involved with that accomplishment. If he’s hit only 25 percent of his batted balls into the air and has a 20 percent HR/FB rate, that’s probably a sign that the power surge won’t continue.
* Very weakly hit ground balls off the end of the bat that could easily turn into double-plays with a less sluggish first baseman