Announcing Game Flow Tracker, The Newest CourtIQ Feature

The start of the NBA season is upon us and we’re pumped to announce the addition of Game Flow Tracker to CourtIQ. For those new to CourtIQ, it’s a powerful tool that provides a detailed picture of how NBA players perform based on any combination of teammates and opponents on or off the floor. It includes box score stats, usage, and boils it all down to fantasy points produced. It’s an essential part of any serious NBA DFSer’s daily process and there’s no better place to turn following a late scratch. In a couple of clicks, we can see exactly how any player’s absence will impact the game from a fantasy perspective, allowing us to find the best pivots and values.
The brand new Game Flow Tracker takes it to another level by providing complete game breakdowns arranged by “stints” – stretches of time a player is on the floor with a specific lineup between substitutions. It tracks every team’s rotations and logs each player’s activity during each stint, including points, rebounds, assists, blocks, steals, and fouls. It’s all laid out in a clear and concise manner while providing tons of actionable information. Let’s get to it!
Game Flow Tracker
To access Game Flow Tracker, we just need to run a CourtIQ query and scroll to below the “Differentials” table. We’ll see a list of games based on the date range selected in our query:
![]()
By clicking on any game of our choosing, we’ll see exactly how each matchup played out. With the Spurs set to take on the Timberwolves on Wednesday, let’s take a look at the last time these teams met:
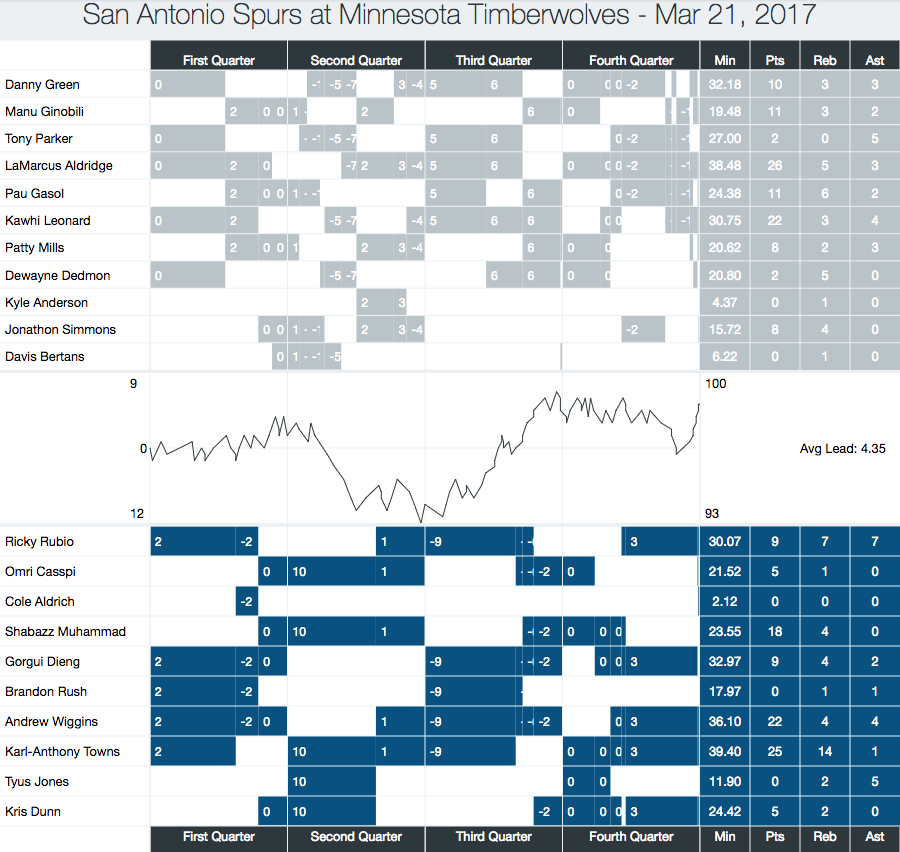
Each game breakdown includes two tables – one for each team – and a graph showing us the game flow based on lead changes throughout each contest. On the left side of the top table, we see every Spurs player that made an appearance when they played the Timberwolves on March 21st last season. They each have their own row broken up by “stints.” Whenever there is a substitution, it results in a new stint. If we take a peek at the top row, we see that Danny Green’s second stint is broken up into three – each break represents a lineup change. The number in each box represents the group’s +/- during their time on the floor. On the far right, we see columns totaling each guy’s minutes, points, rebounds, and assists for the game to get a broad overview of their performance.
This feature is incredibly useful for a number of things. Not only can we easily see how each lineup performed against an opponent’s, but we can see which lineups are preferred by a given coach. It provides better insight into which teammates a player tends to share the floor with, making CourtIQ queries even more actionable. On top of that, it allows us to see trends. For example, we could change the date range to the last two weeks to see how a coach has been using his guys recently to stay ahead of our competition. Also, if we noticed a guy pick up an abnormal amount of minutes, we may find a reason in the breakdowns. Perhaps Dewayne Dedmon saw a sharp bump in minutes the other night while Pau Gasol’s declined. If we pop into the game breakdown, we might find out Gasol got into foul trouble early and it isn’t a bankable change going forward. By hovering over a stint, we can see a pop-up that displays all activity during that period including fouls and all other crucial stats. As we can see above, Dedmon started the game. How did he fare against Minnesota’s starting five? If put our mouse over his first stint we can see:
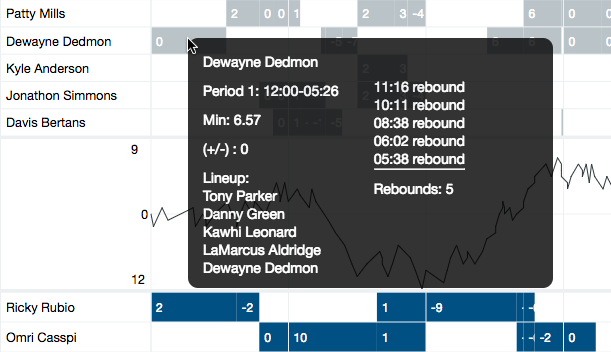
Looks like he was a beast on the glass early on, racking up five boards in about six and half minutes of action. Each pop-up includes the period of time they played on the left along with the specific lineup on the floor during that time. On the right, we see the activity log that shows how involved each guy was when they were on the court. Beneath that, we’ll get total production in each stat category.
There’s so much detail in Game Flow Tracker it’s like watching whole games in a matter of minutes. We’ll have every matchup from every team all season long to help you crush the competition all year!
For those new to CourtIQ, here’s a quick rundown of the tool:
CourtIQ

When we visit CourtIQ, we’re greeted with a main page full of suggested queries and those recently run by fellow Grinders. To run the tool, click on one of those links or create a custom query on the left side of the page by selecting a team from the dropdown menu. When running a new query, we’ll see a pop-up with that squad’s roster:


It all comes down to the on/off selection. For example, if we’re interested in seeing how a starting five is performing together, we just need to select “ON” for all five players. Or if a player is injured, like Kawhi Leonard, take him “OFF” the floor (as demonstrated in the image above) and hit “Run Query.”

Here we see the results page. The top table, as shown above, shows San Antonio’s player-by-player breakdown when Leonard is off the court. By default, it shows us key things such as points, rebounds, assists, usage, and fantasy points earned based on the selected site. We can use the “Stats” filter in the top right to add more stats or hide some we’re seeing. Importantly, CourtIQ gives us the total minutes played in any given scenario so we can get a solid sense of the sample size. Notice above the table we can set the stats to show on a per-minute basis or go by per-36, per-48, or total. This is particularly useful if we’re expecting someone like Kyle Anderson to jump into a Kawhi-sized workload; we can select per 36 minutes and get a sense of what he’s averaged over a whole game in this scenario. Below this table, we’ll see the differentials:

This provides some key context to our results. Understanding Anderson’s raw numbers may be crucial for a situation like this but it’s also imperative to see if that’s an improvement, downgrade, and by how much. This allows us to find value in players that should experience a boost in their production over their average return. On the flip side, it can show us guys to fade if we see massive usage and production dips based on the given situation. In this case, we can see Anderson typically sees just a slight bump in usage when he plays without Leonard. Pau Gasol and LaMarcus Aldridge soaked up the most usage vacated by the small forward and in turn saw the largest production bumps in fantasy. While we probably could’ve guessed these guys would see boosts, CourtIQ allows us to accurately quantify each lineup change or anticipated situation.Now, if we want to have an even better understanding of how this may play out, we can get more specific in our query. Most of Anderson’s minutes without Kawhi are with the second unit. If Anderson starts, he could get plenty of run with a guy like LaMarcus Aldridge. To take things a step further, let’s leave Leonard off and see how Anderson and Aldridge do when they’re on together:


Now we see Anderson’s usage only increases by 0.3% in this scenario and he actually produces fewer fantasy points per minute.
If we want to dig further into this data we’re able to customize our query based on opponent and date range:

With the Spurs set to play the Timberwolves on Wednesday, we might be interested in seeing how the team played against Minnesota without their MVP candidate on the court. By selecting the Timberwolves in the drop down it filters our results. Whether an opponent is selected or not, we can also select a specific date range to better design our sample. For example, if a player we’re interested in was injured during a stretch of time last season, we could block off those dates to get more useful results in our query.