Changes in RB Output from 2010 to 2014

Over the past five years, there have been 56 individual seasons in which a running back received at least 250 carries. Only eight rushers hit the 250-carry mark in 2014, ending a four-year streak of at least 11 rushers hitting the 250-plus rush attempt mark.
While the days of abundant “workhorse” backs may be over due to the fact the NFL is shifting towards a more pass-heavy approach and is featuring a package of backs for individual game situations, this may have an adverse impact on the way we perceive running back quality and quantity in the fantasy realm. But does that bias hold true? Since we’re witnessing fewer “workhorse” running backs, are we also seeing an overall decrease in output at the position?
To find out, I examined the past five years of running backs’ week-to-week fantasy output. Keep in mind, this was individual week-to-week scoring and was not just a combing-through of season-long numbers.
Editor’s Note: This is one of the many valuable DFS lessons that can be found over at RotoAcademy. Click here to browse through all of our free/premium offerings and improve as a daily fantasy sports player!
I set aside some outlines for each tier: an “RB1” is any back who finished inside of the top 12 running backs on a given week, an “RB2” placed 13th through 24th in that specific week, and an “RB3” finished anywhere in the range of 25th through 36th.
Here’s a graph looking at week-to-week average running back fantasy output from 2010 to 2014. All scoring is points per reception (PPR).
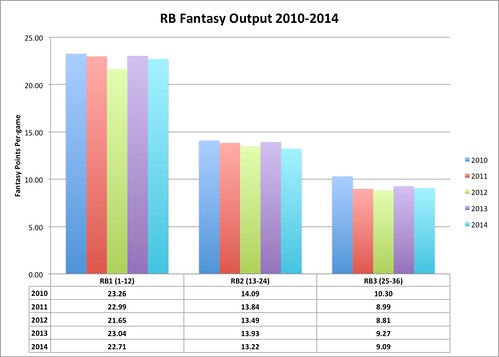
At the outset, I expected a drop-off in running back output across all three of our running back tiers. While there is some definite change occurring year over year (comparing base-year 2010 to 2012), a massive drop-off in running back output wasn’t necessarily the case here.
What Can We Learn From This?
First, I think it’s important to note that while running backs may not be hitting the 250-carry benchmark at an exorbitant rate any longer, teams are throwing the ball more which lends to more targets and receptions at the running back position. That is solid news for PPR scoring formats.
Notice that the trend from 2010 to 2012 was a 1.61 drop-off in PPR points per game among the RB1 tier, but that was then negated by two rebound years in 2013 and 2014, marking only a small difference (down 0.55 PPR points) in running back output in 2014 compared to 2010.
Second, RB2’s are scoring less year-over-year. We saw a decrease in output from running backs in three of the final four seasons studied — albeit a small dip in output — but it’s still present nonetheless.
I think this can be explained rather simply: running backs in the RB2 tier simply don’t receive as much opportunity as they once did. Total rush attempts is one of the best correlates we have for running back production, and without enough carries, RB2’s weekly output in season-long and in DFS is going to continue to decline.
For season-long fantasy, I think these findings just further cements the fact that you’re going to want a stud RB1 to throw in your lineup every week. If you know RB2’s are historically scoring slightly less, it makes RB1’s that much more valuable. Running backs have always been a scarce commodity, and seeing less workhorses certainly doesn’t change that model.
Similarly for DFS, we see the advantages of paying up for a stud RB1 every week. We want bankable output, and even though some backs may be seeing fewer carries, their coaches are still getting them touches through the air in extensions of the rushing game out of the back-field.
As the NFL continues to change towards a more pass-heavy approach — most running backs may not have 300-carry ceilings — but running backs that can catch passes become gold in PPR formats.
Comparing 2010 to 2014, we see a small dip in output across all running back tiers (RB1/2/3), but the death of the workhorse running back has not spelled the demise of the fantasy running back yet.
Tracking the Changes in Fantasy Football Output for Quarterbacks and Skill Positions is a comprehensive overview of how the fantasy football output of quarterbacks, running backs, wide receivers and tight ends changed from 2010 to 2014, including an investigation of the ceiling and floor expectations for each position.
In Tracking Changes in Fantasy Football Output by Position, you’ll learn:
• Whether the increased emphasis on passing in the NFL has changed output for fantasy football quarterbacks
• Which skill position players benefit most from this emphasis on passing
• Whether running backs are still able to provide dependable production despite the disappearance of workhorse backs
• Why top-flight wide receivers provide both high upside and high floor
Want to keep reading? Purchase the course and learn from the best!