Daily Pitcher Breakdown: June 7th, 2013

Welcome to the Daily Pitcher Breakdown. I will focus on the top selections of the day and give you a breakdown on why they are set up for success against their given opponent. Sometimes there will be a best of the rest section featuring guys who are likely low-dollar options with some upside for those of you who prefer to load your lineup with hitting studs.
There will also be a contingent of the starters that you can ignore each day. They offer no discernible upside so they aren’t worth your time. Because it is baseball and a 162-game season, there are going to be times when guys from the ignore group go off, but we’re dealing with probabilities in the daily game so the goal is to give yourself the best odds for success, not find needle in the proverbial haystack that finally doesn’t poke you.
LEGEND
Stats Shown in Red Are BELOW AVERAGE
Stats Shown in White are AVERAGE
Stats Shown in Green Are ABOVE AVERAGE
Stats Shown in Blue Are ELITE
View descriptions of stats below and Legend FAQ
Performance and Talent Statistics: June 7th, 2013
Note: Implosion Percentage is currently being revamped to better represent true implosion performances
| PLAYER | PERFORMANCE | TALENT | |||||||||
| PITCHER | TM | IP | ERA | SIERA | WHIP | GEM% | IMP% | K% | BB% | HR/9 | G/F |
|---|---|---|---|---|---|---|---|---|---|---|---|
| Correia | MIN | 70.1 | 4.09 | 4.73 | 1.32 | 36.4% | 10.0% | 4.1% | 1.66 | 1.37 | |
| Gonzalez | WAS | 71.2 | 3.64 | 4.04 | 1.19 | 58.3% | 22.3% | 10.3% | 0.75 | 1.22 | |
| Jimenez | CLE | 59.2 | 4.83 | 3.84 | 1.26 | 45.0% | 24.4% | 11.0% | 1.21 | 1.43 | |
| Verlander | DET | 73 | 3.70 | 3.08 | 1.36 | 41.7% | 27.9% | 7.7% | 0.62 | 1.34 | |
| Tepesch | TEX | 55 | 3.44 | 3.73 | 1.27 | 40.0% | 16.7% | 6.0% | 0.98 | 2.15 | |
| Rogers | TOR | 31 | 3.77 | 4.62 | 1.42 | 0.0% | 13.4% | 8.2% | 0.58 | 0.89 | |
| Hammel | BAL | 68 | 5.43 | 4.52 | 1.51 | 33.3% | 16.4% | 8.2% | 1.46 | 1.10 | |
| Archer | TBR | 4 | 11.25 | 4.87 | 2.50 | 0.0% | 18.2% | 13.6% | 4.50 | 2.00 | |
| Hanson | LAA | 34.1 | 4.19 | 5.03 | 1.43 | 33.0% | 12.7% | 6.7% | 1.83 | 0.75 | |
| Doubront | BOS | 55.1 | 4.88 | 3.86 | 1.64 | 30.0% | 23.5% | 11.6% | 0.81 | 1.95 | |
| Wainwright | STL | 89 | 2.33 | 2.67 | 1.01 | 58.3% | 24.4% | 1.7% | 0.20 | 1.78 | |
| Leake | CIN | 68.2 | 2.75 | 3.76 | 1.31 | 54.5% | 17.4% | 5.6% | 0.79 | 1.85 | |
| Fernandez | MIA | 59.1 | 3.34 | 3.61 | 1.16 | 36.4% | 24.4% | 8.9% | 0.91 | 1.33 | |
| Harvey | NYM | 83 | 2.17 | 2.92 | 0.92 | 66.7% | 27.7% | 5.9% | 0.43 | 1.20 | |
| Lee | PHI | 88.1 | 2.45 | 3.39 | 0.96 | 66.7% | 21.6% | 3.8% | 0.51 | 1.00 | |
| Figaro | MIL | 34.1 | 3.67 | 3.26 | 1.25 | 0.0% | 18.5% | 4.8% | 2.10 | 1.89 | |
| Lyles | HOU | 37.2 | 4.30 | 4.26 | 1.49 | 28.6% | 16.7% | 7.7% | 0.96 | 1.70 | |
| Shields | KCR | 86 | 2.83 | 3.42 | 1.05 | 75.0% | 23.2% | 6.2% | 0.84 | 1.31 | |
| Parker | OAK | 68 | 4.90 | 4.56 | 1.44 | 33.0% | 17.4% | 9.5% | 1.46 | 1.17 | |
| Sale | CWS | 70 | 2.44 | 3.21 | 0.91 | 80.0% | 24.4% | 5.9% | 0.77 | 1.36 | |
| Volquez | SDP | 67.1 | 5.35 | 4.76 | 1.51 | 41.7% | 16.0% | 10.3% | 0.94 | 1.43 | |
| De La Rosa | COL | 69.2 | 3.10 | 4.52 | 1.26 | 58.3% | 15.1% | 8.5% | 0.52 | 1.70 | |
| Cain | SFG | 74.1 | 5.45 | 3.75 | 1.21 | 42.0% | 22.6% | 7.6% | 1.57 | 0.89 | |
| Corbin | ARI | 74.1 | 2.06 | 3.80 | 1.05 | 81.8% | 20.6% | 7.4% | 0.48 | 1.50 | |
| Maholm | ATL | 73.1 | 3.68 | 3.89 | 1.24 | 50.0% | 17.6% | 6.7% | 0.74 | 1.87 | |
| Ryu | LAD | 71.2 | 2.89 | 3.56 | 1.13 | 63.6% | 23.3% | 7.6% | 0.75 | 1.34 | |
| Kuroda | NYY | 73 | 2.59 | 3.90 | 1.04 | 58.3% | 17.5% | 4.8% | 0.86 | 1.35 | |
| Bonderman | SEA | 4.2 | 13.50 | 5.95 | 2.14 | 0.0% | 4.2% | 4.2% | 5.79 | 0.00 | |
_____________________________________________________________________________________
STARTING PITCHER BREAKDOWN
Here is a look at the day’s slate of arms and how they might stack in their given matchups.
THE CREAM OF THE CROP:
Adam Wainwright, STL (at CIN) – Why isn’t he being talked about more? He was incredible last year – just a year removed from Tommy John Surgery and he’s been markedly better this year en route to a career year. He has no interest in allowing the two major events that can sink a pitcher quickest: walks and homers. Through his first four starts he hadn’t allowed either. Now 12 starts in and he’s only allowed six walks and a couple homers. Both homers came in Milwaukee in his worst (and only bad) outing of the season. Even against solid opponents like the Reds, Waino is someone to be trusted inherently.

James Shields, KC (v. HOU) – The Astros are playing better of late, but even in the sample that starts on May 29th (the day they started their 6-game winning streak) they are still striking out 25% of the time and someone like Shields will feast on that. After getting smashed around by the Cardinals, Shields bounced back in a tough Texas environment giving up just one to the Rangers on five hits and a walk. He is still one of the best arms in the game, but now he’s overlooked a bit after shifting from the Rays to Royals.
Matt Harvey, NYM (v. MIA) – UPDATE: LAA/BOS & MIN/WAS were cancelled while I was writing this. It’s just a matter of time for this game. So everyone was floored by the Marlins putting it on Harvey a bit during his last outing as they scored four in five innings thanks to 10 hits and a pair of walks and I’m among those who were surprised, but let’s not forget that his outing against them back on April 29th was easily the worst of his first six starts. It was the first time he’d gone fewer than six (5.3) and it was easily his highest hits allowed total at seven (previously hadn’t given up more than four). By no means am I suggesting we should’ve seen it coming, but rather that maybe this team has some confidence against him. I wouldn’t know how to quantify it or how to factor into the rankings, but they’ve gotten to him for 17 hits in 10.3 innings dealing him a pair of no-decisions. Of course, it might all be moot as the weather in the northeast corridor is super rainy and puts this game, LAA/BOS, and MIN/WAS in doubt which is unfortunate for you Jousters and FanDuelers since his price was depressed at both sites. That also means…
Hiroki Kuroda, NYY (at SEA) – The flurry of aces and ace-like substances today most benefits Kuroda, who sees price depressed at all sites despite a favorable matchup in a great venue. In fact, is there a more underrated arm than Kuroda when you also factor in that he is a Yankee which usually equals instant overrating? Consider that in the last calendar year Kuroda’s 2.93 ERA is 11th best in baseball and his 1.07 WHIP is 7th best, both of which are better than Adam Wainwright, Cliff Lee, and Justin Verlander.
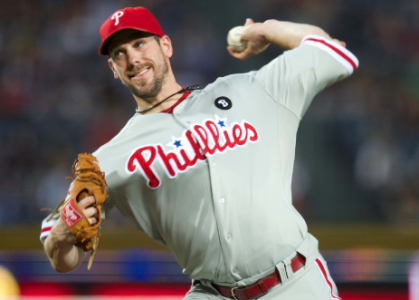
Cliff Lee, PHI (at MIL) – After a big outing against Milwaukee is his most recent outing (7.7 IP, 3 ER, 11 K), Lee surpassed his 2012 win total by notching his seventh of the season. No, he didn’t struggle in 2012, he was just horribly supported! Even at 34, Lee is one of the game’s best and I’m not sure that seeing him recently is going to necessarily help the Brewers thwart him the second time around. In fact, after leading baseball with an 865 against lefties in April, the Brewers 18th in the league with a 700 from May 1st through yesterday.
Justin Verlander, DET (v. CLE) – We don’t usually see Verlander this low, but it’s more of a commentary on the Indians offense than Verlander’s mid-May struggles (which included a big dud against these Indians). His breaking stuff has looked amazing of late as he works his way through his first real struggles since April 2010. Through his first 10 starts, the slider and curve allowed a 521 OPS as he was leaving several of the latter in the zone. In his last two, the pitches have allowed just a 304 OPS and it’s only that high because J.J. Hardy caught a curve and sent out in Camden Yards last weekend. JV has had 23 PA end with those pitches in his last two and 15 were strikeouts. He will be fine. I’m conflicted because you may never see a lower price at Joust and Fantasy Feud, but this Indians lineup is no joke.
Chris Sale, CWS (v. OAK) – We have the second leg of a lot of home-and-home series with the A’s visiting the White Sox a week after getting swept in Oakland. You can’t blame Sale for the sweep, though. He went six strong allowing just a run on four hits and a walk while fanning five. While the A’s have been strong against lefties this year, aces typically transcend those kinds of splits. The only reason he ranks this low is because there are so many aces and his price remains sky-high (with good reason, of course).
Patrick Corbin, ARI (v. SF) – He’s had a pair of “bad” starts his last two times out allowing seven runs in 12 innings. Considering that he won both outings, I’m sure daily fantasy players would take these as his “bad” starts any day of the week. It beats the hell out of “Aaron Harang(player-profile)”:/players/Aaron_Harang-11003’s six runs on eight hits in 2.3 innings, eh?
BEST THE REST:
Hyun-Jin Ryu, LAD (v. ATL) – There’s an annoying danger that comes when picking the opposing pitcher against the Braves, especially if you watch them with any regularity. A couple times a week (even when they win!) they look like the one of worst teams in the league as they flail aimlessly at any offering, but then every so often they muscle up for a home run barrage against someone like A.J. Burnett and end his night after six runs in five innings. Lefties have plagued them of late as they have a 653 OPS against them since May 1st. Ryu sputtered against them back in mid-May as fives were wild: 5 hits, 5 walks, and 5 strikeouts in 5 innings. He managed to escape allowing just two runs, but that same performance would likely be a lot less fortunate a second time around. Ryu needed just three starts to notch 20 strikeouts and ended April with 46. He fanned just 21 in 34 May innings.
Paul Maholm, ATL (at LAD) – He’s had three duds this year and he’s bounced back each time with at least a pair of strong outings before the next road bump. Similar to his counterpart today, Maholm struck 28 batters in his five April starts this year, but then just 27 in his last seven spanning May and one start in June.
Jarrod Parker, OAK (at CWS) – Parker notched just his second quality start of the season on April 30th, his sixth start of the season. From that start on he has a 3.22 ERA and 1.07 WHIP in 44.7 innings spanning seven starts with quality starts in all but one. His stuff was brilliant against the Sox on Sunday as he tossed 6.3 scoreless with only two hits allowed and seven strikeouts. The pricing of Parker certainly hasn’t caught up with his excellent work making a strong bargain target.
Jorge de la Rosa, COL (v. SD) – He has quietly kicked butt all season long regardless of venue including a 2.45 ERA in Coors Field that bests his 3.57 road ERA. The strikeouts are way down from what we are used to, but I’ll trade some missed bats for a career-best ERA and his second-best WHIP. Especially since I think the strikeouts can still come back, though probably not against this Padres which strikes out just 17% of the time against lefties, seventh-lowest in the league.
Jose Fernandez, MIA (at NYM) – He isn’t yet washed out by rain, but he will be… just wait.
USE CAUTION:
Mike Leake, CIN (v. STL) – He’s allowed just one earned run in his last four starts good for a 0.33 ERA in 27 innings of work. And while most of the competition has been pitcher-friendly (at MIA, at NYM, at PIT), he did dominate the Indians for 7.3 innings allowing two runs and the one earned I mentioned earlier. He has a 21% K rate and 4% BB rate during the four-start run. The only caution factor is that the bulk of the run was against subpar competition and tonight’s opponent is the direct opposite of that. His price is worth gambling on, though, even against a tough opponent.
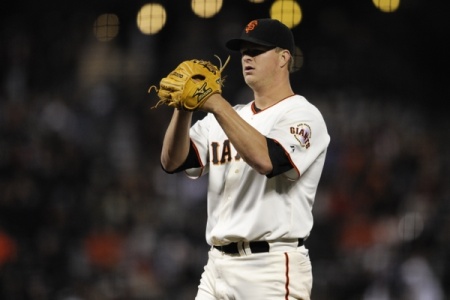
Matt Cain, SF (at ARI) – Every time it looks like he’s coming around, he drops another bomb on our faces. Until he strings four or five starts of vintage Cain in a row, he is officially your problem and not mine. I’m aware of his career-best 23% strikeout rate which has aided a 2.9 K/BB – a four year high. And I do believe he will eventually get better, but until he does, he won’t be taking my bankroll.
Nick Tepesch, TEX (at TOR) – Tepesch has been a revelation for the Rangers this year as their rotation was decimated by injuries, but this isn’t a good spot for him. The Jays are one of the best home teams in the league and they destroy both fastballs and sliders (Tep’s top two pitches). A gem out of him here would be nothing short of a huge upset and today’s slate already offers low-dollar options with true upside so I don’t see any reason to mess with him here.
Ubaldo Jimenez, CLE (at DET) – Credit where it’s due for the two gems against solid opposition (at CIN, home against TB), but if you think I’m playing with this fire, you’re nuts. Even if you believe in him on a longer term basis, what is the upside here against the Tigers and Verlander? I realize he threw six strong against them back on May 11th allowing just one run and fanning eight, but then on May 22nd they ripped him for six earned in four innings.
Jason Hammel, BAL (at TB) – He appeared to be coming out of his funk a bit with back-to-back gems, but then the Tigers came to town and erased his progress. He visits his old stomping grounds tonight against the team that tagged him for seven earned in just 4.7 innings back on May 17th. The caution needed here is obvous.
YOU CAN SAFELY IGNORE:
- Esmil Rogers
- Chris Archer
- Jordan Lyles
- Alfredo Figaro
- Edinson Volquez
- Jeremy Bonderman
- Tommy Hanson LAA CANCELLED
- Felix Doubront – BOS CANCELLED
- Kevin Correia – MIN CANCELLED
- Gio Gonzalez – WAS CANCELLED
_____________________________________________________________________________________
PARK FACTORS: June 7th, 2013
| PITCHER | PARK | PARK-R | PARK-HR | PARK-LHB | PARK-RHB |
|---|---|---|---|---|---|
| Correia | Nationals Park | 0.945 | 0.719 | 0.928 | 0.917 |
| Gonzalez | Nationals Park | 0.945 | 0.719 | 0.928 | 0.917 |
| Jimenez | Comerica Park | 1.077 | 0.858 | 0.934 | 1.080 |
| Verlander | Comerica Park | 1.077 | 0.858 | 0.934 | 1.080 |
| Tepesch | Rogers Centre | 1.157 | 1.488 | 1.074 | 1.124 |
| Rogers | Rogers Centre | 1.157 | 1.488 | 1.074 | 1.124 |
| Hammel | Tropicana Field | 1.029 | 0.857 | 1.044 | 0.958 |
| Archer | Tropicana Field | 1.029 | 0.857 | 1.044 | 0.958 |
| Hanson | Fenway Park | 1.072 | 0.902 | 1.039 | 1.002 |
| Doubront | Fenway Park | 1.072 | 0.902 | 1.039 | 1.002 |
| Wainwright | Great American Ball Park | 1.137 | 1.485 | 1.010 | 0.966 |
| Leake | Great American Ball Park | 1.137 | 1.485 | 1.010 | 0.966 |
| Fernandez | Citi Field | 0.772 | 0.914 | 0.908 | 0.919 |
| Harvey | Citi Field | 0.772 | 0.914 | 0.908 | 0.919 |
| Lee | Miller Park | 1.154 | 1.684 | 1.065 | 1.067 |
| Figaro | Miller Park | 1.154 | 1.684 | 1.065 | 1.067 |
| Lyles | Kauffman Stadium | 0.986 | 1.019 | 0.996 | 0.947 |
| Shields | Kauffman Stadium | 0.986 | 1.019 | 0.996 | 0.947 |
| Parker | U.S. Cellular Field | 0.874 | 0.912 | 0.897 | 0.852 |
| Sale | U.S. Cellular Field | 0.874 | 0.912 | 0.897 | 0.852 |
| Volquez | Coors Field | 1.133 | 0.948 | 0.943 | 1.058 |
| De La Rosa | Coors Field | 1.133 | 0.948 | 0.943 | 1.058 |
| Cain | Chase Field | 0.969 | 0.768 | 1.006 | 0.985 |
| Corbin | Chase Field | 0.969 | 0.768 | 1.006 | 0.985 |
| Maholm | Dodger Stadium | 0.904 | 0.925 | 0.993 | 0.904 |
| Ryu | Dodger Stadium | 0.904 | 0.925 | 0.993 | 0.904 |
| Kuroda | Safeco Field | 0.934 | 0.762 | 1.002 | 0.962 |
| Bonderman | Safeco Field | 0.934 | 0.762 | 1.002 | 0.962 |
_____________________________________________________________________________________
Starting Pitcher Salaries: June 7th, 2013
Shown below are starting pitcher salaries as well as the percent of top statistics.
- Percent of Top (Top) – Player salary divided by the most expensive pitcher each day. So if Felix Hernandez is $9,000 on FanDuel and Justin Verlander is $4,500, Verlanders Top stat would be 50.
1) Percent Top in Red are the most expensive. Between 80% and 100% of the most expensive pitcher each day for each site.
2) Percent Top in Yellow cost between 60% and 80% of the most expensive pitcher each day for each site.
3) Percent Top in Green cost between 40% and 60% of the most expensive pitcher each day for each site.
4) Percent Top in Blue are the cheapest pitchers each day and are 40% or lower than the most expensive pitcher each day for each site.
| Site | FANDUEL | DRAFTSTREET | DAILYJOUST | DRAFTDAY | DRAFTKINGS | FANTASYFEUD | STARSTREET | |||||||
|---|---|---|---|---|---|---|---|---|---|---|---|---|---|---|
| Name | Salary | Top | Salary | Top | Salary | Top | Salary | Top | Salary | Top | Salary | Top | Salary | Top |
| Correia | $4,700 | 48% | $6,910 | 36% | $182K | 39% | $6,650 | 38% | $7,000 | 54% | $62K | 42% | $15,200 | 39% |
| Gonzalez | NA | NA | NA | NA | NA | NA | NA | NA | NA | NA | NA | NA | NA | NA |
| Jimenez | $6,800 | 70% | $10,472 | 54% | $254K | 54% | $9,400 | 53% | $7,100 | 55% | $73K | 49% | $25,100 | 65% |
| Verlander | $9,400 | 97% | $18,116 | 93% | $364K | 78% | $16,800 | 95% | $11,500 | 89% | $101K | 67% | $37,400 | 96% |
| Tepesch | $4,800 | 49% | $9,670 | 50% | $246K | 53% | $7,600 | 43% | $7,200 | 56% | $83K | 56% | $19,000 | 49% |
| Rogers | $3,300 | 34% | NA | NA | $158K | 34% | NA | NA | $5,000 | 39% | $41K | 27% | $18,000 | 46% |
| Hammel | $6,200 | 64% | $9,386 | 48% | $215K | 46% | $8,650 | 49% | $7,100 | 55% | $65K | 44% | $23,500 | 61% |
| Archer | $4,900 | 51% | $10,759 | 56% | $151K | 32% | NA | NA | $9,100 | 71% | NA | NA | NA | NA |
| Hanson | $6,200 | 64% | $9,158 | 47% | $178K | 38% | $8,400 | 48% | $7,300 | 57% | $64K | 43% | $23,200 | 60% |
| Doubront | $6,300 | 65% | $12,244 | 63% | $272K | 58% | $9,250 | 52% | $7,400 | 57% | $89K | 59% | $21,200 | 55% |
| Wainwright | $9,700 | 100% | $19,012 | 98% | $427K | 91% | $17,400 | 99% | $10,700 | 83% | $135K | 90% | $35,800 | 92% |
| Leake | $6,800 | 70% | $13,263 | 68% | $339K | 72% | $9,600 | 54% | $7,000 | 54% | $99K | 66% | $28,500 | 73% |
| Fernandez | $5,900 | 61% | $11,899 | 61% | $287K | 61% | $10,950 | 62% | $6,100 | 47% | $94K | 63% | $27,800 | 72% |
| Harvey | $8,600 | 89% | $18,646 | 96% | $355K | 76% | $17,650 | 100% | $12,900 | 100% | $134K | 89% | $34,600 | 89% |
| Lee | $9,500 | 98% | $19,376 | 100% | $468K | 100% | $15,850 | 90% | $11,200 | 87% | $150K | 100% | $38,800 | 100% |
| Figaro | $2,500 | 26% | $8,255 | 43% | $153K | 33% | NA | NA | $6,000 | 47% | $51K | 34% | $18,000 | 46% |
| Lyles | $5,600 | 58% | $10,337 | 53% | $269K | 57% | $6,800 | 39% | $5,900 | 46% | $69K | 46% | $23,000 | 59% |
| Shields | $7,900 | 81% | $16,292 | 84% | $325K | 69% | $16,750 | 95% | $11,900 | 92% | $105K | 70% | $27,100 | 70% |
| Parker | $6,300 | 65% | $11,585 | 60% | $304K | 65% | $7,800 | 44% | $6,400 | 50% | $96K | 64% | $28,000 | 72% |
| Sale | $9,200 | 95% | $17,981 | 93% | $449K | 96% | $17,550 | 99% | $10,700 | 83% | $131K | 87% | $37,000 | 95% |
| Volquez | $5,800 | 60% | $8,739 | 45% | $196K | 42% | $6,600 | 37% | $7,500 | 58% | $60K | 40% | $23,700 | 61% |
| De La Rosa | $6,600 | 68% | $12,772 | 66% | $315K | 67% | $10,000 | 57% | $7,900 | 61% | $98K | 66% | $25,200 | 65% |
| Cain | $7,600 | 78% | $13,681 | 71% | $263K | 56% | $13,200 | 75% | $8,800 | 68% | $88K | 59% | $29,300 | 76% |
| Corbin | $7,900 | 81% | $16,076 | 83% | $381K | 81% | $14,650 | 83% | $8,200 | 64% | $136K | 91% | $30,200 | 78% |
| Maholm | $6,500 | 67% | $12,163 | 63% | $331K | 71% | $12,450 | 71% | $7,700 | 60% | $103K | 69% | $24,000 | 62% |
| Ryu | $8,400 | 87% | $18,046 | 93% | $368K | 79% | $13,750 | 78% | $9,500 | 74% | $127K | 85% | $31,000 | 80% |
| Kuroda | $6,700 | 69% | $12,655 | 65% | $280K | 60% | $11,700 | 66% | $10,000 | 78% | $103K | 69% | $24,300 | 63% |
| Bonderman | $5,400 | 56% | $3,522 | 18% | $151K | 32% | NA | NA | $5,000 | 39% | $20K | 13% | $19,200 | 49% |