DraftKings Millionaire Maker Trends Through Week 7

Sometimes we need to think about other ways to win in DFS other than simply playing the best plays. Looking at trends of top lineups is one route to take to do just that. One of the easiest tools to become a better tournament player is studying the trends of lineups that win or nearly win.
I’ve been keeping track of some trends for the DraftKings Millionaire Maker for the first five weeks and wanted to share some of those here in a simple format for you to understand. These are all trends from the top 10 lineups each week.
If you want to follow these yourself with a little excel work, you can create your own trends to follow by either downloading the CSV from DraftKings, or just make it easy on yourself by using ResultsDB here on RotoGrinders to gather information.
Flex Usage

Through Week 7 we can see that RBs are still leading the way in Flex usage among the top 10 lineups. RBs have been the leading flex position in six of the seven weeks so far. The field has been using RBs in the flex at a lower rate than they have been appearing in top 10 lineups, so there is an edge to be had if the trend continues to hold.
Average Ownership by Position for Week 7

With Gurley going off at 58.3% ownership, some of the results this week are skewed more than any other week, as he was by far the highest owned player we have seen this season in the Milly Maker. I was rather surprised that the winning lineup this week did not use Gurley. Six of the top 10 lineups had Gurley this week, with two of them using him in the flex, which as you can see caused the flex ownership to bump up.
Average Ownership Through Week 7
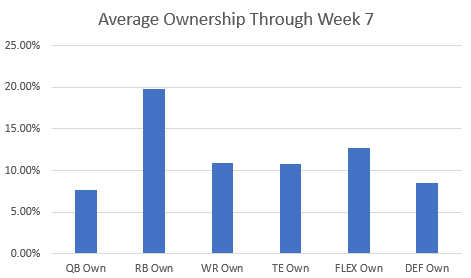
High owned running backs that are locked into every-down roles do not need to be faded. This has been a strong trend since the start of the season. Mix those in with QBs not in the top three of ownership and you have the makings of lineups that have littered the top 10 all season.
Stacks for Week 7
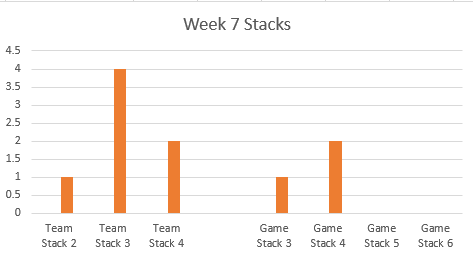
Winning stacks were spread out across both team and game this week, as diversity was more prevalent than it had been nearly all season. Bears stacks with Cohen and Burton littered the top 10 despite Trubisky having a rather bad real life game but a great fantasy one. When a quarterback goes off for a massive game, we can also see that there is plenty of room for him to have two teammates that also provide GPP-winning upside.
Stacks Through Week 7
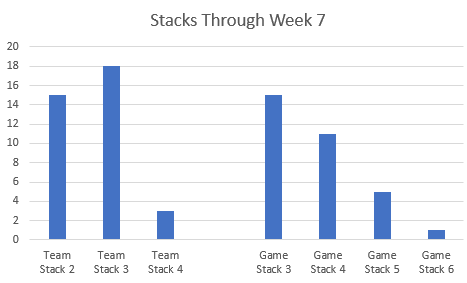
Team stacks have started to take the lead in top 10 appearances, as they have 36 top 10s compared to 32 top 10s for game stacks. A five-man game stack has not made the top 10 since Week 2. I still think it is best to make a wide variety of stacks if you are making lots of lineups.
Bust Rates of Top 3 Highest Owned at Position Through Week 7
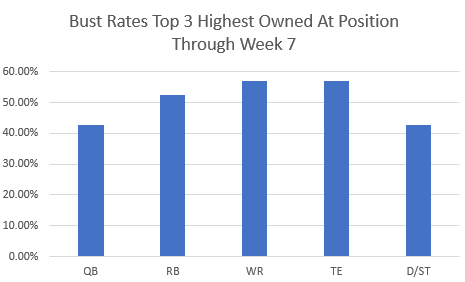
The bust rates are starting to become more in line with what I was expecting as we see the high variance positions of WR and TE failing to come through more than the other more stable skill positions of QB and RB. I would expect the RB bust rate to fall below 50% by the end of the season.
Low Owned Plays (Sub 5%) Per Lineup
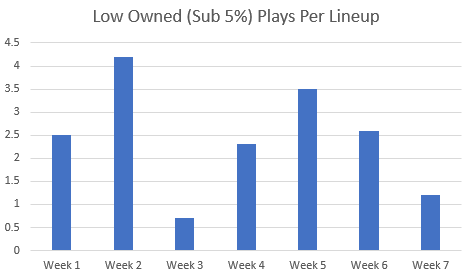
With the bye weeks in full effect and only 10 games on the main slate, we were going to have a week like Week 7. Only 12 players of sub 5% ownership made it into Week 7 top 10 lineups, as the overall player pool is slightly smaller than it was early in the season with just 10 games on the main slate this past week. Overall on the season, we are averaging 2.42 sub 5% owned players per lineup so far. Having Gurley go off at near 60% ownership also kept low owned plays down this week.
Week 7 Winning Lineup

Congratulations to bassinmatt, who used the Trubisky/Cohen/Burton three-man team to take home $1,000,000 on a SINGLE ENTRY. Who needs to win the Mega Millions when you can win life-changing money doing this instead?
Hopefully this can help you look at the way you make your teams in a different light and help you make lineups more correlated with what the top lineups are actually doing.