MLB Heat Check: July 2nd, 2013

Some would argue that the best strategy in daily fantasy baseball is through finding the players heating up and exploiting them. Others would say that guys performing below their typical averages are due to return to the norm and can be terrific sources of value. Well this article will have a little bit for both parties as each week I’ll break down the hottest and coldest hitters in baseball.
For the purpose of this article, we’ll define hot and cold streaks by players recent averages (last fourteen days) vs. their season averages. We’re far enough into the season that, for the most part, we have a decent feel for where players lie. The four key stats looked at in terms of differentials will be:
1) Batting Average
2) Slugging Percentage
3) OPS (On Base + Slugging)
4) Fantasy Points Per Game (based on FD scoring)
Also, to qualify, hitters must have at least 50 plate appearances on the season and 10 plate appearances over the past 2 weeks.
Shown below are the hitters with the largest fantasy point per game differentials between their last 14 days performance and their season averages, along with the percentage increase or decrease for each stat.
HOTTEST HITTERS
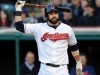
| Jason Kipnis | HOTTEST HITTER #1 |
 | Season | Last 14 Days | Difference | Percent Change |
| AVG | 0.299 | AVG | 0.500 | AVG | 0.201 | AVG | 67.2% |
| SLG | 0.533 | SLG | 0.975 | SLG | 0.442 | SLG | 83.0% |
| OPS | 0.910 | OPS | 1.557 | OPS | 0.647 | OPS | 71.1% |
| FPPG | 3.75 | FPPG | 6.75 | FPPG | 3.00 | FPPG | 80.0% |
- Not surprising that Kipnis weighs in as the hottest hitter of recent times. His price has skyrocketed thanks in part to an ungodly .500 batting average over the past 2 weeks to go with nearly 7 FPPG. Oh, he’s also averaging over an RBI per game.
- This seems like a classic play to fade. As his price tag rises to meet his recent performance it’s hard to believe anyone can stay this hot. To me, Kipnis is a guy to avoid at his price point as he’s probably past the peak of this recent hot streak.
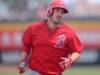
| Ryan Flaherty | HOTTEST HITTER #2 |
 | Season | Last 14 Days | Difference | Percent Change |
| AVG | 0.213 | AVG | 0.452 | AVG | 0.239 | AVG | 112.2% |
| SLG | 0.351 | SLG | 0.839 | SLG | 0.488 | SLG | 139.2% |
| OPS | 0.608 | OPS | 1.293 | OPS | 0.685 | OPS | 112.7% |
| FPPG | 1.41 | FPPG | 4.19 | FPPG | 2.78 | FPPG | 196.7% |
- He’s a platoon guy who will likely see less and less at bats with the return of Brian Roberts but his little power surge was, and still is, worth exploiting. He hasn’t really had a drastic price increase despite having hit 4 home runs in his last 7 games played with 9 RBIs.
J.B. Shuck
| J.B. Shuck | HOTTEST HITTER #3 |
 | Season | Last 14 Days | Difference | Percent Change |
| AVG | 0.288 | AVG | 0.344 | AVG | 0.056 | AVG | 19.4% |
| SLG | 0.362 | SLG | 0.438 | SLG | 0.076 | SLG | 20.9% |
| OPS | 0.690 | OPS | 0.826 | OPS | 0.136 | OPS | 19.7% |
| FPPG | 1.53 | FPPG | 3.72 | FPPG | 2.19 | FPPG | 143.6% |
- Shuck quickly became a hot DFS commodity following his 3-5 night with 4 RBI’s on Tuesday June 25th. His price followed him upward very quickly as the left hander went from bottom of the barrel to mid-range on most sites.
- He has now started every day since June 22nd his numbers are tapering off quickly. Much of the success you see here came in the first 7 days of the last 14 and you could be seeing Shuck on the coldest hitters update by the time the next article comes out. He’s just 2 for his last 16.
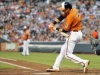
| Eric Hosmer | HOTTEST HITTER #4 |
 | Season | Last 14 Days | Difference | Percent Change |
| AVG | 0.277 | AVG | 0.304 | AVG | 0.027 | AVG | 9.7% |
| SLG | 0.412 | SLG | 0.717 | SLG | 0.306 | SLG | 74.2% |
| OPS | 0.738 | OPS | 1.051 | OPS | 0.313 | OPS | 42.4% |
| FPPG | 2.28 | FPPG | 4.45 | FPPG | 2.17 | FPPG | 95.2% |
- Hosmer is an interesting case because his recent improvement in output has come in 2 small spurts. He had a 3 day stretch from June 19-22 where he tallied 8 hits in 3 games. Then managed just one hit over his next 4 games, and now has 6 hits in his last 3 games.
- The trend here looks to me like he’s just a very risky hitter for the daily game. He is improving his consistency though, and his .303 batting average through the month of June was much better than the .269 he posted in May.
| Pedro Alvarez | HOTTEST HITTER #5 |
 | Season | Last 14 Days | Difference | Percent Change |
| AVG | 0.241 | AVG | 0.370 | AVG | 0.129 | AVG | 53.5% |
| SLG | 0.510 | SLG | 0.783 | SLG | 0.273 | SLG | 53.5% |
| OPS | 0.810 | OPS | 1.191 | OPS | 0.381 | OPS | 47.0% |
| FPPG | 2.67 | FPPG | 4.70 | FPPG | 2.03 | FPPG | 75.9% |
- Mr. Day Game caught one of his patented hot streaks and has been the backbone of the Pirates double-digit winning streak. After hitting just .180 in April and then .225 in May, he exploded to .309 in the month of June.
- It looks to me like this hot streak is on the downward slope, as he hit homers in 4 consecutive games in mid-June but has just one long ball since June 23rd. He also has 4 multi-strikeout games in that span and with Alvarez, if he’s not putting the ball in the stands he’s swinging and missing and ruining your night.
COLDEST HITTERS
| Matt Joyce | COLDEST HITTER #1 |
 | Season | Last 14 Days | Difference | Percent Change |
| AVG | 0.241 | AVG | 0.098 | AVG | -0.143 | AVG | -59.3% |
| SLG | 0.465 | SLG | 0.146 | SLG | -0.319 | SLG | -68.5% |
| OPS | 0.783 | OPS | 0.286 | OPS | -0.497 | OPS | -63.5% |
| FPPG | 2.47 | FPPG | 0.21 | FPPG | -2.25 | FPPG | -91.4% |
- Joyce seems like the classic “abandon ship” play right now. With Joyce having gone 0 for his last 17 it doesn’t appear this cold streak is coming to an end anytime soon.
- His .211 average in June was startling but the 22 strikeouts (compared to 9 in May) may have been the biggest difference for Joyce. Strikeouts usually indicate a guy that just isn’t seeing the ball well. Avoid until those numbers decrease.
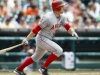
| Pablo Sandoval | COLDEST HITTER #2 |
 | Season | Last 14 Days | Difference | Percent Change |
| AVG | 0.272 | AVG | 0.120 | AVG | -0.152 | AVG | -55.9% |
| SLG | 0.396 | SLG | 0.120 | SLG | -0.276 | SLG | -69.7% |
| OPS | 0.701 | OPS | 0.305 | OPS | -0.396 | OPS | -56.5% |
| FPPG | 2.04 | FPPG | -0.07 | FPPG | -2.11 | FPPG | -103.5% |
- Poor Kung Fu Panda. If you forgot he was back on the field, he came off of the DL on June 24th and had 2 hits in his first game back. Since then he has just 1 hit in 21 ABs (including only 1 hit in a 3 game series at Coors).
- His price tag has tapered off heavily (under 3K on FanDuel) and he just doesn’t seem like a good “buy-low” candidate right now. I’d fade him until he has a couple consecutive good games and although his price might slightly increase, he’ll still be a steal at that point.
At least I can’t imagine it will ever get worse than this…

| Coco Crisp | COLDEST HITTER #3 |
 | Season | Last 14 Days | Difference | Percent Change |
| AVG | 0.274 | AVG | 0.121 | AVG | -0.153 | AVG | -55.8% |
| SLG | 0.456 | SLG | 0.212 | SLG | -0.244 | SLG | -53.5% |
| OPS | 0.819 | OPS | 0.469 | OPS | -0.350 | OPS | -42.7% |
| FPPG | 3.30 | FPPG | 1.19 | FPPG | -2.10 | FPPG | -63.8% |
- Coco might be a perfect buy low player right now as his putrid past 14 days are not indicative of a long drought. His start to the month of June was fantastic but he ended with an absolute dud. He has been hampered by nagging injuries which has played a factor for most of these players on the cold list.
- One grim sign for Crisp (and his hamstring) are the stolen base totals over the past 3 months. He had 8 in April, followed by just 3 in May and 2 in June.
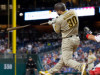
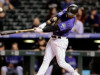
| Carlos Gonzalez | COLDEST HITTER #4 |
 | Season | Last 14 Days | Difference | Percent Change |
| AVG | 0.296 | AVG | 0.216 | AVG | -0.080 | AVG | -27.0% |
| SLG | 0.604 | SLG | 0.412 | SLG | -0.192 | SLG | -31.8% |
| OPS | 0.967 | OPS | 0.643 | OPS | -0.324 | OPS | -33.5% |
| FPPG | 4.00 | FPPG | 2.17 | FPPG | -1.83 | FPPG | -45.8% |
- The man that was the most expensive player across the board just 2 weeks ago has come back to earth, as you might expect. Since June 20th he has just 4 total extra base hits and one home run.
- This is an elite player we are talking about here, so just wait for the right matchup and buy at a reasonable price. If there’s one thing he can do it’s explode. He had a 3 HR game early in June that followed a 10-day homerless drought where he had just 2 XBH in that span.
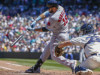
| Mitch Moreland | COLDEST HITTER #5 |
 | Season | Last 14 Days | Difference | Percent Change |
| AVG | 0.268 | AVG | 0.152 | AVG | -0.116 | AVG | -43.3% |
| SLG | 0.506 | SLG | 0.182 | SLG | -0.325 | SLG | -64.1% |
| OPS | 0.821 | OPS | 0.419 | OPS | -0.402 | OPS | -49.0% |
| FPPG | 2.28 | FPPG | 0.78 | FPPG | -1.50 | FPPG | -65.9% |
- Moreland has also been the victim of some injury issues, as he was out from June 6th to the 20th.
- He hasn’t hit a HR since coming off of the DL and has struck out at least once in all but one game.
- Right now, this is a simple wait it out play. He’s got talent and raw power but clearly isn’t 100%. Wait and see if that changes then use him at will again but until then, be wary of a Texas offense in general that has been lackluster.
