MLB Tool Analysis: Advanced Stats and Sabermetrics
If you’re reading this, then you know that RotoGrinders has some of the best free research content in the industry. The free daily tools being offered can do wonders for your bankroll. Every Thursday, I’ll be highlighting one of our free research tools and show you how to you can use it to identify players that should be on your radar.
MLB Tool Analysis: Daily Batter Hub
This week I’m going to talk a little bit about the Advanced Stats & Sabermetrics tool. This tool is a beast and I could probably write an entire series on just this tool. However, for my own sanity’s sake, I’m going to focus on the Team Stats and Splits section. This tool is great for uncovering teams that could be a sneaky stack or a good team to target with your starting pitcher.

The standard batting section gives you exactly what the title describes. Standard batting stats like total hits, runs, strikeouts, etc. The most useful stats in the standard batting section are OBP, SLG and OPS. Those are really the only stats that I use from this section.
The meat and potatoes of this section are in the advanced batting section. It provides the very useful stats like walk rate, strikeout rate, home run rate, etc.
For these examples I will be sorting by this season but you can get much more granular with last 14 days, L/R splits and H/A splits. Use these sorting features however you see fit.

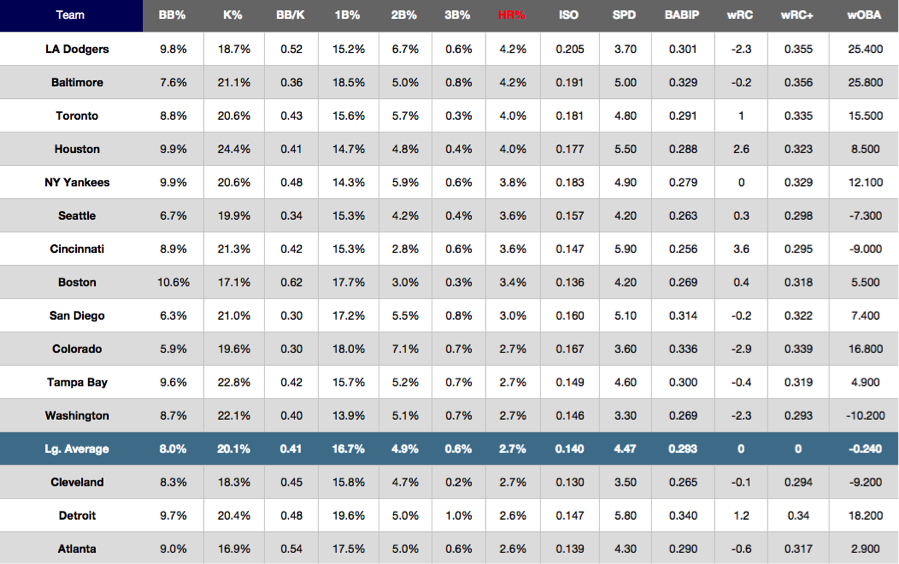
My favorite part about this tool is that when you sort a stat, it automatically shows you the league average for that stat and highlights with a blue bar. Now you are able to easily see which teams are above average and which teams are below average.
Sorting by HR , we can easily see that the Dodgers and Orioles are tied for first in the league at 4.2. This little tidbit of info could be very useful for you when building lineups. I, for one, didn’t expect the Dodgers to top this list, and I’m most of your DFS opponents didn’t either. This means you can certainly exploit this scenario for profit.
The Orioles will almost always be the more popular play for several reasons. They are an east coast team so their lineup is out sooner in most cases, and they have a much better home ballpark factor. To win tournaments, you have differentiate from the crowd, and based on HR% alone, stacking the Dodgers over the Orioles in similar matchups will almost always be contrarian.
Another thing that I like to use this tool for is teams to target with my pitcher. I’ll sort teams by K% and BB% to try to find hidden gems. It’s been common knowledge for the past few seasons that the Astros strikeout… a lot. So it’s no surprise to see them at the top of this list.

The Pirates are next in line in K%, which isn’t as common of knowledge as the Astros. Also, their BB% is a terrible 4.8%. That’s worst in the league folks. So, the second worst in strikeouts and worst in walks means that the Pirates are going up hacking… and missing. So in this scenario with the Pirates and Astros having similar matchups. I could target the pitcher facing the Pirates who will be extremely lower owned than the pitcher facing the Astros. Now, when the Astros put up six plus runs and the Pirates get shutout, I’ll be at a huge advantage and hopefully in line for a nice GPP cash.
Again, these are just examples for these stats in hypothetical scenarios. It’s how I use the stats to form my thought process. Now it’s up to you to use these stats and your own thought process to figure out what works for you in your lineup building. Hopefully, this information will help you in your quest to build a profitable lineup. Have a great weekend and check back next week as I highlight another free RG MLB research tool. As always, feel free to leave a comment or reach out to me on twitter, @Socky21