NASCAR Projections Review: Bank of America 500

Eleven of 40 drivers with mechanical issues or involved in some kind of wreck where they were unable to continue racing, and 21 pit penalties. With that out of the way, and expectations set at an appropriately low level, let’s dig into this recap thing. I’ll preface things by saying that I was unable to really watch the race yesterday, most of my attention was on the return of the GOAT, Tom Brady. I was also at my in-laws house, so I didn’t have my laptop available as a second screen, but I was watching as much as I could on the NBC app on my phone. That said, I may not have the details of the race exactly right, and with all the mayhem that happened, it’s a lot to keep up with.
A race like this brings up an interesting aspect of NASCAR scoring on DraftKings, which I will talk a little more about at the end of the recap. Because of the way the points work (fixed points for finishing position, +1 for gaining a position, -1 for losing a position, and a set number of dominator points), there is basically a set number of points available for each race, it can only fluctuate in the number of fastest lap points because they only accumulate under green flag conditions. Because of this, when there are a lot of wrecks and drivers lose a ton of points, those points have to go somewhere, and you’ll see a lot of inflated scores among the rest of the field. Whether the benefit falls on one or many drivers can vary, but generally the more guys that fall way under projection, the more guys you’ll see exceed projection.
One other note before we dig in, and I mentioned this in the subscriber chat. There were no practices after qualifying, which takes a decent chunk out of the projection model. Without those practice speeds, the model is basically forced to rely entirely on historical data, which can make things difficult. I noted that given the situation, to focus more on the graded categories, which look more at potential, and less at the actual projection number, which goes a little more in detail. That said, the craziness of the race was enough to render the lack of practice speeds pretty meaningless.
Moving on…
Find out more details about the package in the Daily Marketplace!
Finish Potential Grade
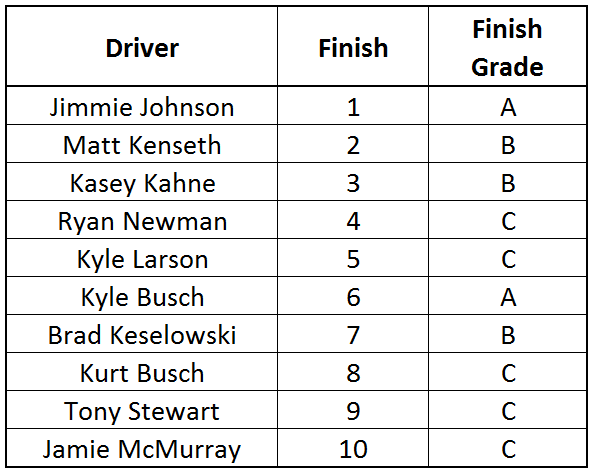
This race provides my first opportunity to say the projection model got something right that Stevie was not entirely on board with (he called Jimmie a good fade). As I mentioned last week, our finish grades roughly translate to A = Chance to Win, B = Top 5 potential, C = Top 10 potential and so on. We handed out 3 “A” grades this week, Kevin Harvick and Kyle Busch, which I don’t think surprised anyone… and Jimmie Johnson, which came across as a little bit of a sleeper, if you will. Granted, his win came at the hands of a few race leaders crashing out, but that’s NASCAR. The top 10 consisted of all “C” grades or better (top 10 potential), with the only misses being guys who wrecked, along with Carl Edwards (B,12th), Martin Truex Jr (B,13th). So while it was certainly a crazy race, with a lot of top guys finishing at the bottom, the highest grades among the survivors all finished pretty much as expected.
Mover Potential Grade
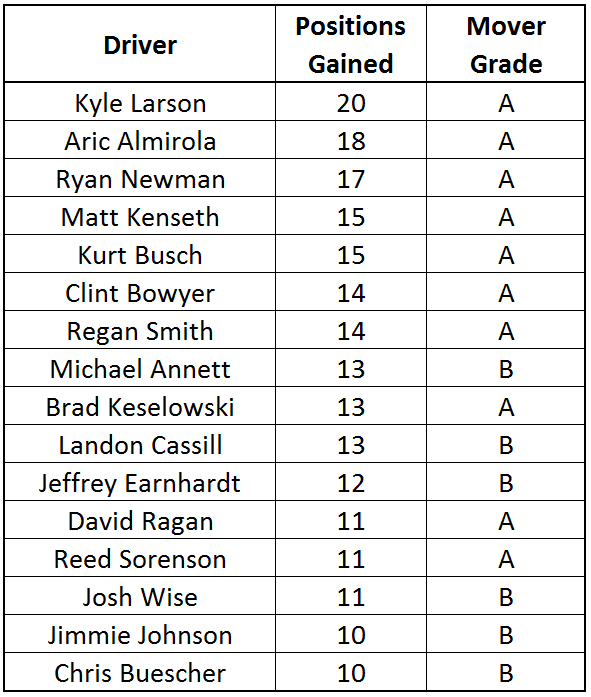
Mover points are probably the thing most affected by a race like this. Having 11 drivers crash essentially moves “last place” up to 29th place, as long as you’re able to finish the race, this almost guarantees a big boost in DK scoring for anyone that can stay clean. This is evidenced by the chart above, 16 drivers gained at least 10 spots. The way the mover potential grade is calculated (and similarly the dominator grade, which I’ll touch on in the next section), is it grades on a curve. So the top mover receives a 100, and the bottom mover receives a 0, then everyone else falls into place in the scale. This week, the model gave out 12 “A” grades and 17 “B” grades, which just means that there wasn’t a ton of separation at the top of the board. Going forward, I will tighten up the grade values if this happens again, so we get a better distribution of grades. This top-heavy grading, resulted in all 16 double-digit movers coming from an “A” or “B” grade, however, nearly 75% of the field fell into that category, so not a whole lot to brag about there. In a race like this, its much less about projecting the movers as it is just getting lucky and having drivers that finished the race, but I will certainly tighten up those grades going forward.
Dominator Potential Grade
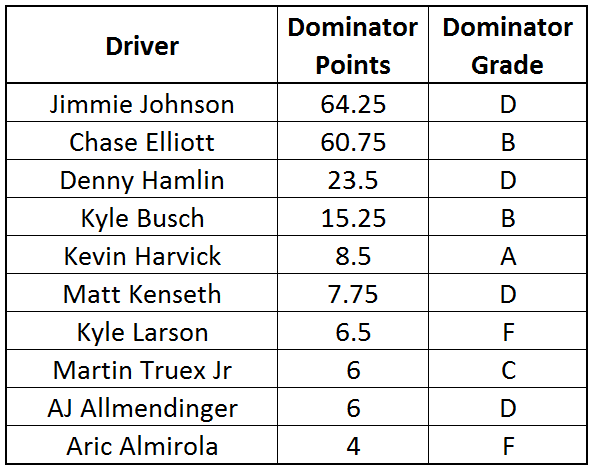
The dominator grade is scored in the same format as the movers, with a bit of an opposite result this week. Kevin Harvick was so far and away the favorite to dominate the race, that he was the lone “A” grade. With only 2 “B” grades behind him, Kyle Busch and Chase Elliott. Unfortunately, Harvick ran into some trouble early on and dropped out of the race, but Chase Elliott had taken over the lead well before that, and appeared to be the car to beat. Chase Elliott (“B” grade) and Jimmie Johnson (“D” grade) were the only true dominators this race, with Denny Hamlin (“D” grade) picking up a decent number himself. With all of the havoc in this race, these almost become a throwaway, while Chase was graded well and looked like the car to beat, Jimmie Johnson was “the guy” today with a low grade despite having one of the top finish potential grades (something that I will have to look into).
Overall Projection Results
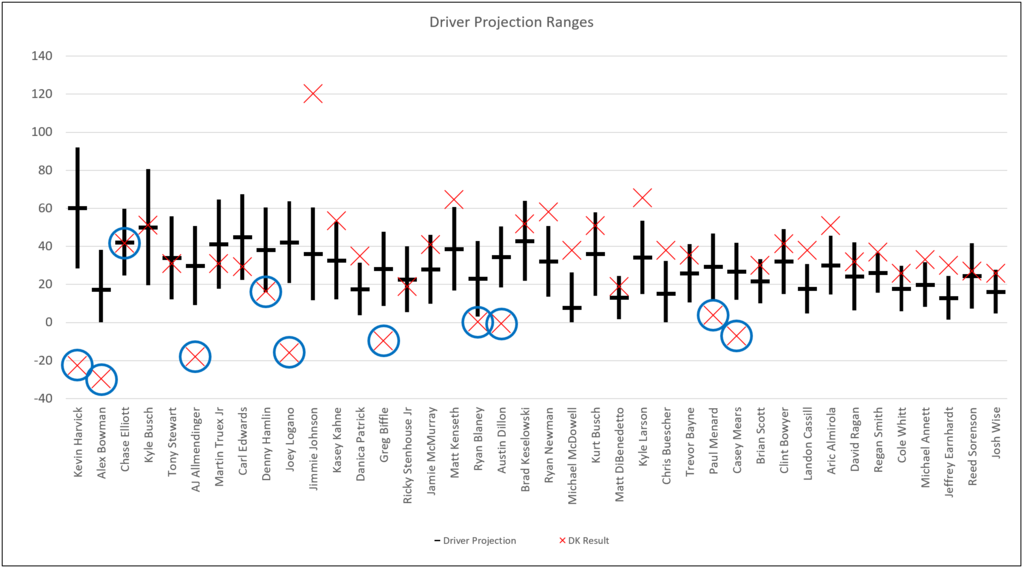
Here is the overall projection summary chart which I shared last week. To review…. black horizontal = average projection, black vertical = floor/ceiling, red X = actual DK score, and for this week blue circle = crash/car trouble. You’ll see the point that I made earlier, about many crashes and big point losses leading to big gains elsewhere, with basically any driver that had room to move up finishing well above projection. A few interesting notes… everyone that started from 16th back, that was able to stay clean, finished above their projection. Also interesting, Chase Elliott was able to basically hit his projection on the button, despite a late crash, because of the dominator points that he accumulated.
While a race like this can be infuriating, especially if you lose a few guys from your cash lineup, you have to keep in mind that everyone is playing the same field of players. Personally, I was still able to finish in the money in cash games with Kevin Harvick and Paul Menard yesterday, but even if I hadn’t I know that in other weeks there have been wrecks that I have benefited from. As long as you continuously put yourself in the best situations, you’ll be able to overcome the variance of the sport.