Sports Card Investing - Market Cap Analysis

Market Cap Analysis
The sports card market has been on fire as of late and as a result data is being generated at a furious rate. Unfortunately this momentum has picked up so quickly that our ability to capture and analyze the data is still far behind. Geoff over at SportsCardInvestor.com (use promo code ROTOGRINDERS for 20% off 1st payment on any subscription) is doing his part to collect and visualize this valuable data for us and I plan to do my best at exploring ways we can use this data to profit. One concept we have introduced over the last few weeks is the Market Cap of a player’s graded cards. In this article we will detail how exactly we are calculating this metric and some ways it may help us better understand the market.
The Calculation
Market Capitalization, also referred to as “Market Cap”, is a financial calculation that is oftentimes used in the stock market to get an idea of what the market believes a company is worth. To get to this number for a publicly traded company you would take the number of outstanding shares and multiply it by the average price of one share of stock. For example, if XYZ Inc. had 1 million shares outstanding and each share was selling at $100 then the market cap for this company would be $100 million. This information allows stock market investors to better group different companies and gauge things like risk and potential growth. It is my idea that we can do similar things using market cap while investing in sports cards.
Calculating the market cap for a stock is fairly simple given that the number of shares outstanding is publicly available and the market is so liquid that getting an accurate and up to date share price can be done in a matter of seconds. We are not as fortunate when looking at sports cards. Unless a card is serial numbered we do not know how many of a certain card has been printed. We also run into issues when determining a fair market value for a card since liquidity is not nearly as high for sports cards as it is for the stocks. That being said we still have ways to get to a ballpark number that we can analyze.
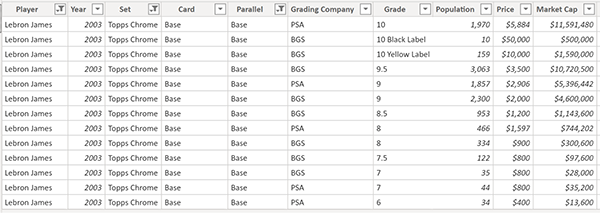
We first need to get an idea of a card’s population. To do this we can use the population reports from PSA and BGS which will let us know how many of a certain card has been graded by the grading company. Below is a snapshot of Lebron James 2003 Topps Chrome population at PSA. It is broken down by grade which will help us match the grade with the appropriate price to get the most accurate market cap.
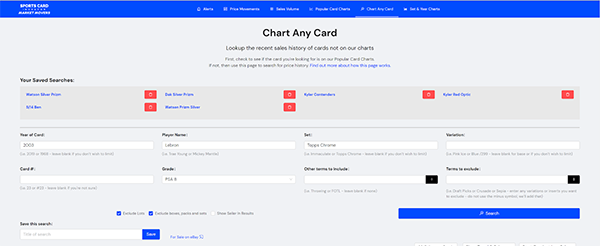
Now that we have the graded population of a card we need to determine the current market price of that card. For more popular cards we can use Sports Card Investor’s Price Movement tool to get a 7 or 14 day average price. The first image below is an example of results for Lebron James 2003 PSA 10. For less traded cards we will need to use the Chart Any Card tool and do a little digging into the results. The second set of images below is my search for a 2003 Topps Chrome PSA 8 which is not captured in the Price Movement tool.


Armed with the graded population and current market price of a card we can now calculate that card’s market cap. If we do this for as many cards as we can for a given player we can paint a decent picture of that player’s market cap. Below are a few examples of Lebron James’ rookie cards and their market caps.
Understanding a Player’s Market
2003 LeBron James Topps Chrome Link
Unlike in the stock market where a company almost always has just one type of stock you can buy, a player can have more cards than you can count in just their rookie year alone. This fact makes it very difficult to make heads and tails about how the market values each of these cards. Using market cap data we can more easily compare a player’s cards to each other.
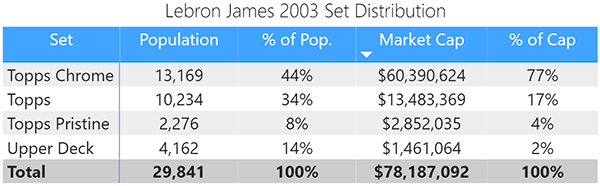
As we can see in this table at $60.4 mil Topps Chrome makes up 77% of Lebron’s rookie market cap despite only making up 44% of the population. Collectors and investors clearly value this card more than any other of Lebron’s mainstream rookie cards. This type of analysis might be even more interesting to look at for a more modern player. Is 77% a reasonable benchmark for a player’s most popular set? Is it more balanced for modern cards when multiple sets like Prizm, Optic, and Select co-exist? These are the types of questions we can answer with more robust market cap data.
You can also see in the table that Upper Deck makes up only 2% of the market cap despite making up 14% of the population. The regular Topps set has a much bigger print run making up 34% of the population however maintains a greater proportion of the market cap relative to the population at 17%. Could this mean that brand loyalty to Topps means more to collectors and investors than does the rarity of the Upper Deck cards? We would need more than a sample size of one player to confirm this but if so it would be a supporting argument for Prizm maintaining its superiority in the market despite increased population counts.
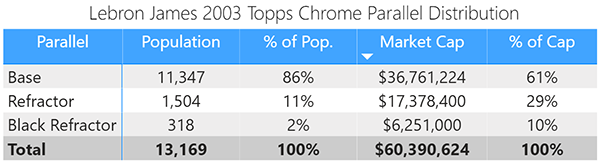
We can also use this data to compare different parallels within the same set or potentially across multiple sets. The table above shows population and market cap for the three versions of Lebron’s 2003 Topps Chrome set. Despite making up 86% of the population the base card only makes up 61% of the market share. Alternatively the refractor has a market cap that is more than twice as large as its population and the black refractor tops that with a market cap five times its population. Do these trends hold true for Dwyane Wade who was also a rookie in 2003? If not can we use that information to find out which of his parallels are undervalued and may provide a good long-term return? What does this distribution look like for modern sets that have an infinite amount of parallels? Again this information creates more questions than it does answers but it is necessary if we want to fully understand how these markets behave.

Another way to use this data is to compare different grades to better understand how the market values them relative to each other. Clearly 10’s are king as no other grades have a market cap percentage that is higher than their population. We can also see a hierarchy take shape within this data. If we were to look at their market caps relative to population we would see a top to bottom hierarchy that looks something like BGS 10’s , PSA 10, BGS 9.5, PSA 9, and BGS 9. What is striking to me is how common PSA 10s are. There are more PSA 10s than there are BGS 9.5 and six times more PSA perfect scores then BGS. The 9 population for both companies is very similar so my guess is if PSA had a 9.5 score a lot of them would come out of the 10 population. This would explain why BGS 10s are so much more valuable and while a 9.5 at BGS will fetch you a similar return as a PSA 10.
The insight we can gain for a player and their cards is not limited to the concepts above but these are the ones I think we could benefit the most from. A player like Lebron sees his cards traded more than most players so I would assume his market is about as efficient as they can be. This may not be the case for other players and if we had their market cap data to look at I believe there might be some profit to be made.
Understanding a Player’s Market Relative to Peers
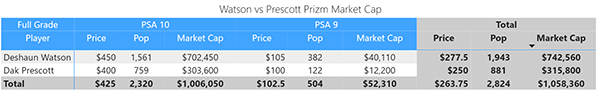
On last week’s show we talked about Dak Prescott’s current card prices and whether or not we felt like there was room to appreciate considering his post draft runup. To do this we compared his Prizm rookie market cap to a similar QB in Deshaun Watson. We can dig into that even more here using the data above. Only looking at their card prices the two QBs seem to be valued at similar levels. When we factor in Dak Prescott’s much more limited population we get a different story. At $315,000 Dak’s market cap is less than half of Deshaun Watson’s. With only 881 total PSA graded cards getting PSA ownership for the Cowboy is much more difficult. It is important to note that there is no rule that the two QBs have to have the same market cap since they are similar QBs. This does however allow us to gauge the amount of potential risk and return of investing in each player. Considering Dak’s market cap is so much smaller than Watson we can assume that there is some potential for ROI if he has a good season and while risk does exist anytime you invest in a player, the risk is much more limited then if the two QBs were already evenly valued from a market cap perspective. For example how much riskier would this picture look if Dak’s market cap was even with Lebron’s $78 mil? That of course is an unrealistic example but it helps highlight the point nonetheless.
As the market continues its rocket ship trajectory we will have more and more data to analyze. With the help of tools like the ones at SportsCardInvestor.com we can start to pull valuable insights from this data that will hopefully lead us to profitable investments. In future articles we will compare more players to each other and talk about more ways we can analyze this data. For Market Movers data, be sure to subscribe to SportsCardInvestor.com and use promo code ROTOGRINDERS for 20% off 1st payment on any subscription.