U.S. Open: Ownership Percentage Analysis


The U.S. Open is off and running at Chambers Bay in University Park, Washington, where 156 golfers are vying for the title in the second major championship of the season. That means it’s time for DraftKings to crown a second PGA millionaire of the season after brettmarino’s single entry took down the big prize in April.
DraftKings had no trouble filling the $2.5M Millionaire Maker even after reducing the maximum number of entries from 999 to 500. A total of 53,482 players submitted 143,125 entries for a shot at the $1 million first place prize. PGA continues to gain in popularity as a DFS sport, as this tournament saw a 9% increase in the number of players and a 14% increase in the number of entries compared to the Millionaire Maker for the Masters.
Twelve players submitted the maximum 500 entries, while 35,806 (67% of the field) players will try to channel their inner brettmarino and take home the top prize with a single entry. Some players decided they didn’t want a shot at a million dollars and failed to submit a lineup for 1,590 entries (1.1% of the field).
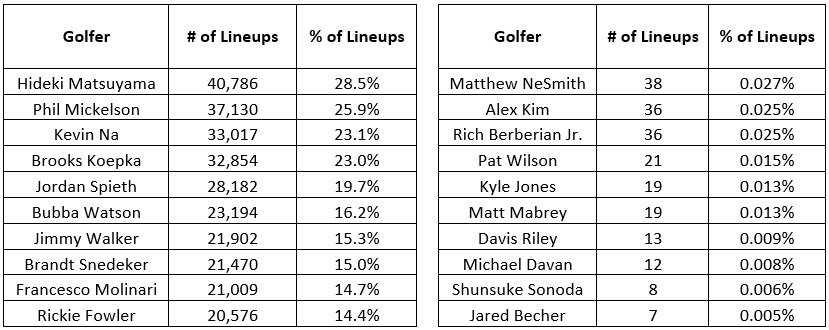
Now let’s take a look at the lineups. Below are the 10 most popular and least popular players chosen.
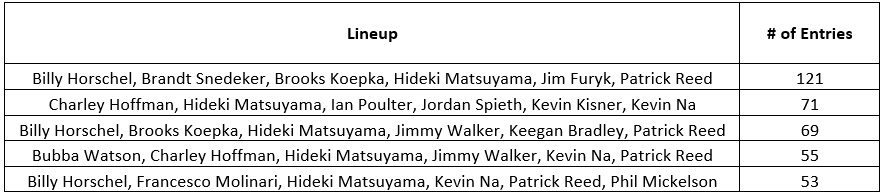
There are 115,426 unique lineups with 12,631 (10.9%) lineups used at least twice. Below are the five most popular lineups in the field.
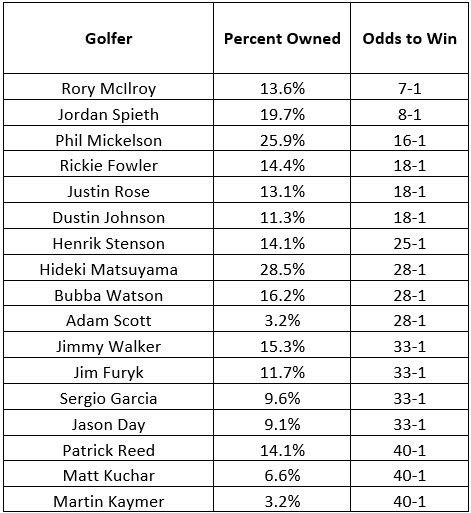
Finally, let’s take a look at ownership percentages compared to pre-tournament odds to win the championship.
Stay tuned for another update following the tournament, where we’ll look at single vs. multi-entry, ROI, and any other interesting data we come across along the way.