NBA Stat Variance

In constructing my NBA lineups, I heavily use projections, as do many top daily fantasy sports players. Projections estimate the average production to be expected from a player on any given day, and they sometimes do a pretty decent job at it. Until now, however, I have never seen data around the variance to be expected around projections. This piece is my attempt to analyze the variance of each category of fantasy points in the NBA and how this should affect our strategy as DFS players.
To help me in this analysis, I obtained box score data for every player in every game of the 2012-2013 season. I limited my analysis to players that averaged at least 25 minutes per game. These players generally represent the pool that DFS players choose from each night. Conveniently, the total number of players came to 167, which is just a bit more than a starting five for each team.
Using this data, I calculated what each player averaged across all relevant statistics (points, rebounds, assists, steals, blocks, and turnovers) throughout the season. This allowed me to calculate fantasy points, and I used FanDuel scoring in doing so. For each and every game for every player in my dataset, I then calculated how their performance in these categories differed from their season projection. Doing so allowed me to make cool graphs like below.
POINTS HISTOGRAM
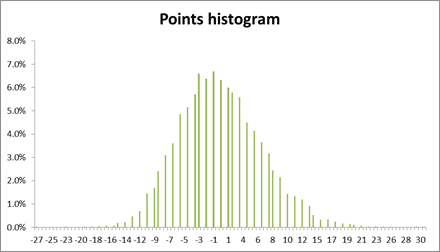
That is the distribution of points scored above or below average for each player in every game, with frequency on the vertical axis. It is important to remember that zero is each player’s individual average. Obviously “”(player-popup)Kevin Durant”:/players/kevin-durant-1348(player-profile)”:/players/Kevin_Durant-1348 scores more points than “”(player-popup)Jimmy Butler”:/players/jimmy-butler-13327(player-profile)”:/players/Jimmy_Butler-13327, but we do not care about that. We care about how often and by how much “”(player-popup)Kevin Durant”:/players/kevin-durant-1348(player-profile)”:/players/Kevin_Durant-1348 and “”(player-popup)Jimmy Butler”:/players/jimmy-butler-13327(player-profile)”:/players/Jimmy_Butler-13327 deviate from their expectation on any given day. Therefore, it was necessary to normalize the data around each player’s seasonal average.
You can see that the distribution is very symmetric, with an almost equal probability of a player overachieving or underachieving in any one game. To get a sense of magnitude of deviations, I calculated the stats below.
This tells us that roughly 50% of the time a player will score between -4.3 and +3.9 points from their average. So for example, if we are projection “”(player-popup)LeBron James”:/players/lebron-james-1227(player-profile)”:/players/LeBron_James-1227 to score 25 points on any given night, we can say that 50% of the time he will score between 20.7 and 28.9.
I continued this approach with all the other statistics.
REBOUNDS HISTOGRAM
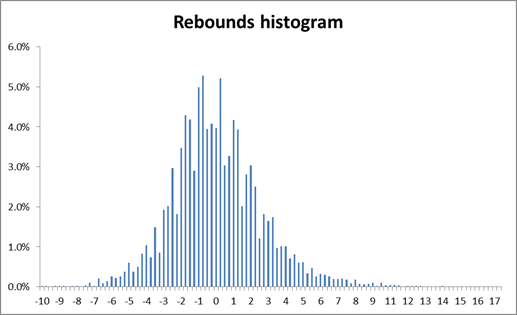
- Standard Deviation – 2.8
- 25th Percentile – (-1.8)
- 50th Percentile – (-.2)
- 75th Percentile – 1.5
Rebounding is also fairly symmetric, although the curve is definitely less smooth than that from the points graph. One thing to note on this graph (and most others) is that the distribution is slightly skewed to the right. This is simply because there is a lower limit on zero on all statistics with no positive limit. We do see from time to time 50-point games and 25-point rebounding games that are greatly above average. However, it is never possible to underachieve by this type of magnitude.
ASSISTS HISTOGRAM
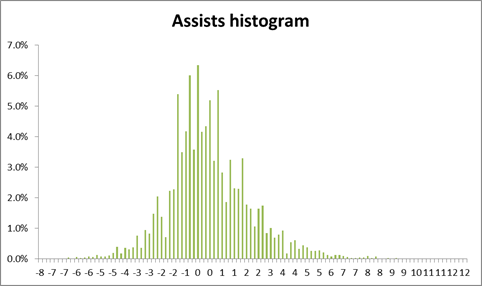
- Standard Deviation – 2.0
- 25th Percentile – (-1.2)
- 50th Percentile – (-.2)
- 75th Percentile – 1.0
BLOCKS HISTOGRAM
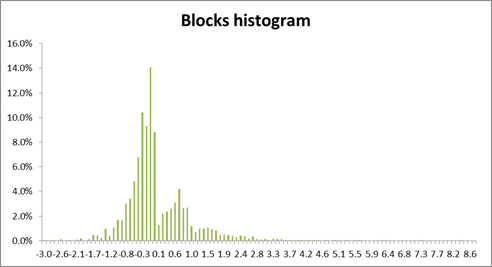
- Standard Deviation – 0.9
- 25th Percentile – (-0.5)
- 50th Percentile – (-.2)
- 75th Percentile – .4
The blocks distribution has by far the strangest distribution of all, with a large spike at around -0.2 blocks. I conjecture that this is because most guards average around 0.2 blocks per game and their most likely outcome for any one game is that they record no blocks. I believe that this finding has implications for GPP strategy. Because the distribution is so right-skewed, it may make sense in tournaments to pay for players that contribute a disproportionate amount of their fantasy value from blocks since they vary a lot and a player can outperform his season averages in this department to a large degree. As an example, take a look at someone like “”(player-popup)Roy Hibbert”:/players/roy-hibbert-1488(player-profile)”:/players/Roy_Hibbert-1488’s game logs. While he average something like three blocks per game, it is not uncommon to see games of six, seven, or eight blocks. Doubling or nearly tripling a season average in one category (especially when that category gets two fantasy points) is valuable in tournaments and is something that is not common in other categories such as points.
STEALS HISTOGRAM
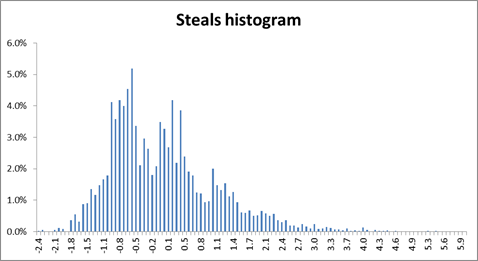
- Standard Deviation – 1.1
- 25th Percentile – (-.8)
- 50th Percentile – (-.2)
- 75th Percentile – 0.5
Similar to blocks, steals have a weird skewness as well. I think the same implications may apply here. Since steals and blocks are much less common than points and rebounds, it makes sense that the variance of these categories is much larger. Thus, it might make sense to pay for players who can achieve big upside relative to their projection in these categories.
Finally, take a look at turnovers:
TURNOVERS HISTOGRAM
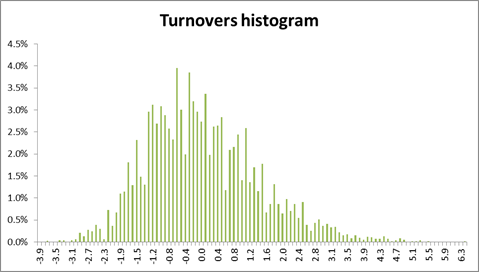
- Standard Deviation – 1.4
- 25th Percentile – (-1.0)
- 50th Percentile – (-.2)
- 75th Percentile – 0.8
It’s not the same type of distribution as points, but interesting, turnovers seem to be a lot more predictable than stats like blocks or steals in a given night.