Daily Pitcher Breakdown: May 6th, 2013

Welcome to the Daily Pitcher Breakdown. I will focus on the top selections of the day and give you a breakdown on why they are set up for success against their given opponent. Sometimes there will be a best of the rest section featuring guys who are likely low-dollar options with some upside for those of you who prefer to load your lineup with hitting studs.
There will also be a contingent of the starters that you can ignore each day. They offer no discernible upside so they aren’t worth your time. Because it is baseball and a 162-game season, there are going to be times when guys from the ignore group go off, but we’re dealing with probabilities in the daily game so the goal is to give yourself the best odds for success, not find needle in the proverbial haystack that finally doesn’t poke you.
LEGEND
Stats Shown in Red Are BELOW AVERAGE
Stats Shown in White are AVERAGE
Stats Shown in Green Are ABOVE AVERAGE
Stats Shown in Blue Are ELITE
For a description of each stat below and the tiers used for them, check out this pop up window FAQ Page by clicking here
Performance and Talent Statistics: May 6th, 2013
| PLAYER | PERFORMANCE | TALENT | |||||||||
| PITCHER | TM | IP | ERA | SIERA | WHIP | GEM% | IMP% | K% | BB% | HR/9 | G/F |
|---|---|---|---|---|---|---|---|---|---|---|---|
| Maholm | ATL | 38 | 3.08 | 3.75 | 1.08 | 50.0% | 17.0% | 20.7% | 8.4% | 0.47 | 2.00 |
| Arroyo | CIN | 41 | 3.95 | 4.59 | 1.07 | 50.0% | 17.0% | 11.0% | 3.1% | 1.10 | 1.20 |
| Parker | OAK | 29.1 | 7.36 | 5.30 | 2.01 | 17.0% | 33.0% | 12.4% | 11.0% | 1.23 | 1.35 |
| Jimenez | CLE | 24 | 7.13 | 4.66 | 1.33 | 40.0% | 40.0% | 19.2% | 13.1% | 1.50 | 1.70 |
| Tepesch | TEX | 28 | 3.54 | 3.66 | 1.18 | 40.0% | 20.0% | 15.8% | 4.4% | 1.29 | 2.08 |
| Feldman | CHC | 29.2 | 3.34 | 4.30 | 1.28 | 40.0% | 0.0% | 18.3% | 9.9% | 1.52 | 1.62 |
| Worley | MIN | 28.2 | 7.22 | 4.48 | 1.92 | 17.0% | 33.0% | 12.5% | 6.6% | 1.26 | 1.77 |
| Buchholz | BOS | 44.2 | 1.01 | 3.25 | 0.96 | 100.0% | 0.0% | 27.8% | 9.5% | 0.20 | 1.56 |
| Buehrle | TOR | 35 | 6.43 | 4.76 | 1.51 | 33.0% | 66.0% | 12.6% | 5.7% | 2.31 | 1.00 |
| Hellickson | TBR | 36.1 | 4.71 | 3.88 | 1.21 | 33.0% | 33.0% | 21.1% | 7.5% | 1.49 | 1.02 |
| Cahill | ARI | 38 | 2.84 | 3.75 | 1.13 | 33.0% | 0.0% | 20.4% | 8.3% | 0.47 | 1.97 |
| Capuano | LAD | 4.2 | 9.64 | 4.21 | 2.14 | 0.0% | 100.0% | 16.7% | 12.5% | 0.00 | 4.50 |
| LeBlanc | MIA | 30.1 | 6.23 | 4.50 | 1.71 | 17.0% | 17.0% | 15.7% | 6.4% | 1.48 | 0.85 |
| Cashner | SDP | 23.1 | 4.24 | 4.26 | 1.37 | 33.0% | 0.0% | 20.2% | 12.1% | 0.77 | 1.59 |
| Lee | PHI | 41.2 | 3.46 | 3.76 | 1.15 | 50.0% | 16.7% | 19.7% | 4.1% | 0.65 | 0.84 |
| Bumgarner | SFG | 40.2 | 1.55 | 3.34 | 0.84 | 83.3% | 0.0% | 23.7% | 5.9% | 0.66 | 1.24 |
________________________________________________________________________________________________________
Here is a look at the day’s slate of arms and how they might stack in their given matchups.
THE CREAM OF THE CROP:

Madison Bumgarner, SF (v. PHI) – When you are wondering how a team might matchup against a team, there is a go-to stat to look at it. Sure, you want to see how the team does against lefties, but more importantly you are going to want to know how they do against sliders. The slider is his bread, butter, and most of his entrée. He throws it 34% of the time – tops among starters in the NL – and opponents have managed a mere 511 OPS off of the pitch while striking out 28% of the time. Philly is 29th in the league against lefties with a bit more success against sliders slotting 21st, though they do strike out 48% of the time against the pitch. Over the last three years, both Ryan Howard (559) and Chase Utley (596) have sub-600 OPS totals against lefty sliders.
Of course boiling Bummy (work-shopping this nickname, just go with it) down to a slider overlooks the rest of his arsenal, especially his fastball. He throws 90-93 MPH – not overwhelming velocity, but good from the left side – and generates the second-best results for a lefty starter yielding a 481 OPS. He also gets a strikeout on 27% of the plate appearances that end with a heater and has a league-best (for lefties) 7.0 K/BB ratio with the pitch.
Cliff Lee, PHI (at SF) – Remember the last time Lee faced the Giants? We could get that again tonight with Lee and Bummy. The Giants are only two spots ahead of the Phillies against lefties with a 629 OPS so Lee should be able to have his way with this lineup. Lee’s strength also blends well with weakness of this Giants lineup against lefties: he doesn’t give up walks and they don’t have any interest in drawing them anyway. Their 4.7% walk rate is lowest in the league against lefties and Lee’s 4.1% walk rate is 11th in baseball. He hasn’t been over 4.6% since 2007. He just doesn’t get beat with free passes.
There is dispute at the pitch tracking sites of whether Lee throws a slider or cutter since they behave similarly, but what isn’t disputed is that he dominates with the pitch. He’s allowed just a 514 OPS with the pitch while also netting 10 of his 34 strikeouts. He also has a changeup and curveball he can go to, though usage of the latter has been dropping of late, sitting at 6.6% so far this year. Lee’s array of pitches can beat hitters in so many different ways that even when he’s struggling a bit he seems to be in total control.
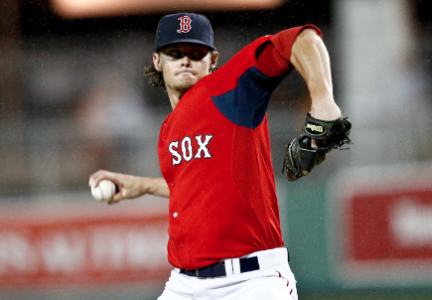
Clay Buchholz, BOS(v. MIN) – Speaking of total control, Buchholz has steamrolled the competition so far this year leading to an MLB-best 1.01 ERA and six wins. In fact, he’s been so good that he’s been accused of cheating by way of doctoring the baseball. The Toronto announcing team suggested, or rather outright declared as much after he dominated their club for seven shutout innings with eight strikeouts and just five base runners allowed.
By batting average, his worst pitch has been the curveball which is allowing a whopping .222 average. By OPS, it’s the fastball which is just getting “killed” to the tune of a 574. He’s also generating strikeouts with all of his pitches leaving hitters nowhere to gain even a slight edge against him. In come the 25th-ranked Twins with a 681 OPS and it’s hard to mount a case for them getting to Buchholz tonight. This whole cheating “scandal” will be front and center, though, as several cameras will be trained on his arm which apparently houses the magical concoction driving his success and you better believe that if he does falter against the Twins, those who have accused him will be feel entirely vindicated.
Trevor Cahill, ARI (at LAD) – Sinkers, sinkers, and more sinkers. Cahill is one of the preeminent worm burners in the league as evidenced by his consistently elite groundball rate and these Dodgers are one of the best matchups for him as they hit an NL-worst 514 OPS against sinkers (third-worst in MLB). Some of that comes from Cahill himself who dropped 7.3 shutout innings on the team back on April 14th on six hits and zero walks with four strikeouts. If there’s one crack in the armor for Cahill, it’s that his walk rate can get high, run up his pitch counts, and take him out of games early.
Two outings ago against, he only allowed one run through five, but walked four saddling him with a 105 pitches and ending a good night before it could become a great one. Conversely, when he isn’t doling out free passes and the groundballs are being turned into outs in short order he can breeze through an outing as he did in his most recent outing against the Giants, completing eight innings with just 88 pitches. He managed to avoid the walk in that last outing against the Dodgers and he’ll have his work cut out for him to repeat that feat as they have the fourth-best walk rate in baseball against right-handers at an even 10%. Cahill is often underrated so look for him to be a bargain compared to the field tonight.
BEST THE REST:
Andrew Cashner, SD (v. MIA) – Cashner let us down last time out giving four runs in four innings against the Cubs, his former team. His command was off as he walked four and hit another batter while also giving up six hits. That he had just one strikeout is most telling about how off he was that night. He gets a shot to rebound against baseball’s worst team (don’t tell Roy Halladay, though). The Marlins has a pathetic 613 OPS against righties, 34 points worse than the Dodgers. Add to that the fact that they are playing in a pitcher’s park like Petco and they could struggle to get on the board tonight. Cashner is still building up his endurance so he may be limited to six innings even he is rolling. Combine that with his lack of a thick track record and that’s why he only finds himself in this tier as opposed to the cream of the crop.
Paul Maholm, ATL (v. CIN) – He rebounded nicely after his implosion against the Tigers as he held the Nationals to just two runs over eight innings giving up three hits and two walks while fanning four. Since he doesn’t have a significant track record of high-level success, many believed it was the beginning of the end with that rough outing as opposed to just a regular ol’ tough start that everyone goes through at least a couple times a year. The Reds have had some early success against lefties despite three of their four best hitters being southpaws, too: Shin-Soo Choo, Joey Votto, and Jay Bruce. Votto (947 OPS) and Bruce (869) have more than held their own while Choo (591) has had his troubles with same-siders.
Bruce can beat on the inner third. However, Maholm can’t make a mistake and leave something middle in as that’s Bruce’s happy zone. It’s a fine balance. Maholm can be up or down on the inner third, but anything in the middle is likely being deposited as a souvenir. The gameplan against Votto is to simply surrender because he’s amazing. Joking aside, lefties have really only had success working outside the zone. If you do come in the zone, you better stay up and outside. If you imagine the strikezone as nine boxes (in, middle, out; up, middle, down), Votto has a hot zone in seven of the nine meaning he hits better than .350 in them since 2011. Only middle-out and up-out have been weaknesses (hitting under .225 in both, again data is since 2011). Watch those key matchups as those two will be Maholm’s biggest challenges.
Watch out for rain in this one, too.
USE CAUTION:
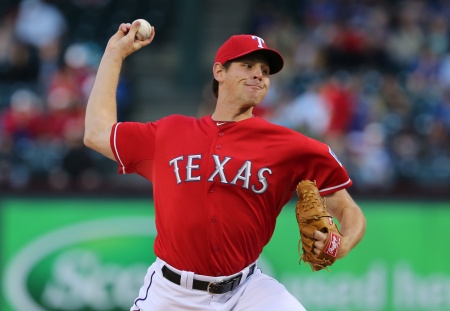
Nick Tepesch, TEX (at CHC) – There is still a bit of a smoke & mirrors vibe going on with Tepesch. Sure, I can see him as a league average arm, but he’s been well above to date despite a modest strikeout rate (16%) and trouble home run rate (1.3 HR/9). The Cubs aren’t exactly world beaters, though, so he could definitely stay hot against them. They also don’t fare well against breaking pitches from righties hitting just .168 with a 472 OPS on curves & sliders from the right side. Not a bad play, but understand the risk you’re assuming with a mediocre talent.
Chris Capuano, LAD (v. ARI) – Slated to return from injury tonight, Capuano gets a good matchup facing a Diamondbacks team that has a 631 OPS against lefties, good for 26th in baseball. I’m a little cautious because you never know how guys will fare in their initial start after an injury. Plus some sites might not even have him available to pick, instead still listing the original probable starter, Josh Beckett.
Jeremy Hellickson, TB (at TOR) – He simply hasn’t pitched well enough to be trusted implicitly this year. His prices suggest he has though, which is why I’d practice some caution before diving in with him. What’s weird is that his strikeout rate has surged from 17% to 21% and his walk rate is down a half-percentage point to 7.5%, but he’s allowing homers at a crazy 1.5 HR/9 rate. That could be exacerbated in the launching pad that is Rogers Centre and that’s why I’m not eager to play him here.
Jarrod Parker, OAK (at CLE) – He’s pitched better in two of his last three, but he faces a very tough Cleveland so I think you’re better off letting this one ride out and perhaps using him later this week in Seattle. Most damning for Parker tonight: Cleveland leads baseball with a 1164 OPS against righty changeups – his best pitch. Maybe he gets the best of them with it, but it’s not a risk I’m willing to take.
YOU CAN SAFELY IGNORE:
- Scott Feldman, CHC
- Bronson Arroyo, CIN
- Wade LeBlanc, MIA
- Vance Worley, MIN
- Mark Buehrle, TOR
- Ubaldo Jimenez, CLE
_________________________________________________________________________________________________
Pitcher Park Factors: May 6th
| PITCHER | TEAM | PARK | RUNS | HR | HITS | PARK-LHB | PARK-RHB |
|---|---|---|---|---|---|---|---|
| Maholm | ATL | Great American Ball Park | 1.005 | 1.472 | 1.014 | 0.976 | 0.934 |
| Arroyo | CIN | Great American Ball Park | 1.005 | 1.472 | 1.014 | 0.976 | 0.934 |
| Parker | OAK | Progressive Field | 1.123 | 1.119 | 1.066 | 1.107 | 1.038 |
| Jimenez | CLE | Progressive Field | 1.123 | 1.119 | 1.066 | 1.107 | 1.038 |
| Tepesch | TEX | Wrigley Field | 1.604 | 0.923 | 1.403 | 1.084 | 1.074 |
| Feldman | CHC | Wrigley Field | 1.604 | 0.923 | 1.403 | 1.084 | 1.074 |
| Worley | MIN | Fenway Park | 0.907 | 0.758 | 0.847 | 0.954 | 1.008 |
| Buchholz | BOS | Fenway Park | 0.907 | 0.758 | 0.847 | 0.954 | 1.008 |
| Buehrle | TOR | Tropicana Field | 0.886 | 0.762 | 0.917 | 0.927 | 0.954 |
| Hellickson | TBR | Tropicana Field | 0.886 | 0.762 | 0.917 | 0.927 | 0.954 |
| Cahill | ARI | Dodger Stadium | 1.001 | 1.032 | 0.953 | 0.993 | 0.891 |
| Capuano | LAD | Dodger Stadium | 1.001 | 1.032 | 0.953 | 0.993 | 0.891 |
| LeBlanc | MIA | Petco Park | 1.024 | 1.108 | 1.062 | 1.140 | 0.938 |
| Cashner | SDP | Petco Park | 1.024 | 1.108 | 1.062 | 1.140 | 0.938 |
| Lee | PHI | AT&T Park | 0.812 | 0.547 | 0.971 | 0.957 | 0.963 |
| Bumgarner | SFG | AT&T Park | 0.812 | 0.547 | 0.971 | 0.957 | 0.963 |