DraftKings Milly Maker: Masters Lineup Analysis

Masters weeks is upon us again, and truth be told, I only really follow golf during the four majors. That being said, I do have a passion for doing data analysis, and particularly data analysis on fantasy sports. Oh, and winning and millions dollars; that would be a nice too.
Having helped Dan put together this article last year, I would like to think of this article that you are reading as a corollary, or amendment to the original. In fact, as the data will show, many of the conclusions that we were able to reach last year still hold true today.
Before we get into trying to make sure you maximize your return potential, let’s start by looking at some interesting statistics:
• The tournament fell short of filling with only 205,732 of a possible 229,885. Overlay chasers should note that this does not mean that there was technically overlay in the contest. DraftKings still brought in $4.1M Dollars and will pay out $4M.
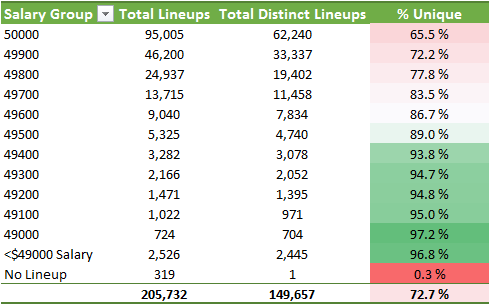
• Overall, there were 205,732 entries and 149,657 unique lineups. This means that only 72.7% of all lineups were unique.
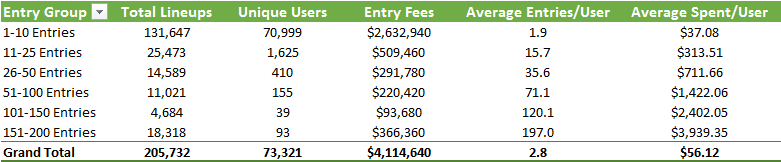
• In total, there were 73,321 users that entered the tournament meaning that on average the normal user entered 2.8 lineups and spent $56 dollars on this tournament.
• 80 users entered 200 lineups, the max allowed in this format.
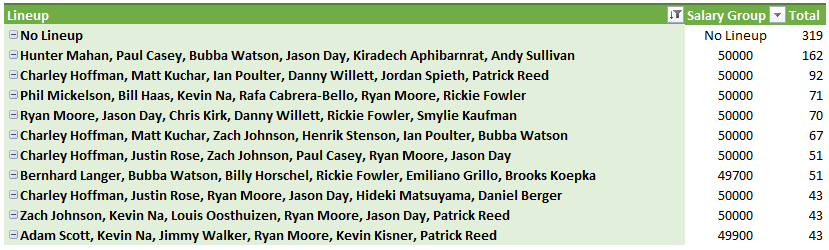
• 319 people entered the tournament but forgot/didn’t enter a lineup!
• The next most-used lineup was entered 162 times!
Below are some of these statistics laid out by different segments of user groups.
Now let’s get to the part where I attempt to help try to give you a leg up on the competition. Due to the top-heavy payout, if you want a chance at million dollars or another large payday you have to make sure you create a lineup that is unique. As stated above only 72.7% of lineups were unique. Luckily, it looks like there are a couple of things that help increase that chance.
Leaving salary on the table is still one of the best way to ensure that you have a unique lineup and this year’s Master’s is no different. In fact, the trend might actually be more pronounced this year. Lineups that used all of the salary available only have a 65.5% chance of being unique. By leaving $500-$1,000 dollars remaining, you can significantly increase your chance of being unique to 89% – 98%. See Below.
This holds true when you look at the top 10 most used lineups as eight of the top 10 most used lineups used all $50,000 dollars.
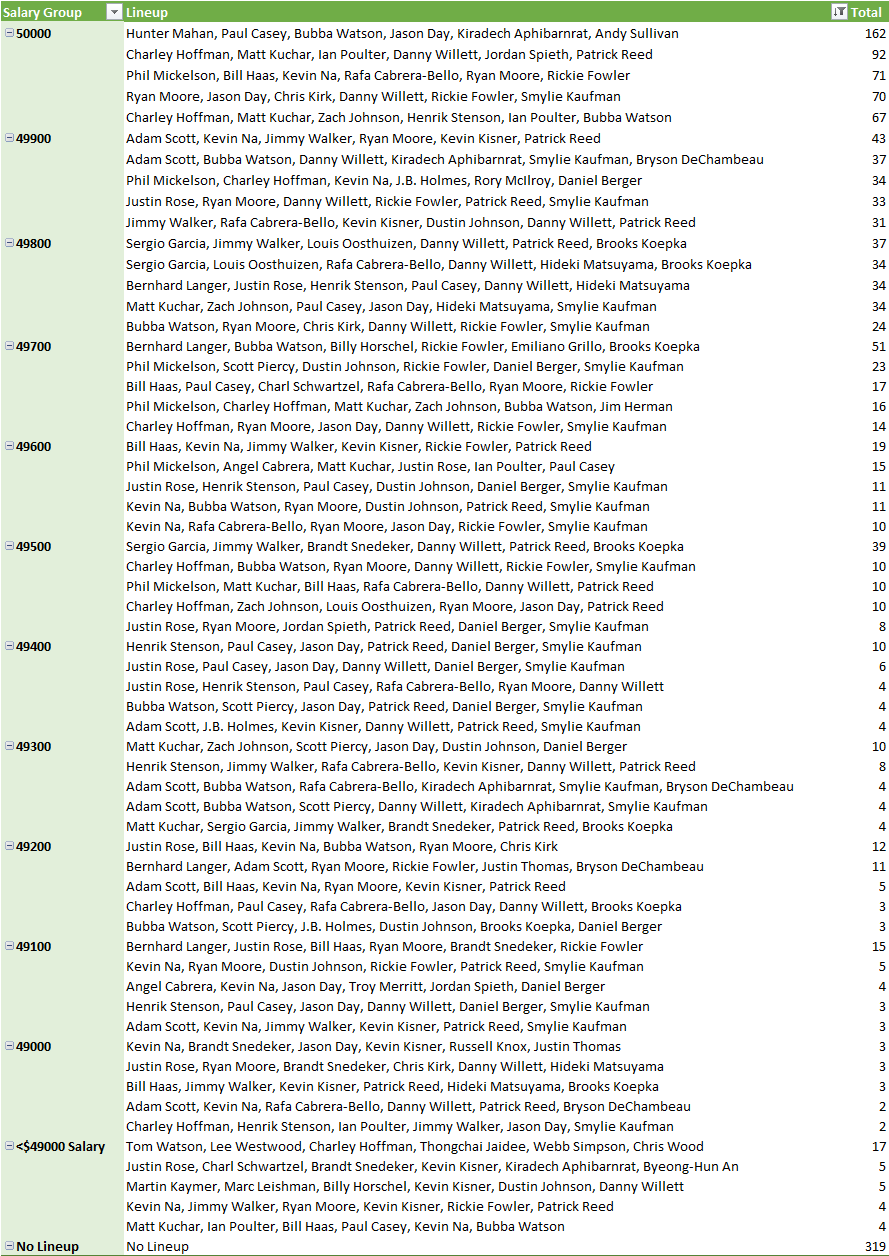
Leaving salary on the table also helps in the event that you do end up with a duplicate lineup as the more salary you leave, the less users you can expect to share your lineup. For example, the top five duplicate lineups that used all $50,000 dollars were entered 462 times and the top five duplicate lineups that used $49,000 were only entered 13 times.
Top 5 Most Used Lineups by Salary Used:
If anyone would like to check to their own lineups, feel free to follow this link and enter your username in cell C2 (this might take a little bit as the file contains a large amount of data). This should update the pivot table and tell you how many times each lineup that you entered was used. You may also reach out to me on twitter @nicks523 and I would be happy to look up the combination for you.
Additionally, if anyone can think of any other metrics that could be of assistance, feel free to reach out to me and I will do my best to create more metrics.