Risers and Fallers: Volume 1
![]()
It’s been a very busy first few weeks of the MLB season, but I’m excited to finally be bringing back Risers & Fallers!
For those who read last year, each week I’ll break down a handful of players using advanced metrics, my DFS projection system (THE BAT, available in the RotoGrinders Marketplace), and insights from my scouting background. I’ll examine guys whose stock is going up, guys whose stock is going down, guys who are perpetually underpriced or overpriced, guys who are worth paying a premium for, or guys who are just interesting and warrant some analysis on.
Rising… and Rising… and Rising Some More
Alex Wood, SP, Los Angeles Dodgers
Hold your arms out an embrace MLB’s newest ace! Yes, I’m serious. I’ve been touting Wood as one of the most underrated pitchers in baseball for the last year and a half, and he still is. It’s just that now, instead of being an underrated top 30 or 40 pitcher, he’s an underrated top 5 or 10 pitcher. Probably closer to 5.
Wood was once a top prospect for the Braves, but his velocity fell off, his stuff diminished, he toyed with his release point and place on the rubber, he was traded, he dealt with a number of injuries… basically he was all over the place. This year? He’s back. Look at these numbers and the accompanying velocity:

Wood has always had good control, he’s always gotten groundballs, and now he’s getting the whiffs to make him elite. His velocity is up a mile and a half from 2016 and more than three mph from 2015. (Changes in velocity like this are now incorporated into THE BAT, FYI).

But he’s not just about the velocity. No, what makes Wood effective is a plus change-up and a plus-plus curveball—both of which are made even better by the added fastball velocity this year. Wood’s curve is insane, grading out as one of the ten best of any starting pitcher in baseball last year*.
*This winter I began developing a system to quantify pitcher “stuff.” I’m not talking about surface stats like swinging strikes or hard contact, I’m talking about the physical characteristics of the pitches, scouting-level qualities. Velocity. Movement. Spin. Tilt. Late Break. Tunneling. Interactions between pitches. I analyzed what is important for each type of pitch and whose pitches are the most effective as a result. This isn’t built into THE BAT yet, but I plan to in the future.
Not only is Wood’s curve one of the fastest in baseball at 83 mph (an extremely important variable for curves), but he hides it very well… a concept that’s come to be known as “tunneling”. Below is a side-view of the trajectory of both Wood’s fastball and curveball and those of John Lamb, who has one of the worst curves in baseball (both from 2016).

Notice anything different between the two? Hitters can see Lamb’s curve coming a mile away, but for Wood, it comes out of the same release point and looks almost exactly like his fastball for 80% of the trajectory and then falls off the table. Hitters get fooled and swing right through it.
Then, of course, you consider the context that Wood plays in. He plays in the National League, plays in an elite pitchers’ park, and throws to both the best and second-best pitch-framers in baseball (Yasmani Grandal and Austin Barnes).
When I say Wood should be treated like a “top 5 or 10” pitcher, I’m underselling it because saying that it’s possible he’s a top 3 guy just sounds absurd. While people love to accuse me of being a Dodgers’ homer (even though I actually grew up a Mets fan), it’s not just THE BAT and me who believe this. Steamer over at FanGraphs has Wood pegged as the third-best starter in baseball right now—behind Clayton Kershaw and Noah Syndergaard and in front of Chris Sale. Whether you buy into top 3 or top 10 or top 20, there’s no denying that Wood is legitimately great right now. The biggest thing holding him back from a DFS perspective is that he doesn’t usually go very deep into games, but if he keeps performing like this, that could easily change.
Falling… And I’m Worried
Drew Pomeranz, SP, Boston Red Sox
If you were a subscriber to THE BAT last year or watched me at all on GrindersLive, you’d know that I’m a huge fan of Drew Pomeranz. When he was with the Padres last year, it was basically free money for subscribers any day he pitched. Then he moved to the American League and Fenway Park and I cooled on him a bit, but the talent was still there to play him in good matchups. Say, over the past couple weeks when he went back into the National League to face the Brewers or went up against the Rays in 45 degree weather. Oh wait… he got shelled in both of those spots.
So what’s the problem? Pomeranz continues to strike hitters out at an elite rate (10.7 K/9), but he’s generating fewer groundballs and allowing way more home runs. This is something that can be largely chalked up to variance over the kind of sample size that we’re dealing with, but I’m not convinced that’s all it is.
The biggest red flag is his injury situation. Pomeranz left the aforementioned outing against the Rays with “triceps tightness”—something he dealt with during the spring. It sounds innocuous enough, but anecdotally speaking, “triceps” injuries generally seem to mean elbow injuries, which everyone knows are big trouble for a pitcher. If we dig deeper into the data, we can see some warning signs that something is not right.
For one thing, Pomeranz’s velocity is down about .75 mph. More worrisome, though, is that his release point is wildly less consistent this year, which is something we might expect of a pitcher battling an arm injury. If there is an elbow issue, the arm is destabilized and the pitcher can’t control all the parts of his delivery as well as he normally does. If he’s not able to control his arm as well, he winds up releasing the ball in a different spot than he intends to. And if he’s not releasing the ball where he intends to, that can lead to lessened command, missed spots, and (in some cases) elevated hit and home runs rates—which is exactly what we’ve seen from Pom to this point.
Take a look at the following chart, which compares the standard deviation of Pom’s vertical release point from 2016 to 2017, with league average included for context. To read the chart, what you need to know is this: a smaller number (and smaller bar) means the pitcher is more consistent with his release. The smaller the bar, the more often the pitcher is releasing the ball from the same spot every time.

The difference between 2016 and 2017 is striking. Pomeranz was roughly league average with his release consistency last year, but this year he’s really struggling to release the ball from the same spot each time he throws.
This is worrisome and means that Pomeranz is, at the very least, dealing with worsened command. At most, it could mean the injury he’s dealing with is more serious than the team is letting on. In either case, I’m going to be a bit wary of Pomeranz over his next few starts, even if THE BAT likes him. After all, THE BAT can’t know that this guy might be hurt and might be a different version of himself, but by digging deeper, we can see that ourselves.
Falling… Sort Of
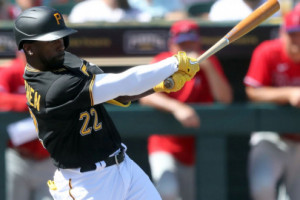
Andrew McCutchen, OF, Pittsburgh Pirates
Sometimes when people subscribe to THE BAT, they read about my background and the methodology and all the different factors that it considers, and they expect it to be infallible. Unfortunately, no matter how good the system, variance is a big and unavoidable part of MLB DFS. THE BAT’s sabermetric methodology helps it account for that variance better than most systems do, but still anything can happen over the course of a day or a week or, in some cases, months.

And because THE BAT is an objective system, there are certain things that it simply can’t account for. The biggest one is cold streaks. In general, cold streaks have very little predictive accuracy. By nature they take place over a short span of time, and there are too many guys who randomly go 3-for-20 just by sheer chance. But there are other guys who have something legitimately wrong with them. They are playing hurt, they have something wrong mechanically or psychologically, etc. The best long-term bet is to assume that whatever is wrong will correct itself, but in the short-term, an objective system will wind up overrating these types of hitters. And since their prices will likely drop along with their cold streak, that means they’ll wind up showing up in optimal lineups, which means it doesn’t matter how well the system is projecting normal guys, these are the ones that will be highlighted. It’s critical to remain vigilant with these guys and ere on the side of safety, ignoring the ones who are on prolonged streaks until they finally right themselves.
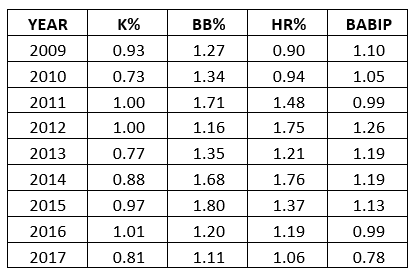
The biggest example of this right now is Andrew McCutchen. While anecdotally it seems like Cutch hasn’t done anything for a good year-and-half now, mathematically, he still projects to be a great hitter. ZiPS, Steamer, PECOTA, all the year-long systems agree with THE BAT on this. He’s done enough to still be productive, and his problems have come in some of the higher-variance areas that we tend to write off as noise. Here are McCutchen’s career numbers in four key categories, scaled to league average to account for the changing run environment (1.00 would be league average, higher is more than average, lower is less than average) and adjusted for context (McCutchen plays half his games in PNC Park, which is brutal for RHB).

The biggest drop-off for McCutchen has been with BABIP. BABIP is easily the most likely to be driven by pure randomness, especially when it was at near-elite levels for pretty much his entire career. His power has fallen off, but it’s still above-average even in a tough home park, and it’s been accompanied by a severe reduction in strikeouts this year—the most stable stat of all. Put all of this together, account for the variance in each stat, and account for how much PNC Park depresses right-handed hitter stats, and you wind up with a player who still project to be well above-average—downright good, in fact, especially when you put him on the road away from PNC.
All of this is mostly just to illustrate how McCutchen still has lots of underlying talent. But for now, especially while his BABIP is so low and he just can’t buy a hit, I just can’t play him. If he shows up in optimal lineups using THE BAT, I’m hitting the “Exclude” button.
To help you identify player similar to Cutch, I’ve added a “COLD” column to THE BAT Hitters page this year. This will show you when a guy is cold, so you can dive in and decide whether it’s just random or if you should be avoiding him for the time being.