THE BLITZ: Highly Accurate Projections... and Here's Proof

Let’s not bury the lede: THE BLITZ’s top optimal lineup cashed an incredible 73% of the time on DraftKings in 2019 (after cashing 71% in 2018), and the top 150 optimal lineups were all extremely profitable as well. Read on to discover more about just how accurate THE BLITZ is and why it will change the way you play DFS forever.

The Importance of Accountability
It’s rare that a projection system is really held accountable by tracking and quantifying its results. With so many DFS experts out there, why aren’t there more published records to prove whether a system is profitable?
Transparency is key to building expertise, trust, and differentiation; and a factual exploration of THE BLITZ’s profitability is what this article is about.
What is THE BLITZ?
THE BLITZ projection system uses advanced sabermetric techniques to form what we believe to be the most sophisticated NFL Player Projection system on the market. And what truly ignites this proven analytics system beyond basic projection statistics is the overlay of advanced factors including scouting-combine data, holistic player considerations, and game context adjustments. Details about THE BLITZ’s cutting-edge methodology can be found here.
The team behind THE BLITZ’s innovation is Derek Carty, DFS expert and creator of THE BAT projection system for MLB DFS — proven to outperform Vegas lines — and PropWizard Professional Sports Gambler, which applies the same advanced methods as Vegas Oddsmakers to strengthen and refine player projections.
Upgrade your football projections now!

How to Determine the Accuracy of a Projection
The challenge with buying any DFS content is determining its worth. Is paid content more accurate than free content? Do I want to risk my paycheck to find out? What does an accuracy test look like, anyway?
There are several ways to conduct accuracy tests on a projection system. For example, I can illustrate how THE BLITZ outperforms competitive projections. I can quantify the strong mathematical correlation between player projections and confirmed player results. I can even document strong DFS scores or tout prize winnings. But the drawback to all of these tactics is their failure to quantify a return.
Since NFL kickoff, we tracked the cash-line for one of the most prominent cash game contests, DraftKings’ Massive Single-Entry $25 Double Up. Due to the size and entry fee, it is a good representation of what it takes to beat cash games any given week. If THE BLITZ is profitable here, it’s reasonable to conclude it would generate similar results in other Double-Ups, 50/50s, and Head-to-Heads… and it likely means THE BLITZ is a high quality system that would do well in GPPs too.
Testing THE BLITZ’s Top Optimal Lineup for Accuracy
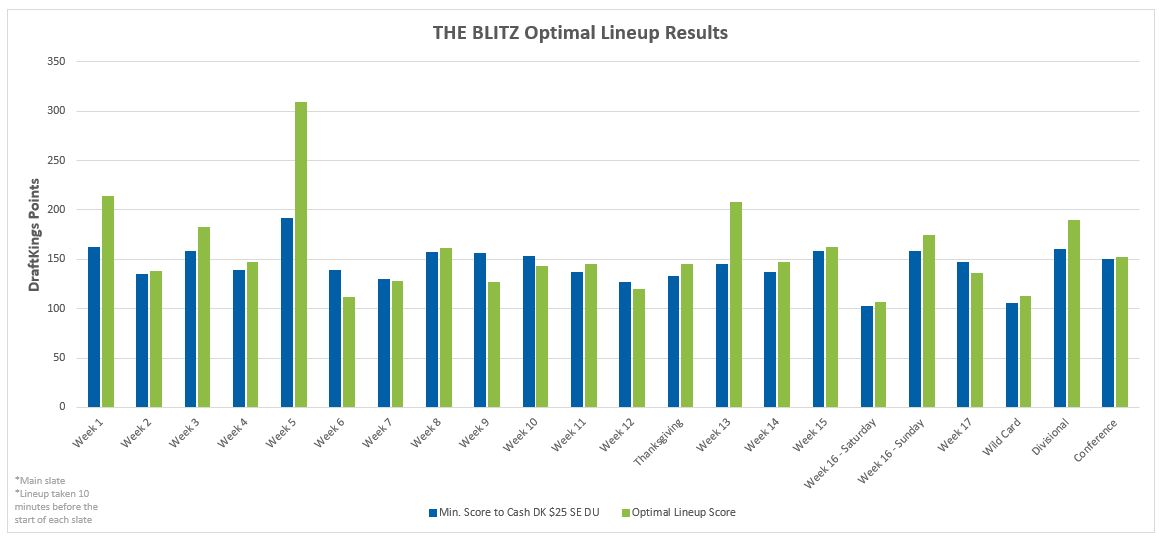
The contest results are tracked below.
- The table below compares THE BLITZ’s optimal lineup score vs. the cash-line score for the Massive $25 Single Entry Double-Up contest.
- The second column in the table displays THE BLITZ’s optimal roster score (i.e. what your score would have been if you had played THE BLITZ’s optimal lineup).
- The third column displays the cash-line score for the contest. Simply stated, if THE BLITZ’s score was higher than the cash-line, THE BLITZ was profitable.
- The adjacent columns display additional data including the contest’s size, entry fee, payout, THE BLITZ’s total profit, and ROI.
Because transparency is so important for DFS fans, screenshots were taken each week of the optimal lineup on both DraftKings AND within RotoGrinders’ LineupHQ tool. You can view them here.
Massive $25 Single-Entry Double-Up

Key Takeaways:
- THE BLITZ optimal lineup cashed in 16 out of the 22 slates… 73% (!!!)
- THE BLITZ produced a 45% ROI in the Massive Single Entry Double-Up contest
- This isn’t a single-year fluke: in 2018, THE BLITZ cashed 71% of slates for a 43% ROI
At first glance, a total profit of $250 after a full season may not seem like a lot, however, the calculations are based off a single entry for one contest. Had you played more contests and increased your investment, you likely would have generated more profits.
The main takeaway isn’t the total profit, though; it’s the massive 45%+ ROI. Given you need to win more than 57.5% of the time just to break even, a 45%+ ROI is extremely strong.
A 70%+ cash rate is a big deal, and THE BLITZ has done it two years in a row. Most cash game players are aiming for 60% or 65%, and they’ll be very happy and profitable when they achieve it.
Convinced? Subscribe to THE BLITZ now!
Testing THE BLITZ’s Top 150 Optimal Lineups for Accuracy
We didn’t stop there, though. A good projection system is more than just a great optimal lineup. Anything can happen over 20 weeks, especially when we’re using just nine players to try and judge a system that may project 20x that many players each week.
A system may perform well on the whole, but if it happened to be on the wrong side of a couple coin flips when it comes to the “optimal lineup”, it may look like it did poorly in that light—or visa-versa. There’s very little practical difference between the #1 lineup and the #10 lineup, which may only project for a couple 1/100ths of a point less.
So what if we looked at the top 150 optimal lineups? That seems like a much stronger proxy for the quality of the system as a whole than just one lineup is, since many more players will be involved in that many lineups. The good news for THE BLITZ is: those lineups do really well too!

Why does this chart say the top optimal “only” cashed 65% of the time when the previous chart said 73%? Well, unfortunately, the multiple-lineup data from Week 2 was lost and, through a miscommunication, no data was collected for the Thanksgiving, Week 16 Saturday, and playoff slates, which were all big winning weeks for the top optimal lineup.
Even without them, though, the top 5 lineups cashed 70%+ of the time in the Massive Single-Entry $25 Double-Up throughout the 2019 season. The average of the top 50 lineups were just as good as the #1 optimal.
And even once you go down to the top 150 lineups — which most people would never even see much less think of playing — they still cashed easily! The top 150 lineups had a lot of differentiation, utilizing an average of 38 different players per week! And there really wasn’t even much drop-off from the top optimal to these lineups. Stated differently: THE BLITZ was right about lots of different players each week, and you could have played literally ANY REASONABLE LINEUP using THE BLITZ in 2019 and had a very profitable season!
And these results likely understate how good THE BLITZ actually was! In the 6 missing slates, the top optimal finished in the 75th percentile on average, while in the 16 slates that were included in the table above, it finished in just the 64th percentile. In other words, the top 150 lineups likely would have done EVEN BETTER if we had recorded the data properly and had another six slates of 75th percentile performance mixed in.
Starting winning with THE BLITZ now!
Q&A
What is a realistic ROI for someone using THE BLITZ?
We’ll be the first to admit though the ROI and Win% have been insanely good every year we’ve run these tests, there is no guarantee numbers this high are sustainable long-term. After all, we’re predicting the future here. Even over a full season, 22 weeks is still something of a small sample and prone to some variance. Still, no matter how you cut it, numbers that good can’t be all good luck (especially when it happens multiple years in a row) and do highlight the quality of the product. Based on these studies and our personal results, it seems reasonable to assume THE BLITZ’s optimal lineups can generate 15%-20%+ ROI over a large sample size of cash games even once you account for regression.
How does THE BLITZ’s optimal lineup perform in GPPs?
THE BLITZ’s optimal lineup is designed for cash contests because it’s not factoring in projected ownership or additional GPP variables. However, had you blindly submitting THE BLITZ’s optimal lineup every week in the Million Maker GPP this year, you would have generated a profit also. In Week 5, the top optimal lineup finished 20th in the Million Maker. Part of the reason for not including this data in the study is we don’t have the screenshots to verify this and because THE BLITZ’s optimal lineup is designed for cash contests and not GPP contests. Had you dug deeper into THE BLITZ’s projections and its top point-per-dollar plays each week, you would have found yourself on lots of underowned value this year, including Teddy Bridgewater when he had his big weeks, Lions backup QBs David Blough and Jeff Driskel when they had their best weeks, Matt Schaub when he filled in for Matt Ryan and had a big week, and lots more. THE BLITZ doesn’t just spit out chalk; it separates good chalk from bad chalk, and it’s not afraid to be contrarian plenty of times. It’s top Point/$ plays and stacks are frequently in the winning Milly Maker lineups. More tips on how to use THE BLITZ for GPP contests can be found are below.
How does THE BLITZ perform on FanDuel contests?
Due to time constraints, we’re not tracking FanDuel contest scores. Considering the accuracy of the projections, one could conclude THE BLITZ’s FanDuel Optimal Lineup would perform well over a large sample size, although Derek advises users to play the bulk of their action on DraftKings, where he believes there is a greater edge. Their pricing is softer (which seems to cater to casual players so they don’t lose their money as quickly), which reduces edge. DraftKings forces you to make tougher decisions, as opposed to just “whose studs had studlier performances today”, which introduces more random chance and variance into the equation.
Do you have any other tips on how to further increase my bankroll using THE BLITZ?
Cash Games:
- Instead of submitting multi-entries in a Massive Double-Ups, first invest your money in H2H contests or single-entry Double-Up contests.
- These contests tend to have a smaller rake, meaning DK takes a smaller percentage of the prize money and you get a greater percentage.
- It’s likely the competition is less fierce than in 50/50s and multi-entry Double-Ups, increasing your probability of winning.
GPP Games:
- Instead of submitting multi-entries in Massive GPP contests, first invest your money in single-entry GPP contests. It’s likely the competition is less fierce because the Sharp DFS players aren’t able to saturate the contest with +EV lineups.
- Once you get the hang of making one good GPP lineup, you can make more and play multi-entry contests
- Instead of blindly copying THE BLITZ’s optimal lineup and submitting it in a GPP contest, first identify the players THE BLITZ projects highly but are expected to have low ownership. You’ll increase your win probability when the player does well but is lesser owned.
- Be sure to stack in GPPs; THE BLITZ’s new Stack page makes it easy to identify the best raw and best value stacks each week.
With so many touts in the market vying for your trust and so much DFS content clouding your judgment with smoke and mirrors, how can you be certain of your projection system’s profitability? If your system isn’t documenting its results to prove its value, it may be worth questioning why not.
With THE BLITZ, not only are you getting a system that relies on sound mathematical principles and the most advanced sabermetric methodology, but you’re also getting quantifiable results of potential ROI. What you do with this information is up to you.