Impact of Lineup Position on FanDuel Points Production


They say, “Position in life is everything.” When researching the effect of a batter’s position in the lineup and his FanDuel fantasy production … they are right.
To determine that result there are two factors which must be evaluated. First, we need to know the impact of moving up and down the lineup has on the number of plate appearances. Secondly, we have to know the value of a plate appearance using the FanDuel scoring system.
In 2017, there were 4,860 games, generating 185,295 plate appearances (38.12 per team). In the following box you can see the average number of plate appearances based on a player’s position in the lineup.
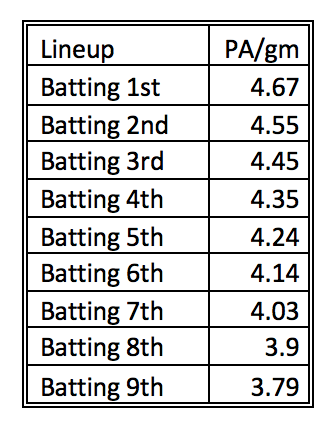
As you can see, the ninth-place hitting bats almost one-time less per game than the leadoff hitter.
Next we need to find the average fantasy production from each lineup position per plate appearance. To evaluate this, we need to know how a batter scores points in FanDuel tournaments; 1B = 3 pts, 2B = 6 pts, 3B = 9 pts, HR = 12 pts, R = 3.2 pts, RBI = 3.5 pts, SB = 6 pts, BB = 3 pts and HBP = 3 pts. (We can use total bases to combine singles, doubles, triples and home runs into one number and save time.)
Using Baseball Reference information, here are the runs, RBI, stolen bases, walks, total bases and hit-by-pitch per plate appearance last season and their FanDuel value.
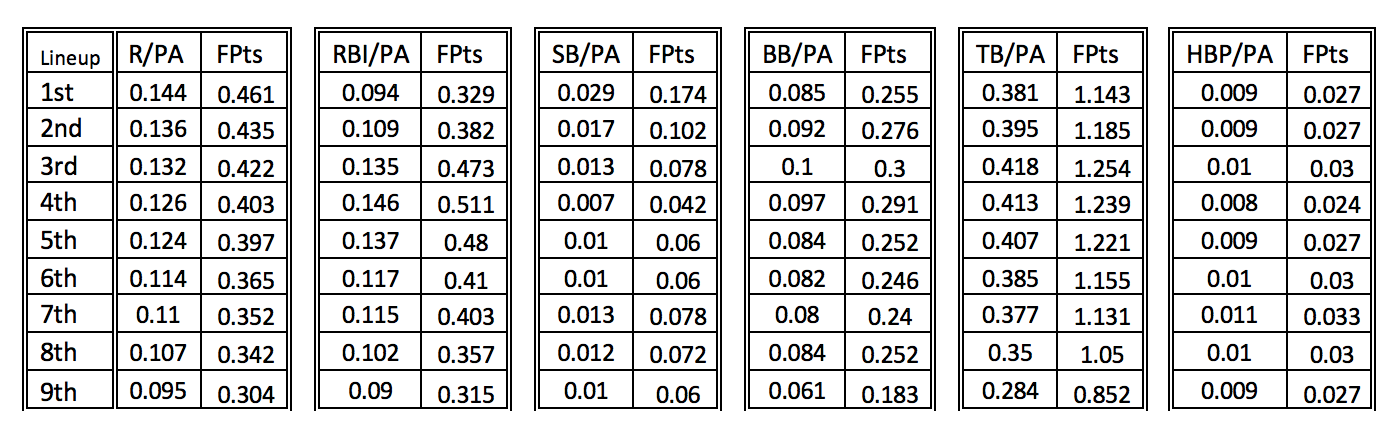
Add up the fantasy points and it reveals what each plate appearance is worth in FanDuel fantasy points.
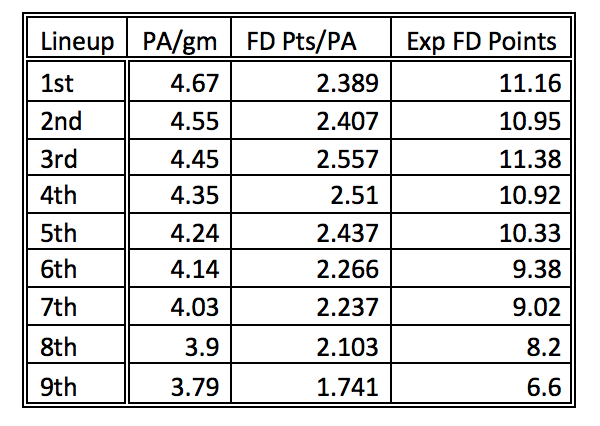
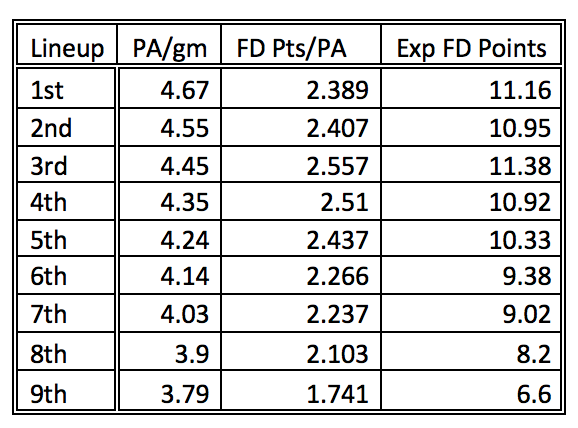
Using the previously determined plate appearances by position means the expected FanDuel value for each position in the lineup is listed on the chart below.
Mamas, don’t let your sons grow up to be No. 8 or No. 9 hitters.
As you can see from the chart, a leadoff hitter can be expected to score almost three points per game more than the No. 8 hitter. In real life terms, it means you should definitely check to see where in the lineup your fantasy selection is hitting each day, before locking in your starters.
It also shows how tough it is to find fantasy value at the bottom of the lineup. In fact, there are only two batters worthy of your attention, who regularly (at least 100 PA) bat ninth in the lineup.
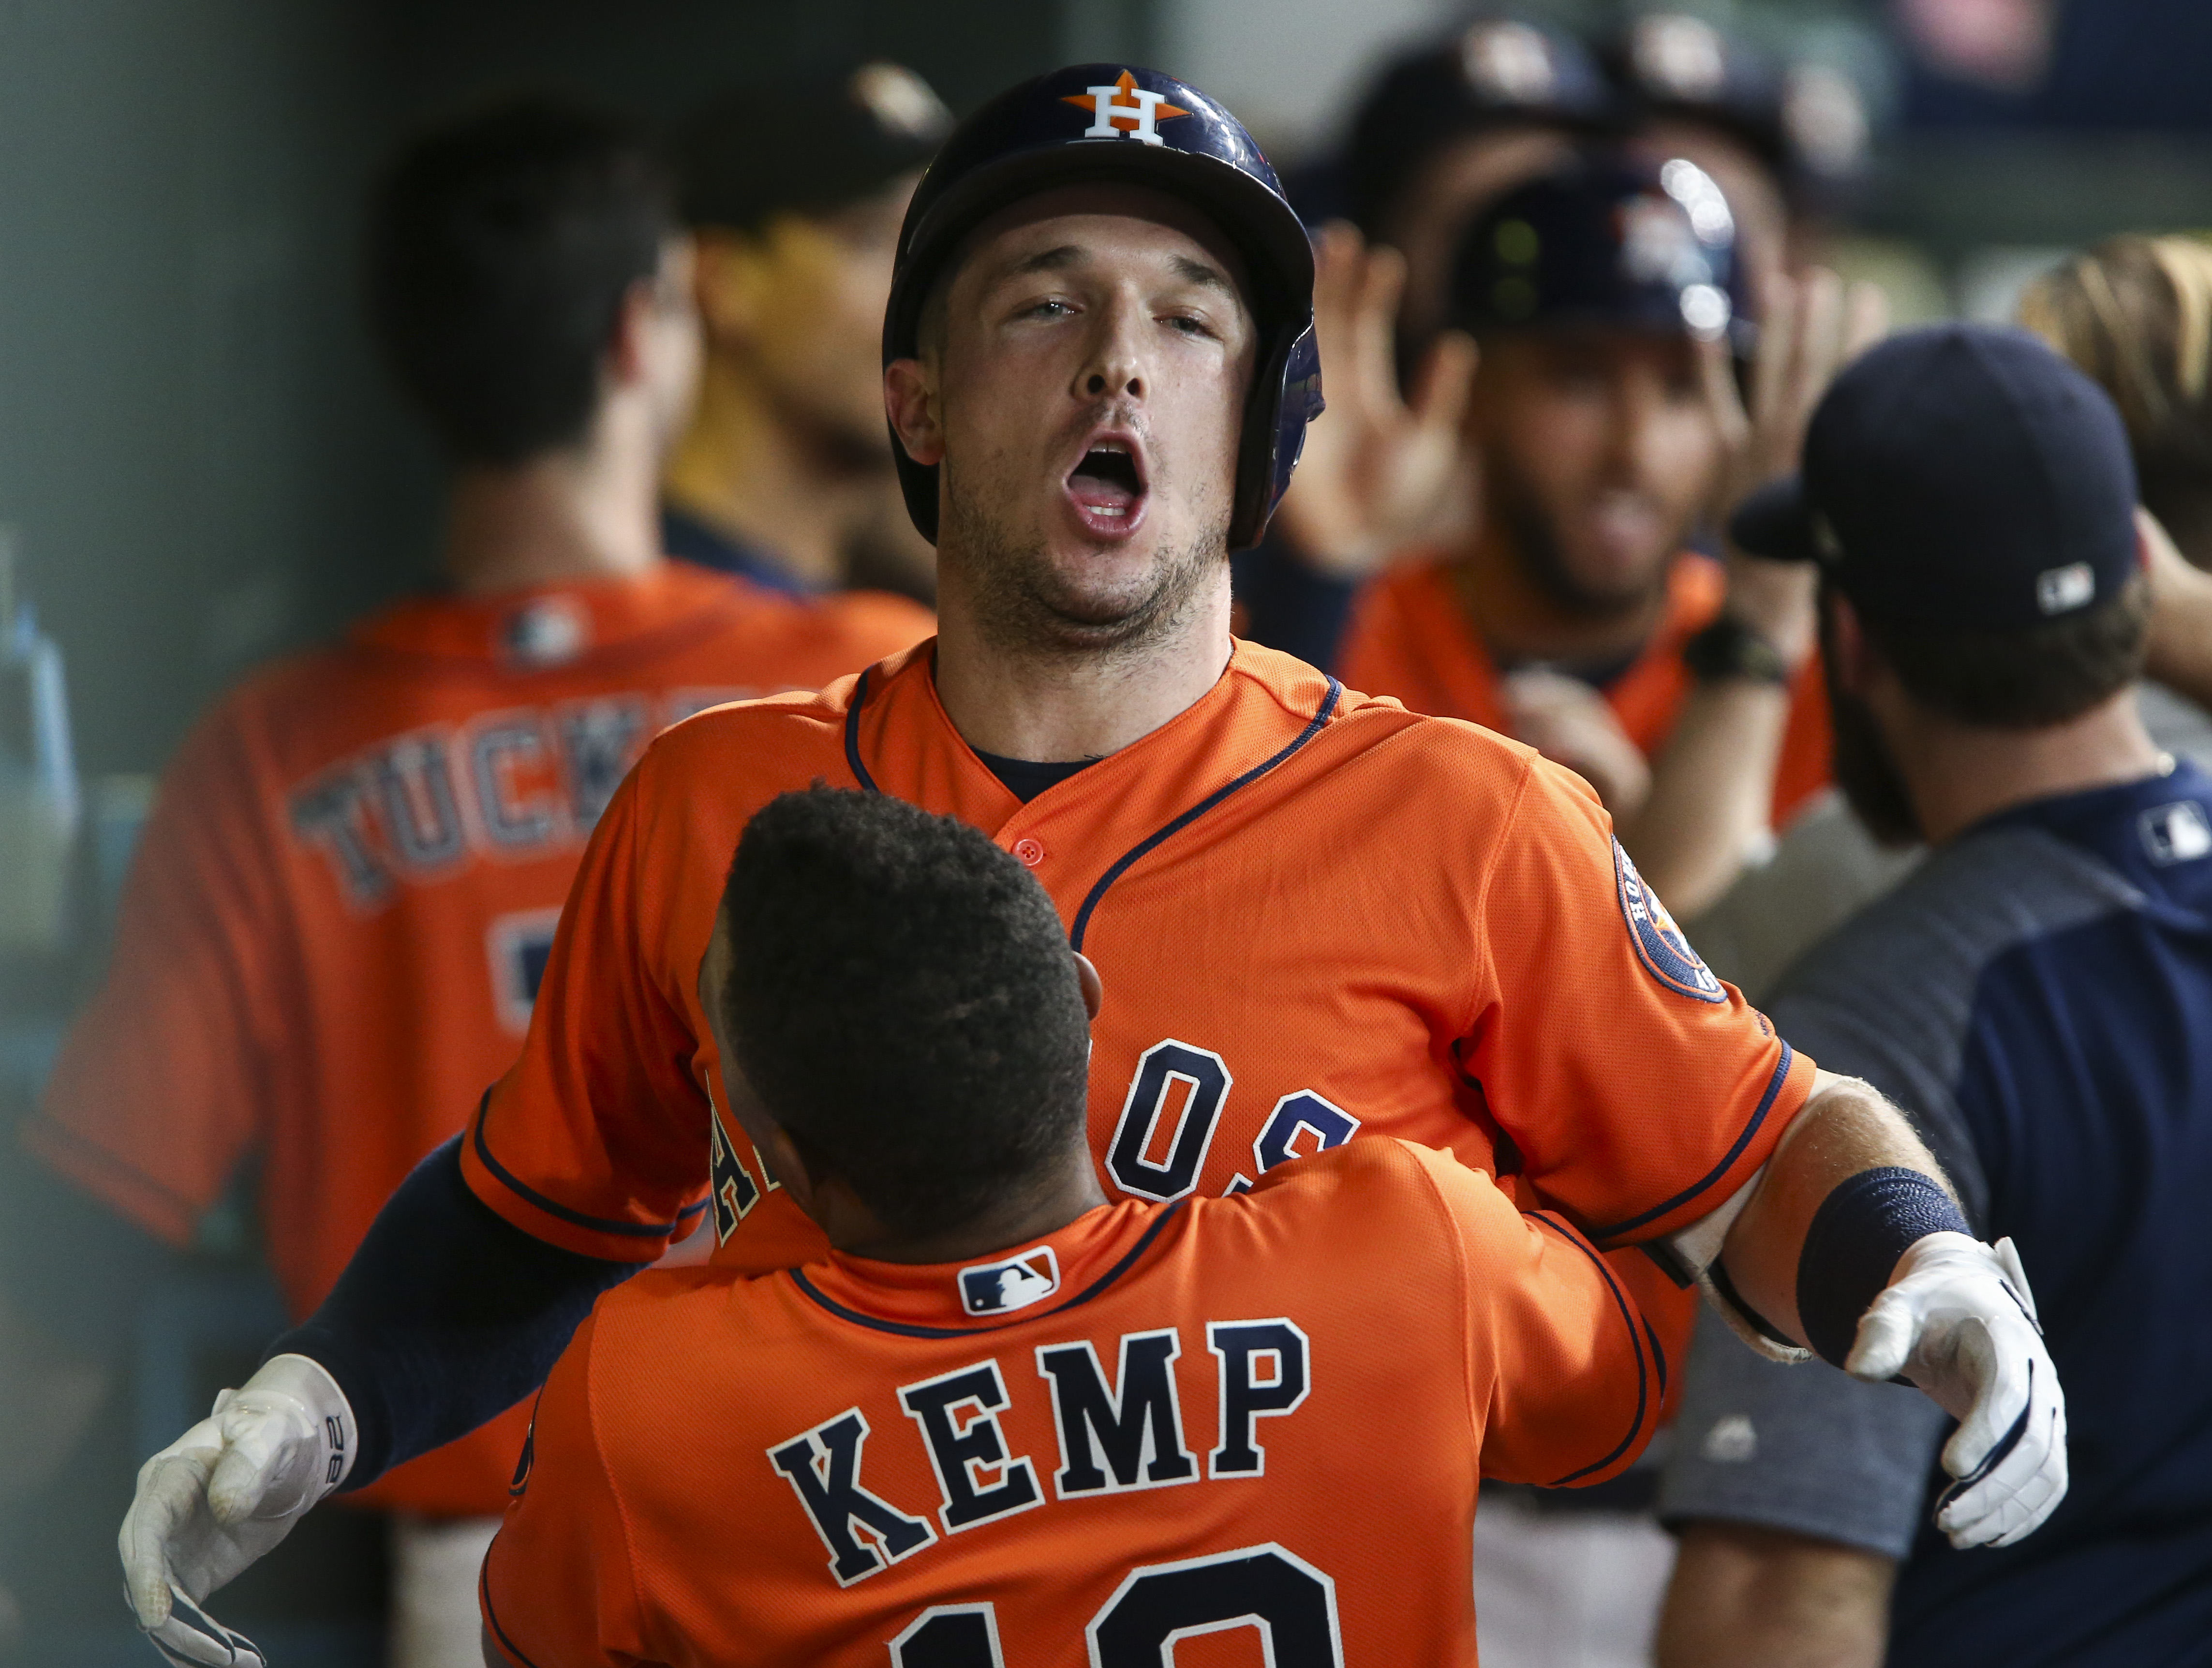
Tony Kemp, OF, Houston – The Astros called Kemp up on May 16 and he’s been a very good weapon at the bottom of their lineup. He owns a .352 batting average, .954 OPS and .413 wOBA in 108 plate appearances as a ninth-place hitter. Unfortunately, going forward with Kemp will have its challenges in a crowded Houston outfield that also includes; George Springer, Josh Reddick, Jake Marisnick, utility guy Marwin Gonzalez and recently called up Kyle Tucker.
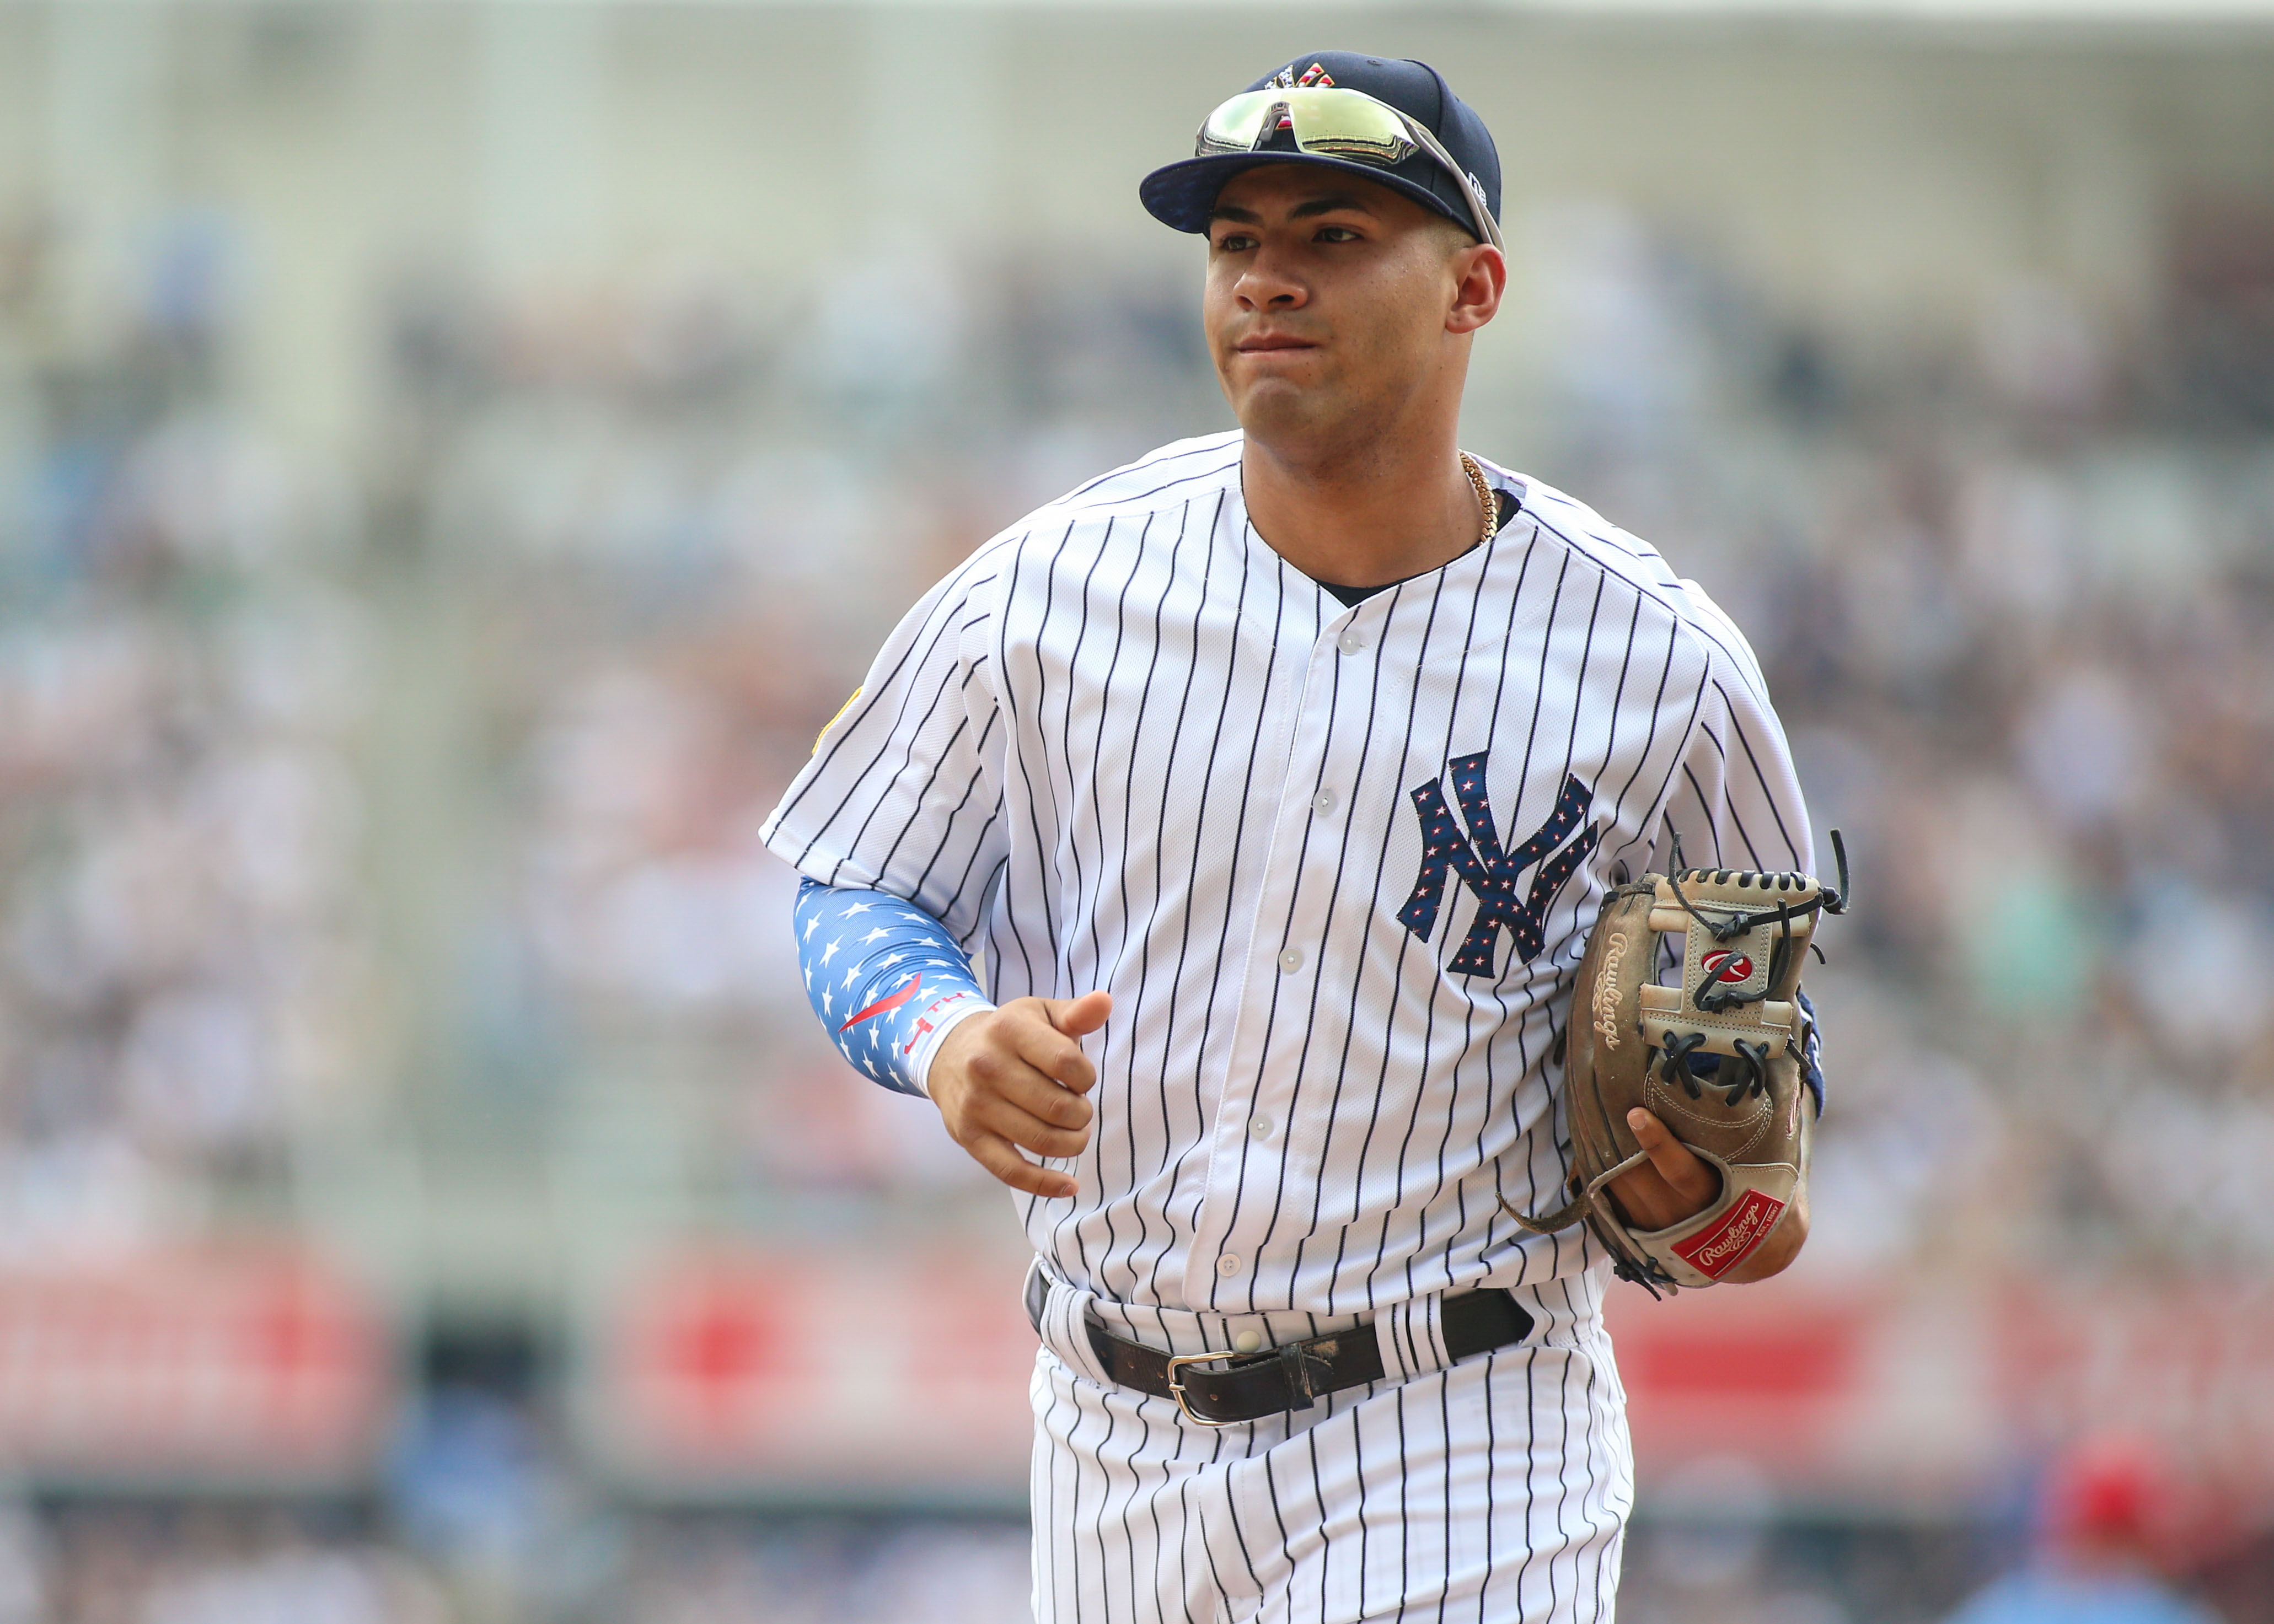
Gleyber Torres, 2B, New York Yankees – Torres began his Yankees career exclusively as the ninth-place hitter, but given his success (.294, 15 HR, 42 RBI, .381 wOBA) he’s been used all over the lineup. He’s currently on the disabled list.
No other ninth-place hitters have a wOBA over .340.
Sports Info Solutions has been at the forefront of in-depth analysis of baseball statistics for nearly two decades. The unequivocal amount of data along with their advanced analytics has made SIS a trusted brand in baseball. SIS works with 25 MLB teams to deliver resources that are used in decision-making both on and off the field. SIS Model 3 uses an expansive amount of data, combining metrics ranging from player age and career performance to game temperature and park factors, which has translated to a proven ROI and helped raised the game of DFS players at all skill levels.
- Author: Steve Schwarz
Want to build better lineups using SIS MODEL 3? Click here for more details
To gain more knowledge on MLB DFS, visit our detailed guide about scoring rules for MLB on FanDuel and DraftKings.