NFL Best Ball 201: Understanding ADP

If you read Mike Beers’ introduction to Draft NFL Best Ball leagues, you gained a firm understanding of the Best Ball format and are itching to gain deeper knowledge and attack these leagues with profit in mind.
What is ADP?
In his latest article, Beers references Average Draft Position (ADP) and discusses some early jams and fades based on the ADP developing in Draft Best Ball leagues.
What is ADP, though? Simply, it’s the raw average of every pick invested in a particular player. I’m here, however, to tell you that ADP is just a number. ADP obscures the truth, masks recent sentiment, and seduces casual players into a costly comfort zone. While it is a reasonable estimate of player value, it should be approached logically and understood as a very rough representation of where a player might be drafted.
Editor’s Note: Use promo code “GRINDERS” when you sign up for DRAFT and get a free $3 contest entry and THREE months of RotoGrinders DRAFT Premium content!
What’s hiding behind ADP?
If you’re familiar with my prior work on this style of league, you’ll know that I focus heavily on distributions, probabilities, and timeframes. For those of you new to this format, let me provide some show-and-tell that highlights the driving forces behind ADP.
Overall Draft Position Distributions
Every time a particular player is drafted, his overall draft position is noted in the Draft NFL Best Ball “System.” Over the course of hundreds of league drafts, every pick invested in a player will create a distribution that looks something like this:
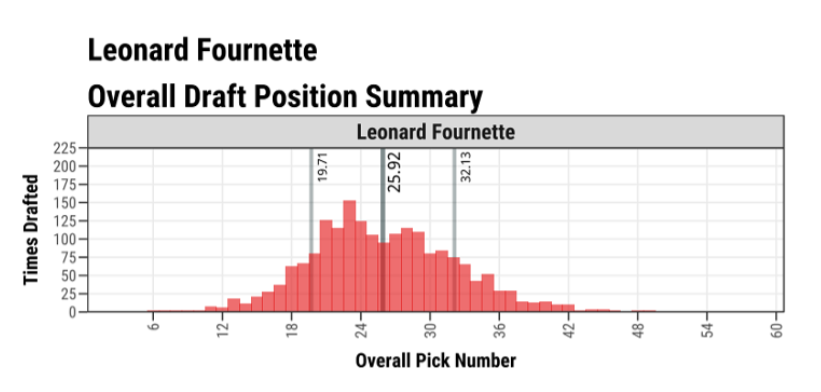
The distribution above encompasses 1906 drafts over the last three months. You’ll notice in the middle of the distribution a vertical line with a large number (25.92) next to it. This is the calculated ADP for JAC RB Leonard Fournette. You immediately notice that nearly half of the 1906 drafts have Fournette going prior to his ADP. The two vertical lines flanking the ADP line represent one standard deviation (SD) in Overall Draft Position. Simply put, if we assume this profile is normally distributed 1, 68% of drafters are selecting Leonard Fournette between picks 20 and 32.
Draft Position Probability
How can we action a distribution like the one above? First, we must understand how it affects the probability of desired players being available when we pick. Below is a representation of probability on a normal distribution. If we compare it to the draft position distribution above, we can draw some rough conclusions that will help us in our drafts.

Calculating the probability that a player will be available at a particular pick(s) isn’t too difficult if we know three things 2:
1. The player’s ADP
2. A reasonable estimate of the player’s standard deviation (SD)
3. Which pick(s) we wish to target said player
So far as a “reasonable estimate” of SD is concerned, I recommend three (3) picks for the first two rounds, six (6) picks for rounds 3-4, nine (9) picks for rounds 5-6, and so on. A standard deviation of 1.5 picks per round will put you on very solid ground for probability purposes.
Knowing the probability a player (or group of players) will be available at a particular pick helps us structure our drafts in real time. It allows us to plan ahead one, two, or more rounds based on the player pool available and the ADP supplied by the RotoGrinders Draft ADP page.
Understanding Recency Bias, Sentiment, and Timeframes
If we want to create sound draft plans, it is critical to understand how time affects ADP and draft distributions. The big picture, although giving the most information, may not supply us with the most accurate data we need to draft today.
Take, for example, how quickly BAL WR Mike Wallace’s overall draft distribution shifted over the last few weeks:


Through the course of four weeks, Wallace’s ADP dropped nearly two full rounds. If we just view his overall draft distribution through the same time period, however, we read the wrong story. With only ADP to go by, we might end up reaching for Wallace ahead of where we can normally draft him. Instead, if we utilize recent sentiment, we can ebb and flow with the market much more accurately. This knowledge allows us to draft players at better value (something Mike Beers discusses at length) versus the market, and also to avoid potential landmines when the market is overpaying for a particular player or position.
Wrapping Up
These three ideas will be frequent subjects in my discussions. While we build comprehensive Draft Best Ball data here at RotoGrinders, I recommend checking out similar data from MyFantasyLeague MFL10 drafts as a reasonable “go-by” for your upcoming Best Ball drafts.
Why wait, though? Have a go at Draft’s new Best Ball format armed with your new knowledge today!
Editor’s Note: Use promo code “GRINDERS” when you sign up for DRAFT and get a free $3 contest entry and THREE months of RotoGrinders DRAFT Premium content!
1 – If you’re not familiar with normal distributions, I recommend this crash course.
2 – Want to see how this calculation works? Check out this visual representation of probability.