Risers and Fallers: Volume 6

I’m excited to be back for another week of Risers & Fallers! Each week, I’ll break down a handful of players using advanced metrics, insights from my scouting background, and my DFS projection system THE BAT (available in the RotoGrinders Marketplace), which consistently beat Vegas lines last year. I’ll examine guys whose stock is going up, guys whose stock is going down, guys who are perpetually underpriced or overpriced, guys who are worth paying a premium for, or guys who are just interesting and warrant some analysis on. If you guys have any suggestions for who you’d like to see in future articles, feel free to let me know.
I began writing today and found myself going off on a tangent, so today’s Risers & Fallers is going to be a little different than usual. Luckily for you, it’s a rant that will be extremely helpful for DFS purposes as opposed to an equally true but not especially helpful rant I could go off on about how underrated the Speed Racer movie is. (GrindersLive viewers, you know this rant well.) But first, a look at a potentially budding ace.
Rising… and It Looks Pretty Legit
Jimmy Nelson, SP, Milwaukee Brewers
In the span of just over three years, Jimmy Nelson has gone from promising prospect, to gas-can especially exploitable by lefties, to potential ace. Nelson threw a dozen starts with the Brewers in 2014 with a 3.92 xFIP, but he declined in 2015 to 4.06 and then again in 2016 to 4.91. This year, however, he’s posted a stellar 3.50 xFIP that matches his ERA. So which Nelson is the real one?
THE BAT currently views him as a slightly above-average pitcher—significantly better than 2016, but not as good as he’s been in 2017. THE BAT takes into account certain aspects of a pitcher’s stuff to try and account for rapidly changing talent levels—most notably, velocity—but there are so many different aspects of pitching that there are things that it can miss. In the case of Nelson, while his velocity hasn’t changed much, plenty of other things have—things THE BAT (and no other projection system, as far as I know) isn’t (yet) considering.
The first is his control. These are Nelson’s walk rates by year, scaled to league average:
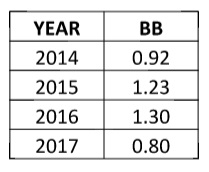

THE BAT still treats Nelson as having worse-than-average control (after all, he was terrible for the past two years), but there’s one fundamental difference to Nelson’s approach in 2017: he’s throwing from the stretch. Jeff Sullivan at FanGraphs noticed this in a recent article, and that set off the alarm bells in my head. Pitching exclusively from the stretch is move that several pitchers have made with great success, the most notable recent example being Carlos Carrasco. Similar to Nelson, Carrasco was a former top prospect, a flamethrower who struggled with control at times. When he made the switch to the stretch when he moved back to the Indians rotation in 2014, he basically became an ace overnight with near-elite walk rates. Much of Andrew Miller’s eventual success has also been credited to this change.
It’s not really something we can quantify, but it makes sense. From the wind-up, a pitcher has many more moving parts to keep track of. There are more ways for his delivery to get out of whack, and it’s easier to miss when one piece of the delivery is off because there are so many places to look. Pitching from the stretch is the simplification of the delivery and, therefore, it makes sense that a pitcher would be able to control where the ball is going more easily.
But Nelson’s changes aren’t limited to just his control. His strikeout rate is also up, and his stuff is better. The first thing to point out is the shift in usage from his sinker to his four-seamer:
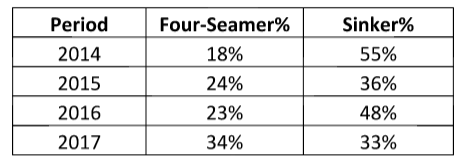
While fastballs in general aren’t great strikeout pitches, the four-seamer is far superior to the sinker, which is used much more to generate groundballs.
Along with the shift from his sinker to his four-seamer, Nelson has also shifted usage from his slider to his curveball—a smart move, since sliders generally play better off sinkers and curves better off four-seamers. Compounding this synergistic benefit, though, is that the curve itself has improved (which may even be the reason for the shift since he’s used it progressively more as the season has gone on; his June curveball usage is triple April’s). It’s picked up a half-mph of velocity, but more importantly, it’s hiding much better inside his fastball. I’ve talked in the past how important this aspect of the curveball is (it’s what makes those of Alex Wood and Lance McCullers so great), and Nelson’s has gotten quite good:
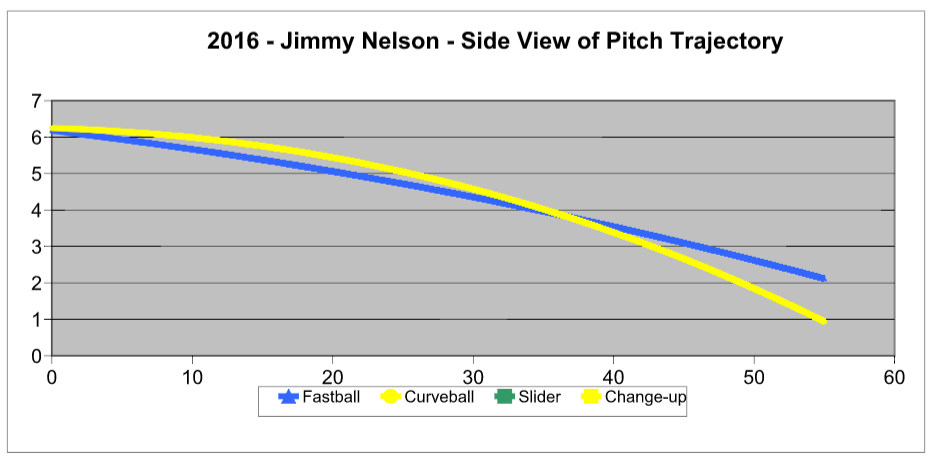
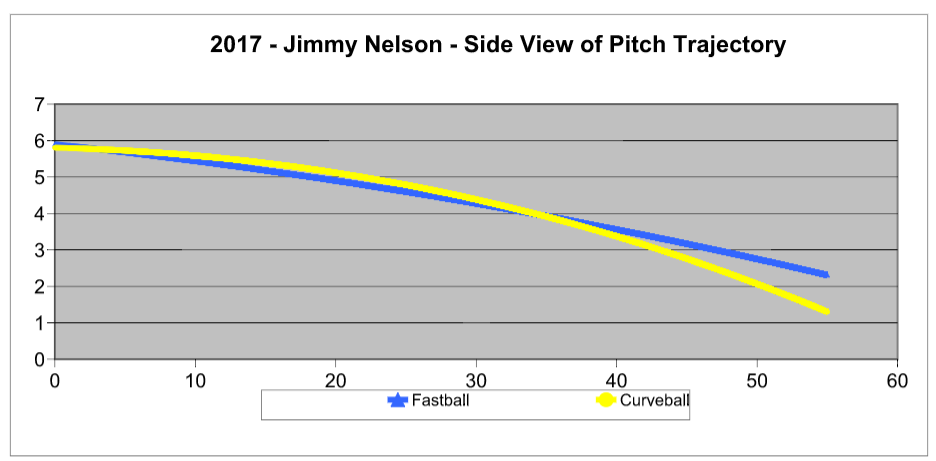
Between the added velocity and the lowered arm angle (you can see, on the left side of the trajectory, that the pitches are coming out of a lower slot this year), the gap between the fastball and the curve is much smaller, making it much harder for the hitter to identify the pitch as a curveball and not as a fastball until it’s too late. Nelson’s curveball hump was on the smaller side to begin with—it was a great pitch to begin with—but this makes it even better. While his slider is a good pitch too, the curve now projects as a better strikeout pitch, and along with the shift to the four-seamer, this would explain some of the K spike this season. (It’s also a better groundball pitch than the slider, which has helped him keep his GB% up while shying away from the sinker.)
The final thing I want to talk about is Nelson’s reputation as a guy who is terrible against lefties. This seemed to develop in 2015, when he had a huge platoon split, but his issues were really contained to that year. Here are his yearly wOBA numbers versus each hand:
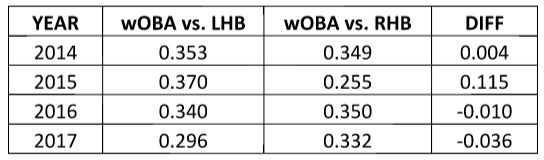
For one year he had a huge gap, but for the rest he’s been neutral or reverse-splits. It’s amazing how one year can shape a guy’s reputation, but it goes to show how much variance single-year platoon splits can have.
THE BAT currently projects him for a roughly average split for a right-hander—not extreme, not reverse, just normally better against righties and normally worse against lefties. If you need further reason why he’s not that guy who struggled so much in 2015, consider that he was throwing his sinker and slider much more in 2015 than he is currently. Both are pitches that lead to wide splits, while the fastball and curveball he’s using more in 2017 lead to neutral or reverse splits. His arm angle has dropped this year—which is a factor in wider splits—but that’s part of why THE BAT has him with more of a neutral split rather than the reverse split he’s shown in his limited sample this season. Lower arm angle plus more reverse-splits pitches plus wide mix of results over the years equals neutral splits. All told, if you’re trying to pick on Nelson with lefties because that’s what you’ve done historically, you’re making a mistake.
Honestly, if you’re picking on Nelson at all you might be making a mistake. I’m not ready to anoint him an ace yet, but there are legitimate reasons for his resurgence this year, and I think he may deserve a little boost in THE BAT projections on days he pitches. This is the kind of stuff I plan on incorporating into THE BAT in the future, but it’s not in there yet.
Rising… and Please Punch Me in the Face
wOBA, Stupid Stat, Literally Everywhere in DFS
wOBA is terrible. At least, in the way DFS players use it, wOBA is terrible. For what it was originally intended for, wOBA is awesome. wOBA was invented in the sabermetric community by Tom Tango, Mitchel Lichtman, and Andrew Dolphin… as a descriptive stat to explain a hitter’s contribution to actual, real-world run-scoring. It was not intended to be used as a predictive stat. But as it became popular in the sabermetric community, and especially as places like FanGraphs became more mainstream and embraced it as a catch-all stat for real-world offensive production, DFS players started using it (or misusing it, as it were) for predictive purposes. Yes, wOBA is far superior to a stat like batting average or on-base percentage in which everything is weighted the same (a single and a home run both count as one hit), but the weights in wOBA still don’t actually have any DFS significance. Here is the wOBA formula for the 2017 season:
wOBA = 1.182 + BB*.693 + HBP*.723 + 1B*.876 + 2B*1.231 + 3B*1.550 + HR*1.976
Now, explain to me the DFS significance of a single being weighted as .876? Or why a home run is only 2.8 times more valuable than a walk? Or go find a DFS player or tout who can explain it to me. I’ll wait.
….
…
…
…
That’s what I thought. There’s literally no reason, because for DFS purposes, these weights are completely arbitrary. The only reason it’s more “predictive” than batting average is because it correlates more strongly with itself from year-to-year. That happens because it gives heavier weighting to things that are more stable, like walks and home runs, and so it will fluctuate less from year-to-year and over smaller time periods, but that doesn’t make it a “predictive” stat. It makes it a descriptive stat that’s better at describing the important things than our previous tools like batting average could. But there’s nothing predictive about taking a collection of stats—unadjusted for variance or aging or context, mind you—and slapping some arbitrary weights on them. You know what’s more predictive than wOBA? Actual home run rate. Actual walk rate. Actual hit-by-pitch rate. wOBA is just a mish-mosh of these things plus other things that are less predictive of themselves.
As I said earlier, wOBA was invented as a descriptive stat to explain a hitter’s contribution to actual, real-world run-scoring. But actual, real-world run-scoring is very different from fantasy point-scoring.
Tell me this, have you ever heard a DFS analyst tell you to play a guy because this year he’s averaged 8.6 DraftKings points? Of course not. If you have, promptly start ignoring them, but then also tell me why such analysis is any worse than citing wOBA as a reason to play a guy. DraftKings or FanDuel points per game and wOBA are exactly the same thing; you take the stats you care about, and you slap weights on. Except in the case of DraftKings points, those weights are actually relevant, and it includes all the stats we care about, since wOBA leaves a couple out. DraftKings points measure the actual worth of each stat for DFS purposes. wOBA weights don’t.
In this light, it’s actually better to just look at the average points totals the sites give you for each player than it is to look at wOBA, all else held constant. Simple DraftKings points are better than wOBA. Intuitively and actually. (Not that I’m advocating use DraftKings points for your analysis, of course.)
wOBA is a simple and (now) easily recognizable way to show a player’s quality to this point in time (I mentioned Jimmy Nelson wOBA in this very article, after all), but make no mistake: it’s a shortcut. It’s fine for making a quick point, but it should hold absolutely no place in any sort of comprehensive DFS analysis, especially if that analysis is forward-looking. (In determining Nelson’s current vs. LHB and vs. RHB ability, THE BAT doesn’t use wOBA at all. It looks at each stat individually, accounts for variance, accounts for the impact of arm angle/pitch type, etc.)
While wOBA takes an important step forward in weighting singles differently from home runs in terms of importance, it’s simply the new batting average in terms of accounting for variance. Whereas batting average gives everything the same weight for importance, wOBA gives everything the same weight when it comes to variance. In reality, home runs are more stable than singles are. Doubles are less stable than walks are. But wOBA treats them all the same, because it was never meant to do this in the first place. It was simply meant to be descriptive.
If we want to do proper forward-looking analysis, you simply can’t treat everything the same. You have to account for the variance of each stat. You have to account for the context the stats were accumulated in. (A home run in Kauffman is more impressive than a home run in Citizens Bank Park. But while Citizens Bank inflates home runs, it also inflates strikeouts). You have to include more than just one year. You have to account for aging. And when you do all this, you get something that’s actually predictive: a projection.
wOBA is fine as a shortcut, but it’s super overrated, doesn’t really do what people think it does, has holes that people don’t recognize, and it pushes my buttons when people misappropriate it.
Now get off my lawn.