PropSheet Tutorial

How to Use the NFL Player Prop Sheet
As you probably know, it’s common for DFS touts to cite Vegas odds when making recommendations. After all, given the high volume of bets that Vegas receives on NFL games, sportsbooks have strong incentive to make these odds as accurate as possible. We as DFS players can benefit from watching how sharp bettors are reacting to these lines, which we can use to further inform our own player analyses each week. If a line is too low or too high, smart bettors will place wagers that will cause the line to shade towards their bets. From watching how player prop lines move, DFS players can find predictive shifts that will help them find strong plays by following this sharp money.
And while it’s true that many of Vegas’s lines are sharp—especially when it comes to game-level odds—and get sharper as it gets closer to game-time and the smart money begins to influence the lines more and more, there are always inefficiencies that we can take advantage of from a betting standpoint. This is especially true earlier in the week before the smart money brings the odds into equilibrium. It is also true for player props, which tend to receive less betting volume than game odds and which Vegas has less incentive to make super sharp in the first place.
The EV Analytics Player Prop Page is an incredible tool that can help DFS players find these smart-money shifts quickly and efficiently while simultaneously helping to identify the most inefficient lines to bet on using our back-tested over/under projection models to see if those shifts are supported by the math.
We understand that our NFL Player Prop Sheet has a lot of data and can look a bit overwhelming at first, so this article will explain what everything means so you can make the best use of this data.
Before we get into the columns, let’s first highlight a couple of features on the sheet:
- The Search Bar on the top right allows you to filter out any unwanted rows. This can be used to quickly find all props for any given game, player, position, or category.
- The EVA and All buttons at the top left allow you to switch between a condensed view—with just our projected outcomes and their associated EVs—and a detailed view—where you can see all of the columns in the sheet. EVA is especially useful when checking the sheet on a mobile device.
- Hovering over a row will highlight it to help you view your relevant information.
- All columns are sortable. If you’d like to find the props with the highest EV for overs or unders, you can easily sort by those columns. Additionally, when used in conjunction with the Search Bar, you can find powerful, sorted tools for DFS lineups. For example, if you are looking for QB upside, you can filter out all props except those relating to touchdowns thrown to see which QBs are likely to be posting +4s most often.
Sections
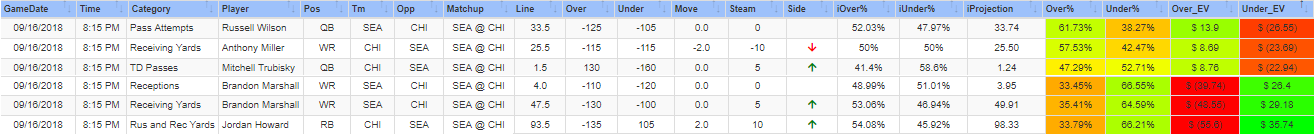
Below is a cross-section of props at the high- and low-end of the spectrum, sorted by Over_EV.
Player Prop

This section is fairly self-explanatory. We’ve got the date of the event, start time, stat category, player, and their position, team and opponent. Sorting and/or filtering by these columns can help you isolate a particular player, player type, game, or slate.
Consensus Odd

The Line column is the Over/Under odd for this market. Our algorithm for aggregating consensus odds sweeps across all of the books to find the most widely offered and most accurate line. It is also continually updating for accuracy. The Over and Under columns are the current odds in American format. For example, if you were to bet the over for Russell Wilson’s Pass Attempts, you would have to wager $125 to win $100, but if you bet the under for Jordan Howard’s combines Rushing and Receiving Yards, a $100 wager would win $105.
Live History

The “Live History” section details how the consensus odds are moving.
The Move column is the amount the stat in the prop has changed since it opened. The Steam column is the amount the juice has changed. A positive number indicates that odds have increased for the over (while simultaneously decreasing odds on the under) and a negative number indicates odds increasing on the under (and decreasing odds on the over).
When used in conjunction, we can calculate the opening line. As an example, let’s say Anthony Miller’s Receiving Yards prop is currently at 25.5 yards with -115 on both the over and the under. A -2.0 Move and a -10 Steam would give us an opening line of 27.5 yards with -125 on the over and -105 on the under. But then Jordan Howard’s Rushing and Receiving Yards prop, on the other hand, may have a +2.0 Move and a +10 Steam, for an opening line of 91.5 at -125 and -105.
Side allows you to quickly see which direction the line is moving. Much of the time, both Move and Steam move in the same direction and the Side is easy to determine. But there are instances where they move in opposite directions, and in these cases Side usually gives priority to the change in the Move column. This can help you detail how sharp bettors are placing their action. When new props become available on our page and across betting websites, they tend to move quickly from their initial line based on this heavy action.
Implied Values

Using the consensus odds and the juice on either side of the prop, we can shade the lines to determine what the implied probability of the over and the under is. We can also come up with an implied projection. Going back to the Anthony Miller example: The odds for his Over/Under are equal at -115. As a result, his implied odds are also even (iOver% and iUnder%) and his implied projection (iProjection) equals the amount in the prop. If we compare that to Jordan Howard, we can see that based on the juice, it’s implied that the over will hit more frequently than the under, and so the actual implied projection is 98.33 combined rushing and receiving yards versus the 93.5 yards that we are actually betting on.
EVA Expected Value
Finally, the “EVA Expected Value” section shows our EV Analytics’ own projections for these events to occurs. Over% is how often we expect a prop to hit on the over and Under% is its inverse. Over_EV and Under_EV then uses those probabilities to show expected profitability on either side of the prop, normalized to a $100 bet. If we return to the two examples from before, we can see that our projection for Miller is 57.53% on the over (42.47% on the under) for an average gain of $8.69 per $100 on the over or an average loss of $23.69 per $100 on the under. For Howard, we have 33.79% over (loss of $55.6) and 66.21% under (gain of $35.74).
Prop Calculator
In addition to this sheet, we will also be releasing a prop calculator in the near future which will allow you to check a site-specific line against our profitability calculator. All sites have slightly varied lines and this calculator will help you determine if the line you have access to is still profitable even if it is closer to our projected over/under.