Risers and Fallers: Volume 14

I’m back for another week of reviewing the most interesting players from the past seven days, pairing advanced metrics and insights from my DFS projection system, THE BAT, with my scouting background to try to figure out what to make of some the week’s most active lot of ballplayers. Guys whose stock is going up, guys whose stock is going down, guys who are perpetually underpriced or overpriced, guys who are worth paying a premium for, or guys who are just interesting and warrant some analysis on.
This week, however, will be a little different than most. I wanted to address my thoughts on the Red Sox and Rockies, since those thoughts run contrary to most, and it wound up taking up most of the article. Since these are clearly the two most potent offenses on any given DFS slate, though, it’s crucial to your profitability to get it right when deciding between them, and so digging thoroughly into them seems justified. I’ll resume next week with scattered thoughts on more players.
RISING… AND OVERPRICED
The Boston Red Sox Offense
I caught some flak this week for consistently recommending Colorado Rockies hitters over the Boston Red Sox. (I know, how silly am I for liking Coors Field?) The DFS community gets oddly defensive when it comes to the Red Sox. Suggest literally anything other than that the Red Sox are the greatest thing since sliced bread and you may as well have destroyed the world’s supply of bourbon. Or killed a puppy. Nah, the bourbon thing would be worse. Or, I suppose, beer, if that’s your cup of tea. But beer is overrated. (Sorry, guys, I can’t help pushing buttons).
Let me pose a question, and keep in mind that all of this is coming from a cash game mindset (although at this point, Red Sox seem to be higher owned than Rockies anyway): if the Rockies and Red Sox are both playing at home and are both projected for a team total of 6 runs, which team is it better to select your hitters from? This isn’t a trick question. There is a right answer, and there is only one right answer.
By my stance, I’m sure you can guess it’s the Rockies, but it has nothing to do with Coors Field or the details of the matchup. It has to do with two things: 1) the talent distribution of the offenses and 2) what league each plays in.
The Red Sox have one big star in David Ortiz, one minor star in Mookie Betts, and a pretty uniform lineup of mostly above-average hitters that contribute fairly equally. The Rockies have their two studs in Nolan Arenado and Carlos Gonzalez and then a bottom-half of the lineup that falls off very quickly in quality. Here is a rundown of the two lineups alongside the underlying (park-neutral) wOBA that THE BAT has assigned to each player:
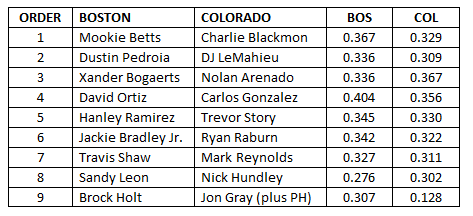
You’ll notice that the Red Sox are a much better offense overall and at practically every spot. They have just two below-average hitters (league average wOBA is about .315), and they don’t come until eighth and ninth in the order. The Rockies have four, and one is downright terrible, being the pitcher (mixed with a percentage of the Rockies bench to account for potential mid-game pinch-hitters). This means that when the Rockies project well, a bigger portion of their team projection will come from those stars, since they make up a bigger chunk of the overall quality of the offense. Remember this; we’re going to circle back in a minute.
Now onto the league. You’d think the Red Sox would have an advantage in the American League with a DH, but holding all else equal, it actually hurts them on an individual player level. While many will look at the team run total and just play whatever hitters they feel like from that team, this is lazy. That total is derived from the individual components, and from a probability standpoint, each player in the lineup will contribute to that run total to some (non-equal) degree. David Ortiz will contribute more than Sandy Leon will, being the better hitter and hitting cleanup instead of eighth. But everyone will contribute to some degree to the projected RBIs and runs scored, and that’s what all this comes down to.
In the AL, you need to assign those 6 runs to nine real hitters, given the DH. In the NL, you assign those 6 runs to eight real hitters and a pitcher, who will contribute a much smaller portion than the Sox nine-spot hitter since he’s so terrible.
This alone means that the real Rockies hitters should be better plays than Red Sox hitters since only eight are sharing the pie instead of nine. But if the Rockies are projecting for 6 runs, it means the matchup is really good. It has to be with so many below-average hitters, enough to boost the final team total line to 6 in spite of them. And as we saw earlier, because the Rockies studs account for a bigger portion of the overall quality of the offense, if the matchup is so great that their below-average hitters project well, their studs must project really well. So the effect is three-fold:
• The Rockies share the 6 runs among only eight hitters instead of nine.
• Because the Rockies lineup is less uniform than the Sox, Rockies studs get a relatively bigger share of the runs.
• To have the same total, the Rockies matchup must be much better, and so their studs must be in a better spot than Boston’s studs.
On Friday, I scaled both offenses to exactly 6 runs, for the sake of being apples-to-apples, and looked at how THE BAT divvied up runs scored:
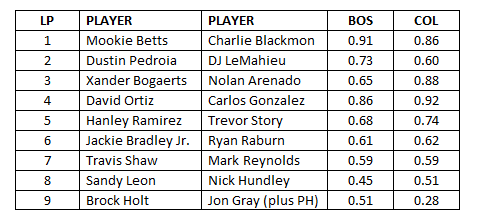
You’ll notice that despite being a significantly better hitter, Betts is barely projected for more runs than Blackmon. Pedroia tops LeMahieu (again being a much better hitter), but from then on down the Rockies are consistently better than Red Sox—especially in the middle of the order, where you’re going to be drawing most of your cash game plays from. Even CarGo, who is worse than Ortiz overall, projects for more runs. And when you get to the nine-spot, you see why. There’s an extra quarter of a run to be distributed to actual Rockies hitters (and relatively fewer runs being distributed to weaker hitters like Raburn, Reynolds, and Hundley.) This, of course, holds for RBIs as well.
Essentially, because Boston is a great offense, to project for 6 runs, their matchup must be good. For the weaker Rockies to project for 6 runs, their matchup must be great. And if their matchup is great, because of how lopsided their lineup is and because there are only eight real hitters to distribute credit to instead of nine, their studs must, logically and mathematically, be better than the Red Sox studs.
So when they’re priced the same, in cash games, you’re going to want to spend your premium bucks on the likes of CarGo and Arenado. That’s not to say Papi and Mookie don’t have a place in cash games (especially since we never actually have dead-on-equal team totals for both teams and since sometimes you can play them too), but when their lesser hitters like Bogaerts and Bradley are priced high, they certainly do not have a place. Playing Bogaerts or Bradley at the expense of CarGo or Arenado when the two teams project similarly is a terribly negative EV decision.
It will work out sometimes, of course, and give the illusion that the Sox are the better play. On good nights, they may not score 6 runs but instead 9 or 10 or 11, and because everyone is contributing, DFSers get tricked into thinking that playing Bogaerts or Bradley or Pedroia was smart. But from a probability standpoint, it just isn’t.
Xander Bogaerts, SS, Boston Red Sox
But Carty, hold the phone! You have Bogaerts listed with a .336 wOBA in that table. His wOBA is .368 this year! THE BAT is broken! And you look like Caitlyn Jenner!
First, mean. Second, yes, Bogaerts has a .368 wOBA this year, but that doesn’t mean he’s a true .368 wOBA hitter. He’s posted that number in just 425 plate appearances, and it’s a career high by a large amount. Plus, it’s being influenced by Fenway Park, which is obviously elite for hitting. The .336 number from THE BAT both strips out the effect of the park and accounts for variance. With a .363 BABIP, he’s certainly had some good variance. If you look at projections from other major projection systems, THE BAT is not alone on Bogaerts:
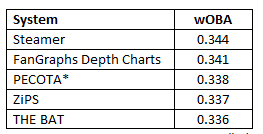
PECOTA doesn’t project wOBA, it projects a proprietary stat called TAv, which is the same concept as wOBA but scaled to batting average instead of OBP like wOBA is. This figure is PECOTA’s TAv scaled to OBP.
Across the board, every system is with THE BAT in viewing Bogaerts as a good but not great player. It likes him the least among the five systems, but by a negligible amount.
So when I say Bogaerts is overrated, guys, when I say that it’s inexcusable to play him for $4.8k in DraftKings cash games, guys… it is. There’s no question that it has worked out thus far; congratulations. Count your winnings, count yourself lucky, and adjust your process going forward, because the odds are against it lasting.

RISING… AND UNDERPRICED
Dylan Bundy, SP, Baltimore Orioles
Dylan Bundy has now made two starts since being shifted to the Orioles rotation, and he looked great in his most recent one against Cleveland. Bundy was once one of the top pitching prospects in baseball, but a series of injuries derailed his career before he finally reached the majors as a reliever. Despite those injuries, he still has very good stuff. He throws 96 mph on his fastball (even while working as a starter the past the two outings), he gets good velocity separation on his change-up, and he has a solid curveball that scouts say has plus potential.
THE BAT views Bundy as an above-average pitcher, yet his DraftKings prices have been just $5,500 and $4,700 in his two starts. He was still being stretched out and threw 70 and then 87 pitches in those starts, so he wasn’t an option, but he should be capable of approaching 100 in his next one, putting him solidly into play in good matchups as an SP2.
Because Bundy is an extreme flyball pitcher and calls homer-friendly Camden Yards home, you’ll need to pick your spots with him. Ideally, you’ll play him on the road against flyball teams (flyball pitchers fare better against flyball hitters, believe it or not). This week he’s at home, but he does get a Rockies team away from Coors, so it’s possible he’ll be an option, in GPPs at the very least.