2018 Risers and Fallers: Volume 5

Welcome back to another season of Risers & Fallers! Last year in this space, I turned you onto first-half Alex Wood because of his increased velocity and incredible curveball pitch tunneling. I told you Justin Verlander would be fine. I told you Seth Lugo’s insane curveball spin rate didn’t make him a good pitcher and that Aaron Nola’s low swinging strike percentage didn’t matter.
This is where I dive deep into the numbers and the narratives and see what’s real and what isn’t using advanced metrics, my DFS projection system (THE BAT, available in the RotoGrinders Marketplace), and insights from my scouting background. I’ll examine guys whose stock is going up, guys whose stock is going down, guys who are perpetually underpriced or overpriced, guys who are worth paying a premium for, or guys who are just interesting and warrant some analysis on.
Rising… and Probably Very Overrated
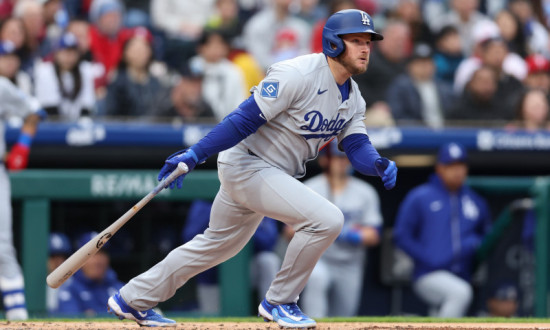
Max Muncy, IF, Los Angeles Dodgers & Everyone Else Having a Breakout 2018 Season
I was ruminating on THE BAT Podcast recently that we’ve reached a point in the season where, despite the early season fish leaving the DFS pond, we begin to see additional edge being created for those who follow a strong process. We’re three months into the year, just having passed the 50% mark, and it’s about this time that people start to say to themselves, “Hey, we’ve got a pretty big sample size now, I’m going to start buying heavily into Player X’s breakout. He looks real to me!”
Recency bias has always been the single greatest creator of inefficiencies in DFS, and it’s this time of year that people trick themselves into thinking that recent data is more valuable than it actually is. People have seen a guy hit or pitch a certain way for months, and since they’ve been watching it with their own eyes as recently as yesterday, that has to be who a player is now, right? If you’ve been following me for any length of time, you know that the obvious (and correct) retort is, of course, “No. That’s wrong. Duh.” Tests have definitively shown that using past data will always improve the accuracy of player projections, on the whole. People are prone to biases, though, and the human brain doesn’t always give the optimal amount of weight to things that happened, in its estimation, “too long ago.”
I was curious just what the extent of this sentiment is, so I ran a Twitter poll last week.
data-lang=“en”>We’re halfway through 2018. When judging an MLB player’s talent level, how much do you care about what he did in previous years compared to what he’s doing in 2018?
— Derek Carty (@DerekCarty) June 27, 2018
One in 10 people said that by this point in the season, they don’t consider anything from 2017 or prior whatsoever. More than half answered that they only use past stats “a little” or not at all. This meshes perfectly that people place too little emphasis on past data. And those who saw the poll and responded are those who follow me—one of the most statistically-leaning analysts in DFS. The
general population, with a greater proportion of BvP truthers and Lefty Masher mistakers and generic hot takers, likely leans even stronger to this end of the spectrum.
Back before the dawn of DFS, I was a season-long fantasy analyst managing the fantasy section of The Hardball Times (which you may now recognize as the nerdier branch of FanGraphs). In my time there, I worked with John Burnson, one of the all-time fantasy greats. Among other things, John ran a great magazine called “Heater” and developed xERA, BaseballHQ’s version of FIP in the early days of ERA estimators. While working together at THT, Burnson came up with a cool concept that I’ve been turning over in my mind a lot recently, called Near-Sighted Projections.
This seems like a perfect construct to evaluate the phenomenon at play in my Twitter poll. Very few DFS players are dumb enough to ignore past stats entirely—and so focusing only on 2018 stats will overstate the effect—but the majority place much less weight on them than a true, accuracy-optimizing projection system will. Most also don’t take stats completely at face value, and so some regression is also warranted. Therefore, what I’ve done is create a “Near-Sighted” version of THE BAT. It includes all the bells and whistles of THE BAT—regression, aging curves, context adjustments, hard contact, sprint speed, etc.—but with the weighting scheme changed. Instead of using the optimal number of years the optimal weight to give each year, as THE BAT does, Near-Sighted THE BAT gives 2018 data a weight of 80%, 2017 a weight of 15%, and 2016 a weight of 5%. In theory, this should give us an easy apples-to-apples comparison to see which hitters are being overvalued and which are being undervalued by DFS fish.
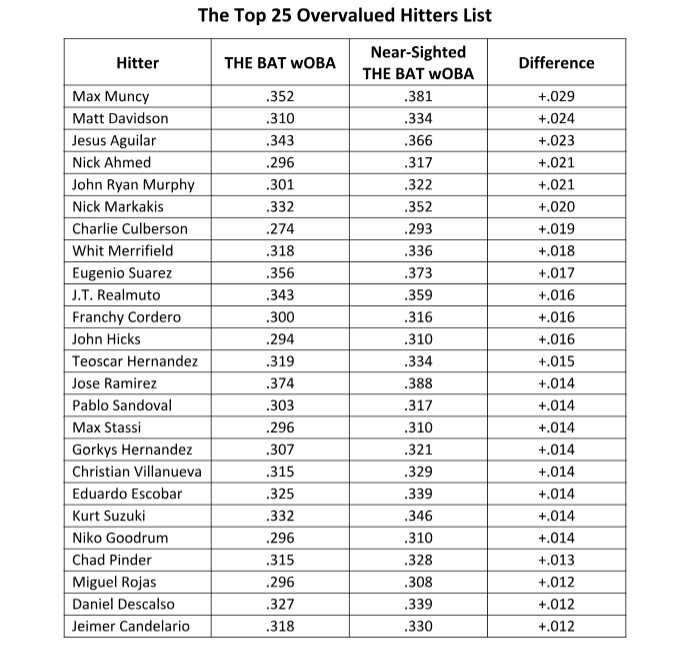
The top of the list is Max Muncy, which is not much of a surprise. Muncy has been tearing the cover off the ball in 2018 after years of mediocrity. He has hit 20 home runs with a .439 wOBA—rates he’s never achieved even in the minors. Clayton Kershaw went as far as to call him the best hitter in baseball recently.
data-lang=“en”>Lol. No. Love you, Kersh. But no. https://t.co/GUJAObfM10
— Derek Carty (@DerekCarty) July 5, 2018
Needless to say, I (and THE BAT) do not agree. If you find yourself playing Muncy and the other guys on this list frequently in your DFS lineups, you too are guilty of engaging in recency bias and may struggle to be a profitable player.
J.R. Murphy is another great example. He was overwhelming chalk against Wei-Yin Chen a couple weeks ago for absolutely no reason other than recency bias. Murphy was bound to get worse, Chen was bound to get better, and it was a hugely negative park shift for Murphy on top of all that. Needless to say, THE BAT hated him. I wound up eating the chalk that day like a donkey while THE BAT’s preferred catcher plays ran circles around Murphy’s measly 3 DK points. If you were smarter than me and listened to THE BAT, it’s this kind of thing that really does create free edge at this time of year.
Before we move on to the Undervalued List, industry friend Adam Scherer (aka ShipMyMoney) of FanVice made a good point in response to my Twitter poll that should be acknowledged: that we have a plethora of information and advanced data at our disposal these days, more than we’ve ever had before, and this information can help us identify players who have made legitimate changes and may legitimately outperform a standard projection.
If you’re going to engage in this type of “let’s-see-if-I-can-find-something-that-proves-this-guy-is-an-outlier” analysis, though, there are a few things you should make sure you’re doing. Most importantly, make sure that whatever evidence you’re using isn’t prone to variance itself. “Ooooh Player A’s breakout is legitimate because he’s making more hard contact this year!” That’s cool and all, but hard contact works the same as strikeout rate, walk rate, BABIP, etc.: it too is more accurate when you use multiple years, and it too is prone to variance and needs to be regressed.
You also have to realize that even if a player has made a legitimate change that we think is going to stick, we STILL can’t take what he’s done at face value because we’re still dealing with a small sample size that is prone to variance. Early in the year, people thought Gerrit Cole was one of the absolute best pitchers in baseball because he was using his curveball more. When I ran the math, I found that increased curveball usage couldn’t possibly account for the monster gains he had made. I took a lot of heat for that take (which really shouldn’t have been a very hot one), and—no surprise—Cole has regressed hard. His 2.35 xFIP in April has fallen off to 3.43 since the start of May. He’s been good but not great, which is exactly what the math said he should be.
Our goal should ALWAYS be to estimate a player’s true underlying talent level, and while analysis like this can sometimes help us in that regard, assuming that a player is exactly as good as his current season numbers say he is simply because he’s changed something and because you don’t want to trust last year’s numbers will ALWAYS be a terrible of way of estimating that talent level.
Muncy has made some legitimate mechanical changes to his swing, as noted recently by Jeff Sullivan at FanGraphs. It’s very possible that projection systems are too low on Muncy. But if you think he’s truly the .439 wOBA hitter he’s been to this point in 2018, you’re just wrong.
Alright, onto…
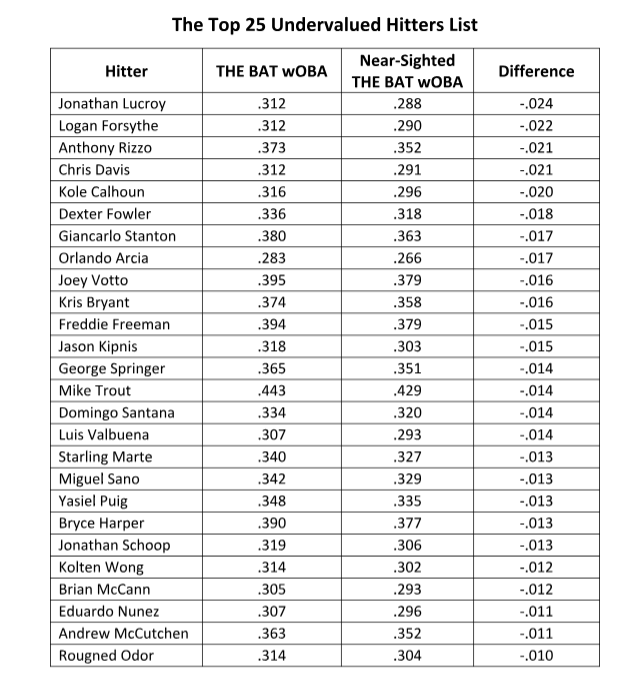
The overwhelming theme of this list is “Stars”, which I wasn’t expecting, but when you think about it, it makes a lot of sense. It also teaches us two very valuable lessons:
1) If you take the same recency bias that makes people want to believe in the Max Muncy and J.R. Murphy’s of the world and apply it uniformly to all players, you wind up disliking players that we know are great just because they haven’t performed at their usual elite levels for a couple months. If overweighting 2018 data makes stars look worse than we know they are, doesn’t that have to mean overweighting 2018 data makes breakouts like Muncy look better than they actually are?
In doing so, you wind up going so far as to actually liking Max Muncy more than established stars like Anthony Rizzo, Giancarlo Stanton, Freddie Freeman, Kris Bryant, Bryce Harper, and George Springer (his Near-Sighted .381 wOBA is the best of the group). As great as Muncy has been, I don’t think there’s anyone (except maybe Clayton Kershaw) who thinks he’s actually a better hitter than any of those guys. But if you’re buying into Muncy based on his recent sample and applying the exact same logic to everyone else, you have no choice but to think he’s better. This should be overwhelming evidence that overweighting recent stats is bad.
2) Restricting yourself to so little data by underweighting historical data makes it much more difficult to give players truly great projections. While Rizzo, Harper, Stanton, etc. have struggled this year and make sense on this list, Mike Trout is having the best year of his career and yet makes an appearance on this list. Why would a Near-Sighted Projection like career-year-Trout less than a normal projection would? It took me a second to figure out why, but it’s because focusing so heavily on 2018 data necessitates using a smaller total data sample, which winds up regressing Trout harder than a normal projection does.
The obvious retort from the non-math/recency bias crowd would, of course, be something like “sample size is stupid and regression is stupid, just look at what he’s actually done.” And yes, if you don’t regress Trout, you still think he’s great. The problem, of course, is that means you have to take guys like Muncy at face value too. Now, not only are you now thinking Muncy is better than Rizzo, Freeman, Harper after Lesson 1, but now you’re putting him on par with Trout since both have wOBAs around .440 this year. You take Muncy and I’ll take Trout and we’ll see who winds up better at the end of the year. (I’ll give you a hint: it’s Trout).
Closing Thoughts
All told, to get the most accurate view of the entire MLB population, you have to regress and you have to include data from previous years without underweighting its importance. You know what that describes? A projection!
The most striking thing I’ve noticed about all of this, though, is that THE BAT is actually the high man on most of the “Overvalued List” guys compared to other projection systems. Systems like Steamer, ZiPS, and PECOTA like Muncy, Davidson, Aguilar, J.R. Murphy, etc. much less than THE BAT does. Go to FanGraphs and see for yourself. Steamer thinks Muncy is a true .327 wOBA hitter—i.e. a barely above average hitter. THE BAT thinks Muncy is a true .355 wOBA hitter—i.e. a very good hitter—and he has not showed up in a single optimal lineup on a normal slate this year!
So if 1) THE BAT is the most optimistic out of all of the top-tier projection systems created by the smartest sabermetricians in the public sphere on these guys, yet 2) still rarely recommends playing them, but 3) the majority of DFS players view these guys as being even better because of Near-Sightedness, then 4) that’s a HUGE FREAKING INEFFICIENCY!
Don’t follow the herd. Let them wander off aimlessly. Instead, take a calculated, measured approach and leave them to wonder, “How come I’ve lost so much money in July? I’ve been playing great hitters like J.R. Murphy and Jeimer Candelario almost every day! Ehh, must just be bad luck.”