NFL Millionaire Maker Ownership Review: Divisional Round

Welcome to the Divisional Round ownership breakdown of DraftKings’ Millionaire Maker ($100 Buy-In). I analyzed the data of all DFSers who submitted 50+ lineups into the big GPP (pros) and compared them against the field, with the analysis focusing on players that were “make-or-break” options.
With over $5,000 at stake, what key players did the pros hone in on and which ones did they fade? The ownership percentages are displayed as an average between all the top players as well as the peak of a single player’s lineups.
Quarterback
1. Carson Palmer $6,500, 26.96 points (38.0% owned)
Pros’ average ownership: 29.9 percent, Peak ownership: 100.0 percent
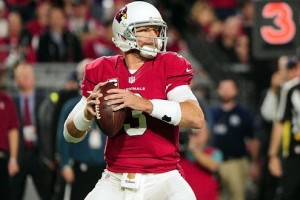 Carson Palmer had been a potential MVP candidate all year long, averaging 21.8 DK points per game, and produced against even the most intimidating defenses. Although Green Bay had been ranked #6 in pass DVOA, early in the week their top cornerback in Sam Shields was highly questionable. As the obvious chalk of the week, Carson was an easy grab-and-go due to the wide range of targets he had in Larry Fitzgerald, John Brown, David Johnson, and Michael Floyd. The pros decided to fade him slightly while increasing their exposure to other quarterbacks a few % across the board. Carson had only averaged 13.6 points over the last three weeks (17.6 points against GB) and looked to be off his game. Having more exposure to Tom Brady, Cam Newton, and Russell Wilson, who had higher ceilings than Carson, would allow the pros to get a jump on the majority of the field if they produced more than expected.
2. Peyton Manning $6,000, 10.78 points (12.1% owned)
Pros’ average ownership: 8.5 percent, Peak ownership: 28.8 percent
Besides Carson Palmer, Peyton was the only other starting quarterback to have less pro exposure than the field. People may have been thrown off by the fact that the Broncos had been projected to score a reasonable point total (24 points; 1.8 above season average) with a beat-up Peyton at the helm. However, looking at his history this season, Peyton had only broke 20 points twice and was routinely averaging less than a 3x return. Peyton simply did not have the ceiling this season that would be typical of winning the Milly Maker as the Broncos had been intent on running the ball and limiting Peyton’s mistakes (30 rushes in Week 17). As Peyton was still priced $6000 and had only averaged 11.4 points on the season (1.9x), he would literally need to go back in time in order to provide GPP value (5x).
Running Back
1. Spencer Ware $4,500, 0.0 points (5.6% owned)
Pros’ average ownership: 1.5 percent, Peak ownership: 20.0 percent
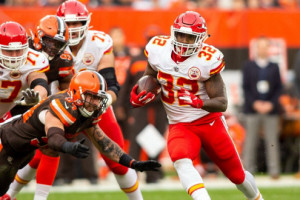 Ware had been banged up from the Wild Card round versus the Houston Texans and was held out of practice Tuesday & Wednesday, while being limited on Thursday. While he had been outproducing Charcandrick West over the last few weeks, his usage was a concern due to the potential negative game flow. The Patriots offense had looked lackluster at the end of the season but would have Edelman returning and plenty of playoff experience. West had been seeing the passing down work and the Patriots were favored at home by 5.5 points. Although Ware had been declared active for the game ahead of time, the concerns over limited usage due to his injury and negative game flow severely limited his exposure.
Wide Receiver
1. Doug Baldwin $6,800, 16.2 points (27.4% owned)
Pros’ average ownership: 18.8 percent, Peak ownership: 70.8 percent
Baldwin had returned to reality over his last two weeks after breaking his streak of catching 11 touchdowns in a five-week period. While we didn’t expect Baldwin to keep producing at that pace, he had proved to be a key cog on the Seattle train that was full steam ahead into the playoffs. Although the Seahawks were projected to score 20% less points than their season average, it was quite average for the tough playoff slate. Baldwin was still a decent play for cash games due to his quantity of targets, but Carolina had held the #2 overall pass DVOA rank and were more susceptible against the deep routes (#2 short pass DVOA by a good margin over #3; #5 deep pass DVOA but closer to average). Over the last two weeks, Baldwin had only seen 1 red zone target combined and was slated to see even less red zone work with Beast Mode available.
2. John Brown $5,200, 13.4 points (21.6% owned)
Pros’ average ownership: 35.2 percent, Peak ownership: 89.6 percent
While John Brown had been only one of the many bullets in the game of Russian roulette for opposing defenses, recent game production had pointed to his continued high usage through the playoffs. As the Cardinals/Packers game was the highest game total of the slate and the Cardinals were projected as 7.5-point favorites, exposure to each side’s air game was a must for a game that would be settled between two of the NFL’s best quarterbacks. The Packers played tight in the slot (#5 short pass DVOA) and against quick routes while giving up more to the deep ball (#14 deep pass DVOA). Brown had out-targeted the others over the past three weeks with 24 (Floyd: 20, Fitz: 17) and was second of the group with 3 red zone targets (Floyd: 0, Fitz: 5). While Brown was still owned less than Floyd across the board (Michael Floyd: Public – 40.3%, Pro – 38.9%), he was targeted by the pros nearly as much due to his recent usage.
Tight End
1. Greg Olsen $6,900, 19.7 points (48.8% owned)
Pros’ average ownership: 35.1 percent, Peak ownership: 82.2 percent
 As one of the top two tight end plays of the weekend, there were plenty of reasons why Olsen made a noteworthy pickup as he was still widely played by both the public and the pros. Olsen had put a beating on the Seahawks in Week 6 to the tune of 131 yards and one touchdown on seven receptions (29.1 DK points) in their house. However, this last week, the Panthers would play at home and while Seattle boasted the #3 overall rush DVOA as well as #3 overall pass DVOA, they fared just #26 in DVOA against the tight end position. Outside of two games against the Saints wet paper bag defense and the last matchup versus Seattle, Olsen had only produced a ceiling around 20 DK points. Due to the Panther’s often limited passing game and penchant for getting up big early, the pros decided to flex the tight-end position less overall (Public: 18.2%, Pros: 9.6% of TE in the flex position) and instead play the injury fill-in wide receivers who would be capable of putting up higher multiples/ratios: Martavis Bryant and Jared Abbrederis (Public: 59.5%, Pros: 72.9% of WR in the flex position).
Defense & Special Teams
1. Arizona Cardinals $3,800, 4.0 points (22.6% owned)
Pros’ average ownership: 12.6 percent, Peak ownership: 40.7 percent
Just three weeks before this game, Aaron Rodgers had lost to Arizona in their house to the tune of three fumbles, one interception, and two defensive touchdowns (33 DK points). However, since that point, the Cardinals had been torched by Seattle (Defense: -3 DK points) and Aaron Rodgers had looked more competent versus the Vikings and Redskins. The Packers were still projected to score 21 points, which was only two points below their season average, against the Cardinals D that was ranked the #4 pass DVOA and #2 rush DVOA during the regular season. ARod was looking to be in playoff form and would not allow the Cardinals to the best of him again.