Risers and Fallers: Volume 12

I’m excited to be back for another week of Risers & Fallers! Each week, I’ll break down a handful of players using advanced metrics, insights from my scouting background, and my DFS projection system THE BAT (available in the RotoGrinders Marketplace), which consistently beat Vegas lines last year.
I’ll examine guys whose stock is going up, guys whose stock is going down, guys who are perpetually underpriced or overpriced, guys who are worth paying a premium for, or guys who are just interesting and warrant some analysis on. If you guys have any suggestions for who you’d like to see in future articles, feel free to let me know.
Rising… But Not As Much As You May Think
Hitters against the White Sox and their terrible bullpen (and hitters against “Bullpen Days”)
The White Sox entered rebuilding mode this past off-season as they parted ways with Chris Sale and Adam Eaton. They continued this summer, peeling off Jose Quintana, Todd Frazier, and Melky Cabrera. If you’re a fan of the team, you should be downright giddy, because this is how you rebuild the right way. You spin off whatever isn’t nailed down, and you get quality prospects in return (Dear New York Mets: learn from this). And if there’s one thing a team out of contention has no need for, it’s a good bullpen. Over the past few weeks, the White Sox have dealt four of their five most-used relievers this year (plus a midseason-acquisition-turned-closer)—not-so-coincidentally also their five best relievers.
While bullpens are still something of an underrated edge in DFS, they are starting to gain more notoriety, and a fire sale like this is bound to catch peoples’ eye. Here’s a look at what Chicago lost (including two relievers they lost earlier in the year to season-ending surgery):
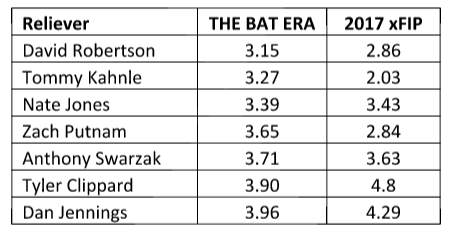
(THE BAT ERA is the pitcher’s projected ERA in a completely neutral context)
The arms the White Sox lost could not only make up a full bullpen, but it would be one of the best bullpens in baseball. Needless to say, when you lose seven pitchers of this quality, the guys you’re replacing them with are probably not very good. The best pitcher in the current White Sox pen is a man named Aaron Bummer, which speaks volumes; you’ve probably never heard of him or a single one of his ‘pen-mates.
As most would expect, THE BAT has the White Sox bullpen projected as the worst in baseball. What some might not expect, especially given how many arms they’ve lost, is that they’re only the worst by a couple points of ERA… and barely 0.30 points of ERA separates them and a league average bullpen.
Why is this? Well, there are elite relievers like Robertson, and there are good ones like Swarzak, but there are not as many bad relievers as most would think. The reason for this is because pitching out of the bullpen is the easiest job in the major leagues, and there are literally dozens of minor league pitchers who could come up to the majors right now and do just as good of a job as some of the current below-average relievers. Relievers are a highly fungible asset, and most of the time—unless a team is making a horrible mistake (which happens but is rare)—bad relievers simply lose their jobs and are supplanted by some faceless, below-average-or-maybe-borderline-bad-but-certainly-not-horrible replacement. Put another way: unless a major league team is going out of their way to create a bad bullpen, there is a floor on how bad a bullpen can be. Even most crappy minor league relievers aren’t all that crappy. So even when the White Sox lose as many good relievers as they have, the guys they’re replacing them with aren’t horrendous.
Okay, so what point am I trying to make? Following Chicago’s bullpen upheaval, I’ve heard several people talk about how easy it will be to pick on this bullpen in DFS. And while this is absolutely true (to an extent), and while bullpens should absolutely be a factor in projecting performance, it’s important to keep things in perspective. Not only are there not a lot of truly bad relievers (in the White Sox bullpen or otherwise), the standard for a “bad reliever” and a “bad starter” are quite different. Here are the average ERAs for starting pitchers and relief pitchers this season:
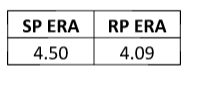
That’s nearly a half-point gap between starters and relievers. The number of bullpens with a worse ERA than a league average starter this year? Just six. And when you account for the variance in reliever data and some of the bad relievers who contributed to the worst team ERAs who have since been released or demoted, you’d be able to count the number of bullpens that are actually worse than a league average starting pitcher on just a couple fingers, if that. And it makes sense. Relievers pitch in shorter bursts and can throw more maximum effort pitches, so relievers (even weaker ones) should be better than starters on a per-inning basis, but this concept is lost on a lot of people.
Of course, when selecting DFS hitters you prefer to be facing a weak bullpen rather than a strong one; just don’t overestimate the “weakness” of the bullpen. If you’re playing hitters against James Shields, as bad as the Sox bullpen is, once he leaves the game the pitching quality drastically improves. Even if you’re playing against a better pitcher like Carlos Rodon or prospect call-up Reynaldo Lopez, once they leave the pitching quality probably improves slightly as well.
This is also the reason why it’s incredibly stupid for people to say, “Ooooooh, such and such a team is having a ‘bullpen day’ today, let’s pick on them!” No! No. Just no. Do not do this. I guarantee you there are starters on the slate that will be more favorable to pick on than a bunch of relievers. The standard for this is so low that this almost must be true on any slate. A starting pitcher need only be league average to be worse than practically any bullpen in baseball.
Context and perspective are crucial in DFS, and so I’ll end with one final stat about the White Sox bullpen. I mentioned earlier that the Sox pen is only .30 or so points of ERA worse than a league average bullpen. Spread out over the average number of innings a bullpen pitches in a game, we’re talking roughly about the difference between a 4.50 team total and a 4.65 team total, all else equal. That matters, of course (and the gap is larger between the worst bullpens and the elite bullpens and when weaker pitchers start the game and throw fewer innings than average), and accounting for bullpens properly conveys edge over the long run, but it’s not something to go crazy over. Like anything else, it’s one piece of information, and it needs to be viewed through the proper lens.

Rising… Slightly but Sneakily
Kansas City Royals Pitching
Kansas City’s workhorse catcher Salvador Perez went on the DL last weekend, and the team quietly (at least until his grand slam last night) called up non-prospect Cam Gallagher. Gallagher isn’t really notable from most DFS players’ perspective; he’s a horrible hitter (grand slam aside) and will almost never be rosterable. But the tangential impact he’ll have is worth noting. While Salvy and new starter Drew Butera are both below-average pitch-framers, Gallagher is a great framer, on the level of a Travis d’Arnaud or Russell Martin. He’s only started three games since joining the Royals, but it’s worth giving KC pitchers a small boost on days when he is behind the plate.
Rising…
The number of people who misunderstand sample size
If you haven’t yet heard, I’m getting into NFL this year! I couldn’t be more excited, especially because I’ll be debuting my new NFL projection system, THE BLITZ. (You can check out the specifics here.) One of the most common questions I’ve gotten from people is “how well does math and sabermetrics translate to NFL?” Or, from the more skeptical crowd, “Carty’s going to hate NFL because of the small sample sizes lmfao!!!!1” Anyone who says something like this, though, displays a blatant lack of understanding as to what sample size actually means, how it works, and how it helps us identify player talent.
Sample size is all relative. In baseball, 300 batters faced is a huge sample size for a pitchers’ strikeout rate, but it’s a tiny sample size for a pitcher’s BABIP. The thing that makes a sample size big or small isn’t the number itself. The number itself is meaningless without context, without understanding how much noise there is in the stat you’re looking at. BABIP is very noisy, while strikeout rate is very stable, and so the exact same number (300 batters faced) can either be big or small depending on what we’re talking about.
The people who say “NFL sample sizes are too small because there are only 16 games” simply don’t understand this. Sure, 16 NFL games is a smaller number than 162 MLB games in an absolute sense, but without knowing the variance and noise associated with those 16 games, calling it a “smaller sample” is completely baseless and potentially even wrong.
For one thing, “games” is the wrong denominator to use. In those 16 games, the top quarterbacks drop back to pass close to 700 times per season—about the same number of at-bats the top hitters take in baseball each year. For another, saying 16 games (or even 700 drop-backs) gives us literally zero information about the noise involved with football stats.
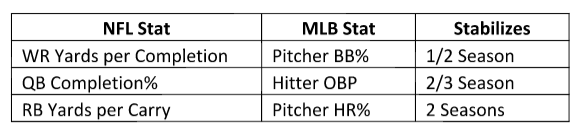
In baseball, the way we evaluate noise in various stats is by finding “stabilization points.” At this point in time, most reference the numbers at FanGraphs, although I’ve run my own and include them in THE BAT. I’ve done the same for THE BLITZ, and so I thought it might be helpful to show side-by-side parallels between a few baseball stats and football stats that stabilize at the roughly the same point to highlight that there really isn’t that much more noise in the NFL:
Sure, there are certain stats that are noisier than others, the same as in baseball. Running back touchdowns, for instance, are incredibly noisy and driven largely by opportunity instead of skill. Quarterback interceptions, interestingly enough, are also quite noisy, taking five or six full seasons worth of data to stabilize. But that’s okay. You simply account for the noise accordingly and realize that players with extreme values are likely getting lucky/unlucky and will regress—the same as we do with, say, a pitcher who has an abnormally high BABIP. If anything, having a few stats like this conveys an advantage over those who don’t realize that a certain stat is mostly variance.
And, of course, you NEVER have to wait for the entire stabilization time frame. This is one of the key points that non-math people just completely don’t understand about sample size and why they sound ridiculous when they try to talk about it. We don’t actually have to wait a half season before we can derive value from a pitcher’s walk rate or a wide receiver’s yards per completion. We don’t have to wait two years for a pitcher’s HR% or a running back’s yards per carry. It’s not some magic number that, once we reach it, now and only now can we trust what a player has done. Instead, we progressively believe it more and more the larger the sample gets, and the extent to which we believe it is driven by the stabilization point. Plus, THE BLITZ supplements its projections using things like scouting combine data so that if a player has other data to support performance over a smaller sample, THE BLITZ will buy into it sooner and more heavily.
If you were someone who was on the fence because you weren’t sure what kind of variance there was in NFL data and how that would translate to a projection system, hopefully this clarifies that for you and proves that it works quite easily. Or, if you were someone who just spouted off some nonsense without actually caring about facts or logic or whether you actually understand these things, well, you can suck it. There’s a bit more noise in NFL data than MLB (mostly because it doesn’t really have that super-quick-to-stabilize stat like strikeout rate or hitter home run rate), but the amount of noise is vastly exaggerated (or, perhaps more accurately, misestimated, since I’ve never seen this kind of analysis in the DFS space) by the DFS public. And that just conveys an advantage to a system like THE BLITZ.