Risers and Fallers: Volume 2

I’m excited to be back for another week of Risers & Fallers! If you missed last week’s opening article, go check it out to see why Alex Wood’s curveball is elite and why it makes him a top-5 pitcher in baseball.
Each week, I’ll break down a handful of players like Wood using advanced metrics, my DFS projection system (THE BAT, available in the RotoGrinders Marketplace), and insights from my scouting background. I’ll examine guys whose stock is going up, guys whose stock is going down, guys who are perpetually underpriced or overpriced, guys who are worth paying a premium for, or guys who are just interesting and warrant some analysis on. If you guys have any suggestions for who you’d like to see in future articles, feel free to let me know.
Rising… But With No Concrete Explanation As To Why
Zack Greinke, SP, Arizona Diamondbacks
“Greinke is back!” is something you’ll hear frequently in DFS circles these days. Except I’m not so sure he is.
By the numbers Greinke is, in fact, more than back. His 10.5 K/9 is the second-best of his career. His 1.7 BB/9 is the third best of his career. His 3.06 xFIP is the third best of his career. All at age 33, when pitchers are generally starting to enter the steeper part of their decline.
I had a reader ask me to examine Greinke in the comments last week, so I dug in… and I can’t explain why he’s doing this. The strikeout rate is the thing that pops out the most, particularly since Greinke has never been much of a strikeout guy. New catcher Jeff Mathis is a drastic upgrade over Welington Castillo in terms of pitch-framing, but that’s certainly not all of it, particularly when we see that the strikeouts are “supported” by 14.3 swinging strike rate—easily a career best and not attributable to framing. Most people don’t realize, however, that even swinging strikes have variance in them.
The common explanation is that Greinke’s slider is back to being elite, and if you look, he is getting many more whiffs on the pitch (49% this year compared to 36% last year). Problem is, the pitch hasn’t been better at any of the things that tend to lead to swings-and-misses on sliders. Its vertical movement is about the same (slightly worse). He’s getting less separation between his slider and fastball’s movement. The pitch’s tunnel is about the same. The pitch’s tilt is about the same. He’s keeping it low in the zone slightly more often, but that’s about the only thing that’s actually improved for Greinke’s slider from a saber-scouting perspective.

The bigger problem, though, may have been his fastball. By FanGraph’s pitch value numbers, hitters were teeing off on the fastball last year, but it’s back on par with 2015 this season. The problem? His fastball isn’t actually better this year than it was last year. It’s actually quite a bit worse thanks to a nearly 2-mph velocity loss. His spin rate is also slightly down. His tilt is about the same. He’s working it high in the zone less often, which is generally where the whiffs happen on fastballs. He’s getting more rise on the pitch this year, but that’s about the only thing noticeably better about it.
So what gives? Dave Cameron at FanGraphs recently attributed the success to hitters whiffing on the slider when it’s throw inside the strike zone. But if the pitch isn’t actually better, why are hitters swinging through it more often? The easier answer: variance.
Perhaps Greinke is doing something better in terms of his command or location or pitch sequencing—all things that are difficult to quantify. But of the things we can quantify, he’s not doing anything differently. That’s not to say that we shouldn’t give him credit for the numbers he’s put up, but buying into them completely would appear to be misguided.
If someone tries to tell you that Greinke is back to being a legitimate ace, even if they point to his swinging strike rate, ask them this: Why is a 33-year-old pitcher with declining stuff suddenly missing more bats?
In all likelihood, Greinke wasn’t as bad as he seemed last year, and he’s not as good as he seems this year. THE BAT projects Greinke for a context-neutral 9.0 K/9 going forward and as a top-25 pitcher from a true talent standpoint. Maybe he keeps up a top-10 performance, but there’s very little to suggest he will.
Dropping… But Not As Much As Most People Think
Justin Verlander, SP, Detroit Tigers
Verlander is pretty much the anti-Greinke. He had a big year last year but has really struggled so far in 2017. His K/9 is down from 10.0 to 8.6, his BB/9 is up from 2.3 to 4.3, and his xFIP is an awful 5.17. That being said, I see a lot of reason for optimism with Verlander, and THE BAT still views him as a top 15 starting pitcher. In fact, on a really weird pitching night last night, THE BAT liked him as the second best pitcher behind Chris Sale. He wound up being barely 5% owned in DraftKings GPPs but turned in a nearly 20-point game. For people who focus too much on this year’s stats, they’re missing opportunities like this. For those that don’t look beyond the surface, they’re misevaluating the talent levels of players like this.
One of the really cool features of THE BAT is that it accounts for all of the contextual factors that a player has faced when putting up his numbers. Verlander’s strikeout rate is down, but maybe he’s faced a set of circumstances that has been unfavorable for generating strikeouts. And, in fact, he has. Among all pitchers with at least 200 batters faced this year, Verlander has faced a set of batters with a collective strikeout rate that is tied for the third lowest in all of baseball. Here’s a chart with the ‘unluckiest’ set of opponents in terms of strikeout rate this year, scaled to league average:
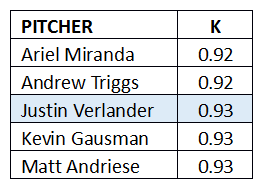
With league average being “1,” this means that Verlander’s opponents this year have struck out 7% less than if he’d faced an average set of opponent. For reference, Verlander’s set of opponents last year were exactly neutral at 1.00.
This kind of thing makes you reconsider something like swinging strike rate, which most would use to justify Verlander’s dropping K rate. Verlander’s swinging strike rate is down to 9% from 12% last year, but if he’s faced a set of batters that are less likely to swing-and-miss, we’d expect it to go down.
THE BAT doesn’t just run these numbers for opposing hitters, but it does it for the exact set of umpires, parks, catchers, weather, home field advantages, etc. that a pitcher has faced. Before projecting a player’s underling talent level, it then adjusts his stats to reflect what he’d do facing an average set of circumstances. In the case of Verlander, this is what happens to his strikeout rate (once again scaled to league average) as well as a few other key stats when you make that adjustment:
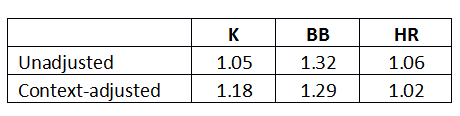
While Verlander has only been a little above average in terms of strikeouts overall this year, when you account for the unfavorable context he’s faced, he’s actually been quite good—and his walks and home runs should be a bit lower too. Now, this is stripping out the pitch-framing of Alex Avila and James McCann, both of whom are below-average and aren’t going anywhere, but Verlander almost certainly deserves a better strikeout rate than he’s posted to this point.

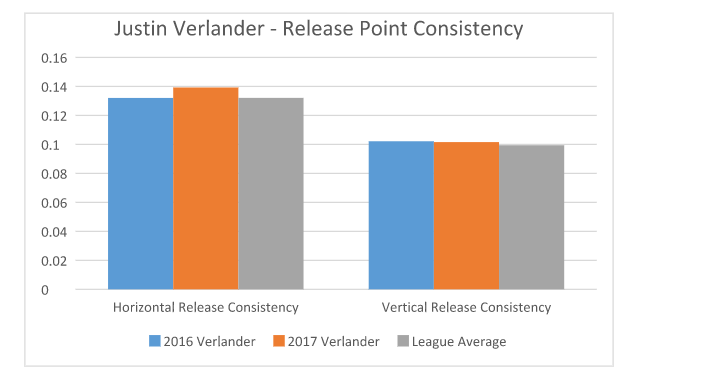
As far as his walks go, they’re still much higher than they were last year (0.78, context-adjusted) even after the adjustments. This is concerning, but not enough to make me take much pause. For one thing, Verlander has an entire career of above-average control and just 10 starts of it being bad. Not only that, but he’s showing very few of the signs that would make us worry that this will continue to be a problem. Walks are notoriously tricky to project since it’s often a sign of mechanics being off when a pitcher suddenly stops being able to find the plate, but Verlander is showing none of the primary indicators that something is wrong. One of the indicators of this can be release point inconsistency, but Verlander’s have been right in line with what he was doing last year and right around league average:
Additionally, while Verlander’s first pitch strike rate (62%) is down a bit from last year (64%), it’s right in line with his career (62%). Baseball Prospectus has a stat to measure pitcher command, estimating how often a pitcher will get a called strike (i.e. not a ball). Verlander’s last year was 46%, and this year it’s a bit better at 48%. And not only is his velocity is not down, which can sometimes indicate fatigue which can lead to loss of command, but it’s actually up half a mph.
Given all of the evidence and given the math involved with projecting players, there’s practically no reason to think that Verlander’s walk rate won’t come down (as historically it does in these situations, particularly given a lack of evidence to the contrary), as we saw it begin to last night when he issued just one walk against the Royals.
The final thing I want to point out about Verlander is manager Brad Ausmus’s willingness to let him go deep into games. When THE BAT projects a pitchers’ innings, it first projects his pitches, and it starts by establishing a baseline count for a pitcher. For Verlander, his baseline pitch count is the second-most in all of baseball, routinely going over 110 pitches. That extra inning makes a big difference from a points perspective, and it’s part of what makes Verlander project so well even if he’s not quite the same pitcher he was last year.
Fail to treat Verlander as an ace if you dare, but in good matchups that just means he’ll be lower-owned for the rest of us.