Risers and Fallers: Season Recap

Guys, I can’t believe we’re at the end of the season. This has been such an enjoyable year for me at RotoGrinders, and this column in particular has been a lot of fun. To wrap things up, I wanted to go over some of my best and worst calls this year, do a little bragging, give you guys one last chance to get some shots in on players I was wrong about, but most importantly, to go over some of the lessons we can take away for next year.
If there’s just one thing I can stress, it’s this: there’s a huge difference between what a player has done to this point and what a player will do going forward, and it’s easy to get lost in the moment, to believe what your eyes and what the numbers have been telling you in the most recent sample size possible, right now, and to treat it as truth.
I see this player making good contact and spraying the ball all over the field right now. I saw him do it today. I saw him do it yesterday. His numbers of late are excellent. How could I possibly think this player is anything different than what I’m seeing with my own two eyes right now?
It’s a difficult thing to take a step back from, to tell your eyes that they’re lying to you just because everyone’s least favorite middle school subject says otherwise. But math is impartial. On the whole, math is right far more often than your eyes are, especially if those eyes don’t have any type of special training. Just because we’re living something right now doesn’t mean it holds any more meaning than the decades of baseball that has already been played. This is a tough cognitive bias to acknowledge, but it’s the most important one to divorce yourself from.
BABIP Always Regresses
Time and again this year, I’ve said how the player du jour at any given time wasn’t actually as good as he’s been performing or as good as most DFS players were treating him. Each time, there would be those who would ridicule and try to justify why this player was different and why I was wrong. Usually, the argument consisted of the player’s season-to-date numbers, and in the case of most of these players, those numbers didn’t actually mean anything for DFS purposes. I don’t care what a player’s wOBA is; I care how the player arrived at that wOBA and in what kind of sample. A player who arrives at a high wOBA with lots of walks, limited strikeouts, and lots of home runs is likely to have a true talent close to that wOBA. A player who arrives at that wOBA based largely on hits on balls in play (BABIP) is very unlikely to be close to it.
We had quite a few players like this in 2016, and just as was the case in 2015, 2014, 2013, 2012, and so on, these players weren’t actually as good as everyone thought they were—as if these hitters playing in the present, right now, somehow makes them different from the historical players that showed us not to buy into this type of performance.
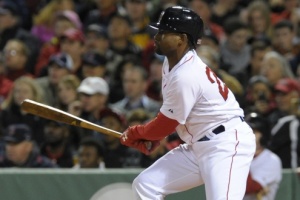
Jackie Bradley Jr., OF, Boston Red Sox
I found that it takes roughly two and a half years’ worth of data before we’d be able to use a hitter’s actual BABIP to predict his future BABIP better than simply assuming he will have a league average BABIP… Two and a half years before we’re able to do better than shrugging our shoulders and saying, “Eh, I guess this guy is okay.” That will be hard for some people to come to terms with, and there are some of you who will read this and write it off as not possibly be right, Carty’s an idiot, but it is 100% true…
If we were to look at JBJ’s .394 BABIP in 168 plate appearances and consider that it takes roughly 1500 plate appearances before that .394 BABIP would hold as much predictive value as a league average .295 BABIP, our best guess as to JBJ’s underlying BABIP talent would be comprised of 10% JBJ and 90% league average. Calculate it out, and you get .305…
Many will point to Bradley’s [.428] wOBA and try to call him a great hitter now, but those who do that will be wrong, because they’re ignoring how that wOBA was arrived at—namely, by way of a type of performance that we can believe very little about given the sample size.
That .305 BABIP the math told us was closer to JBJ’s talent level? The one that JBJ devotees would have quite literally laughed in your face if you tried to sell them on? It was higher than JBJ’s actual BABIP the rest of the way. (And ironically enough—because sample size—it’s likely that JBJ actually underperformed the rest of the way, especially once you factor in BABIP-inflating Fenway Park).
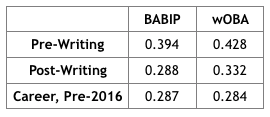
Xander Bogaerts, SS, Boston Red Sox
For no player did I draw more ire this year than Bogaerts. I called him overrated on a semi-weekly basis, and it was everyone’s favorite game to try and show me how he was actually the second coming of Ted Williams. Groupthink and the ignoring of math doesn’t change probability, though, and the probability was strong that Bogaerts was playing over his head:
Many are treating Bogaerts as a stud based on his .393 wOBA, but… a big part of it has been a .409 BABIP… We simply can’t trust that number on its face, especially since Fenway Park is the second best in baseball for BABIP. (But before you use that as a reason why it’s legitimate, citing the high BABIPs of other Red Sox for additional support, know that those guys are also overachieving. At most we could expect 20 points of BABIP to be added by Fenway, and even that might be a bit generous…)
There’s no doubt that Bogaerts is a good hitter, but he’s not a great one. I’m not paying over $5,000 for him on DraftKings or $4,000 on FanDuel when I can pay less for a better shortstop like Carlos Correa or Corey Seager (or Trevor Story in Coors, once he starts hitting again) or just punt the position.
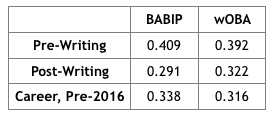
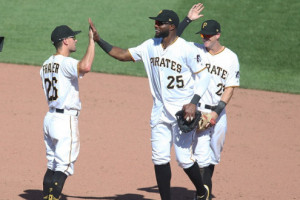
Gregory Polanco, OF, Pittsburgh Pirates
His [.392] wOBA is largely BABIP driven, given an unsustainable .358 BABIP, which is well above the .308 and .272 marks he posted the past couple years. He’s shown more power, which is great and more believable than the BABIP, but priced as a top 10 or 15 outfielder most days is ridiculous. He’s above average. There is certainly upside, and the possibility certainly exists that what he’s doing is more real than we can say it is statistically. He was an elite prospect coming up through the minors and still has that pedigree and those tools, but it’s insane to buy into them as much as most people are.
It seems like perhaps people are deluding themselves based on certain misunderstood statistics. Polanco has an excellent 28% line drive rate, and his hard hit rate is up five points to 35% this year. The line drives explain the high BABIP, since they fall in for hits at over a 70% rate, but they’re not actually a very stable skill. It takes close to two years’ worth of contact balls for them to “stabilize,” whereas balls like grounders or flies take a fraction of a single season. If you’re believing the BABIP based on the line drives, you’re making a mistake. And hard hit rate, while more stable, still has variance, and Polanco’s [hard hit rate] is only a bit above average anyway—which [is what] he is [overall]. But it’s not great. And he’s not great.
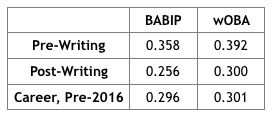
Polanco is an example of the “pedigree trap.” Just because a guy was a top prospect and is now raking doesn’t mean that we should automatically buy into what he’s doing. It’s also important to realize that many of the stats most people use to legitimize a new level of performance are prone to variance themselves and should never be blindly taken at face value. Polanco’s 2016 power surge is real, and the BABIP will rebound from the post-writing value, but it should never have been believed in at the pre-writing rate.
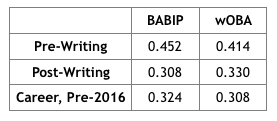
Nick Castellanos, 3B, Detroit Tigers
Good ‘ole Nick has been hitting up a storm this year—.419 wOBA,.376 batting average—but I’m not buying it. Nick comes with a good pedigree, but his performance is being driven almost entirely by a .452 BABIP…
The broadcasters on Saturday were saying how his success could be traced to an improvement in his approach. Nick has always been a free-swinger, but they mentioned how he’s been more focused in his approach this year, channeling that aggression into good swings in the zone with fewer out of the zone. Unfortunately, this doesn’t actually hold up when we look at the numbers. There’s very little difference in either his in- or out-of-zone swinging stats this year, and he’s actually making less contact in the zone. I can see Nick improving to be a 20-HR per-year player, but the batting average and general production is coming way down.
Bullpens Are Dynamic
There were no two bullpens that I took a bigger stand on this year than the Royals and Rangers. Despite the Royals ranking as one of the best and the Rangers ranking as one of the worst mid-year, I made bold claims that the two would essentially switch places. First, the Royals:
I mentioned on GrindersLive… that the Kansas City bullpen… is highly overrated, especially now that Danny Duffy has been moved to the rotation. Kansas City has been renowned for several years now as having the best bullpen in baseball, so of course this was met with comments in chat about how ridiculous this statement was along with the stray attack on my intelligence and manhood…
There’s no question that Kansas City’s best guys are elite… [but] KC’s best relievers are still only used about 40% of the time, on the whole. And outside of their top three, all they have are mediocre and worse pitchers…
The Royals may lead baseball with the best bullpen ERA, but this is a wholly mediocre pen in my opinion with the ability to be awful in the right game conditions. I’m certainly not scared to play hitters against it.
And the Rangers:
When you hear touts talk about road hitters in Arlington, they’ll mention the park or the heat, they’ll mention Martin Perez or Nick Martinez, and they’ll often throw a passing mention to the “terrible Rangers bullpen…” The Rangers have used 19 different relievers this year, all of which combine for those bottom-dwelling rankings. They currently have just seven active relievers, though, having waded through a bog of turds to settle on a group that is actually quite good… all of the arms that sank their ranking to the basement, led by former closer Shawn Tolleson and his 7.68 ERA, have now either been demoted or released.
There aren’t any household names, but there are a bunch of really solid pitchers and several downright good ones. There’s not a single below-average pitcher in the bunch. Shoot, there’s not even a pitcher as bad as average in the bunch. We’re not looking at smoke and mirrors either. Both the xFIPs and the true talent projections from THE BAT back up the excellent ERAs…
Despite having a reputation as one of the worst bullpens in baseball, Texas may very well be the best (or at least right up there). And that is a perfect example of why judging teams by their seasonal numbers can lead to some very erroneous conclusions.
So how did these bullpens wind up?
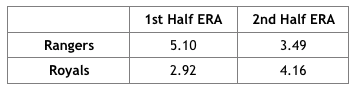
Exactly as expected.
Bullpens are difficult to evaluate. Even casual DFS players know the names of most starting pitchers because they take the mound every fifth day and we either want to play them or play hitters against them. But relievers are in the background. Their names don’t appear on Probable Pitcher lists, and even the elite ones (unless they’re closers) don’t get any media attention. Each bullpen consists of six or seven relievers, some used more frequently than others, and those six or seven are often shuffled and replaced by new relievers.
Most DFS players, if they consider bullpen at all, just look at the overall numbers for the bullpen and call it day. As I showed this year with the Royals and Rangers, though, the composition of the bullpen is hugely important. The Rangers wound up with the fifth-best xFIP in baseball in the second half of the year after holding the second-worst xFIP in the first half. The Royals, despite an almost mythical reputation and excellent first-half numbers were wholly mediocre—as should have been expected after looking under the hood—in the second half.
Minor League Numbers Are Important
Corey Seager, SS, Los Angeles Dodgers

I was calling Seager one of the top shortstops in baseball back when his batting average was hovering around .250 and his wOBA was barely over .300:
Seager… seems to be getting lost in the shuffle this year. Coming into the week he had just a.317 wOBA, but I’ve long been saying that this is bound to go up. Outside of the series in Coors, the Dodgers have played in a grand total of ONE hitters’ parks and ONE neutral park… Here’s a list of THE BAT’s favorite shortstops in terms of true talent context-neutral wOBA:
1) Carlos Correa
2) Troy Tulowitzki
3) Corey Seager
Ryan Schimpf, 2B, San Diego Padres
[Schimpf] is 28 years old and was signed this past winter by the Padres as a minor league free agent. He just saw his first ever major league at-bat this week, but honestly, I’m surprised it’s taken so long. His minor league numbers are ridiculous, as he’s the owner of a career wOBA around or over .400 at both Double-A and Triple-A. Not only that, but he pairs power with solid plate discipline, and even once you account for the easier competition in the minors, THE BAT still views him as an above-average major league hitter.
That was my write-up, and I continued to sing the praises of a no-name non-prospect on GrindersLive even while he posted a .235 wOBA in his first two weeks in the majors, to the jeers and laughter of chat. The track record indicated a better hitter, though, and Schimpf went on to dominate. He was routinely priced over $4,000 on DraftKings by the end of the year.
Travis Jankowski, OF, San Diego Padres
Jankowski’s occasional starts have been a little less occasional lately, finding his name on the lineup card on Wednesday, Saturday, and Sunday. Best of all, when he plays, it’s out of the leadoff spot. He’s hardly a household name, which might be why he was barely 10% owned on DraftKings on Sunday despite a great matchup and a $3,200 price tag.
Make no mistake, though, he has serious fantasy appeal… mostly due to his serious wheels. On Sunday his 70-grade speed allowed him to leg out a triple on a routine ball to left field that would be a double for most. He already has six steal attempts in just 31 plate appearances, and THE BAT has him projected to attempt the 11th most steals of second (in a neutral environment) of any active major leaguer—sandwiched between Jarrod Dyson and Eduardo Nunez. And the best part is that steals tend to go up in lower scoring environments as managers try to manufacture runs, which is often the case when the Padres are on the field. In a year where steals are down overall, a guy like Jankowski is very appealing when he’s leading off in good matchups.
Jankowski, of course, went on to steal 30 bases (10th most in baseball) in just 383 PA.
The lesson here is this: if all we focus on is major league numbers, especially when a player hasn’t accumulated very many at-bats yet, we can miss out not only on good players but on stars.
Sometimes Good Minor League Numbers Don’t Translate
Of course, the context of minor league at-bats are different than major league at-bats, and sometimes they don’t translate. THE BAT makes a lot of adjustments to account for this and doesn’t give MiLB stats the same amount of weight as major league stats, but this will always be an imperfect science. Pitchers may throw their weaker pitches more in the minors to work on them. Batters may have holes in their swings that minor league pitchers aren’t able to exploit the way major league pitchers are. On the whole, using minor league stats improves accuracy, but sometimes things don’t work out.
Gary Sanchez, C, New York Yankees
Sanchez has been considered one of the top catching prospects in baseball for a couple years, although he’s far exceeded any expectation thus far. Sanchez has 6 home runs and a .495 wOBA in just 62 plate appearances, which is obviously unsustainable. In Triple-A this year, he had just 10 homers and a .361 wOBA in 313 plate appearances.
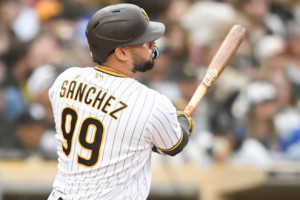
On the scouting side, Sanchez is considered to have plus-plus raw power, but it hasn’t translated into monster in-game power in the minors. That pretty-good-but-not-great total from Triple-A this year is pretty indicative of his entire minor league career, which leaves us asking ourselves what we’re seeing: some good luck, or a player making good on his underlying skills. Sanchez is certainly hitting the ball hard (41% hard contact rate) and far (five of his six HRs have gone over 400 feet, with his furthest at 437 to dead center), and it’s worth noting that he played in a park at Triple-A the past couple years that depresses home runs and played in the more pitcher-friendly International League.
So what do we expect of Sanchez going forward? THE BAT looks at him as an above-average hitter and a well above-average hitting catcher, even without buying into his crazy start in the majors.
It’s going to be really interesting to see what Sanchez does next year. His power, which is normally very stable, far exceeded what he did in the minors, but his scouting report always suggested this was a possibility. His wOBA fell back to almost exactly what THE BAT thought he should be (.342) after his hot streak ended, but he still paced 40 homers per 600 PA from that point forward.
Yulieski Gurriel, 3B, Houston Astros
Since so few Cubans have made the transition to the majors, it can be difficult to project what they’ll do in Major League Baseball. For every Yoenis Cespedes and Jose Abreu, there is a Hector Olivera and Rusney Castillo. However, scouts rave about Gurriel’s ability. He doesn’t offer immense power, but he does have a little. What he does best is generate great bat speed with good plate coverage, and he has solid plate discipline. He won’t draw a lot of walks, but he won’t strike out much either. Playing in his final season in the Cuban National Series, he struck out just three times in 212 plate appearances. Yes, three times. Total.
Taking his Cuban stats (and his year in Japan) into account, THE BAT views Gurriel as a well above-average hitter right now.
Gurriel wound up with a weak .292 wOBA despite great numbers in Cuba. Cuban stats are even harder to translate than American minor league stats, but this is still definitely a whiff.
Sometimes I’m Wrong
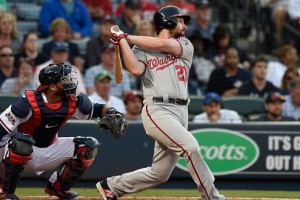
Daniel Murphy, 2B/3B, Washington Nationals
And because it doesn’t seem fair to only highlight the hot takes I was right about (even in the name of highlighting concepts that are important to take away), there were certainly plenty that I was wrong on. It doesn’t seem right to deny you guys one last chance to heckle me about some of my worst calls of the year.
The Washington Nationals have two players that hit in the top five and qualify at both second and third base. One has a career .330 wOBA. The other has a career .336 wOBA. The one that’s the better hitter bats second in the order. They are similarly priced. Yet somehow, the lesser hitter in the lesser lineup position consistently goes much higher owned. Murphy has been raking this year, which likely has something to do with it, but even before that bias was established, he was still more popular in the early days of the season.
The difference between second and fifth is an extra third of a plate appearance per game and 34% more RBI and run opportunities. For me, for the $4,000-plus price tag on DraftKings, I’ll take Rendon over Murphy every time… and several other players at the position as well.
Granted, this was week two, and part of this was due to the batting order positions, which quickly changed, but I did say that Rendon was a better hitter than Murphy. Rendon finished with a good .342 wOBA, but Murphy completely changed his game, pulled the ball more, added power, and yet still maintained great plate discipline, culminating in a .409 wOBA. I was absolutely wrong about Murphy.
Miguel Sano, 3B/OF, Minnesota Twins
Welp, after writing about Sano as a Faller last week and telling you to ignore him until he started showing signs of who he actually is as a player, it seems pretty safe to that the big man is back. All of the disturbing opening week trends reversed themselves this week. Sano cut his 50% strikeout rate down to 29%—below the 35% it was at last year—and raised his hard hit rate up from 28% to 46% (also above last year’s 43%). He cut way back on those weak opposite-field flies and started pulling the ball and hitting it to center more, and the result was three home runs.
I said last week that when Sano is right he’s often an elite DFS option… He’ll always be a boom-or-bust guy in the mold of Chris Davis, but on boom days he’ll put up big points.
My Sano love never panned out this year. There were some injuries in the mix, sure, but overall Sano finished with a disappointing .330 wOBA—above average but nowhere near the level of goodness or greatness I envisioned.
Michael Pineda, SP, New York Yankees
Pineda has been one of the most perplexing pitchers in baseball over the past six weeks. His ERA sits at a horrendous 6.14 ERA while his xFIP is a quite excellent 3.60. He’s getting strikeouts, he’s limiting walks, his hard contact rate is about average, but he’s giving up hits and home runs. Why? Hell if I know. I dug into him a couple weeks ago and mentioned on GridersLive that I couldn’t find anything. Eno Sarris at FanGraphs did the same and reached the same conclusion.

I’ve run him out there the past three starts because, honestly… this looks mostly like bad luck to me.
Pineda certainly turned in some good starts and good stretches along the way, but Pineda’s story remained the same following this writing: 4.40 ERA, 3.09 xFIP. There are two potential lessons here, and honestly, I’m not sure which one applies to Pineda. The first is that, sometimes, very rarely, pitchers legitimately shouldn’t be expected to live up to their peripherals. It’s difficult to pinpoint when this is the case and when we’re just dealing with bad luck, because lesson two is this: sometimes bad luck persists and it takes longer to reverse itself. In the case of Pineda, it’s been two years of “bad luck” now, which is still well within a reasonable range of it actually being bad luck, but it does make us think.
Adam Rosales, 2B/3B, San Diego Padres
Adam Rosales is not good. Let’s get that right out in the open… Not only is Rosales not very good, but he hits eighth for one of the weakest offenses in baseball. Even in Great American Ball Park this weekend against weak lefties, Rosales should have come nowhere near your DFS lineup.
Rosales’ champions claim that he’s solid against lefties. A career .238 batting average and .306 wOBA are not solid. Then it was clarified that he’s been good for the past three and a half years. Ignoring the arbitrariness of such a cut-off point, and ignoring the absurdly small 306 plate appearance sample size, Rosales still has just a .236 average and .319 wOBA. You know what the league average for righties against lefties is this year? A .263 average and a .329 wOBA.
Not only is Rosales not a lefty “masher,” not only is he not “notable,” but he’s quite a bit below average, even if we ignore his weaker past data, the fact that he’s now 33, and the tiny sample that people are trying to draw conclusions from. You could maybe make the case that he’s been “decent” against lefties in the past, but if we account for these issues with methodology, as we would do if we were actually trying to figure out how good Rosales should be against lefties going forward, our expectation would be lower. THE BAT estimates the wOBA as .304 vs. LHP in the future. However you spin it, unless you’re cherry-picking and ignoring sound statistical principles and methodology, Rosales is not a viable DFS play, even in great matchups against lefties.
Rosales is almost in the Bogaerts tier of players that I thought were wildly overrated yet somehow people love. And somehow, he also wound up posting an excellent .377 wOBA vs. LHP since this writing. Rosales lovers can claim victory, and I’ll be happy to give it to them, because they’re still wrong and will lose a lot of money next year as a result. After all, that .377 wOBA came with a 46% K% and .435 BABIP. Right-handed batter platoon splits take a long time to become believable (much long than Bogaerts’ BABIP) and are prone to huge swings in variance. 33-year-old utility men don’t suddenly get good, and the math still indicates that Rosales is one of the weaker hitters in baseball. The way I view it is like this: Rosales right now is where we were at with Bogaerts in May. Regression is coming; sometimes it just happens across multiple seasons.
Final Takeaways
1) No matter how well a player is hitting, no matter what his pedigree, no matter what his park, a player vastly overperforming BABIP expectations should always be expected to regress to a more normal number.
2) Bullpens are important to consider for DFS value, but bullpens are a dynamic entity. Seasonal bullpen stats can mean absolutely nothing. Focus instead on the skills of the individual members of the bullpen at this moment in time and how they are used.
3) Minor league stats are important and can help us identify quality players before their major league numbers catch up. They can’t account for everything and aren’t perfect, but on the whole they are very important if considered with as much context as possible.
4) This one is a bit more abstract, and one that I won’t be able to show any evidence on yet. Sometimes, a player doesn’t regress to expectation in the sample sizes we’re allotted. Sometimes, Adam Rosales continues to hit. But the end of a season is a somewhat arbitrary endpoint. Adam Rosales is almost certainly not this good of a hitter against left-handed pitching. The same as people just couldn’t believe that Bogaerts wasn’t a star shortstop back in May and we had to wait until now to reflect on it and realize that he isn’t actually a star, that’s where we’ll likely be at come this time next year with Rosales. And for the sake of clarity, that this happens on occasion does not mean that playing a guy like Bogaerts back in May or Rosales in September is a sound decision. Rosales is the outlier, the guy whose outcome is in the minority. Most guys who the math is against regress fairly quickly and wind up being bad plays, and it’s never smart to ride out one of these guys just because they haven’t regressed yet.