NHL DFS Analytics Report: Volume 2

Welcome back to this week’s edition of the Analytics Report. Last week, I touched on the impact of Corsi, and the misconceptions that we have of certain teams. That analysis can be taken up another notch.
Now that we know how to research which teams are underachieving and overachieving in this category, we can look at which players are underachieving and overachieving based on their possession numbers. Some of you posted in comments about other analytics. Indeed, I don’t just look at Corsi. It is not always an indicator of the quality of shots, but each week I am going to introduce something new. I also discussed WOWY stats for forwards, and how we can use this to predict sustainability of lines. This week, I am going to discuss Scoring Chance differential for teams, and how to find out which players to target on a team that you like.
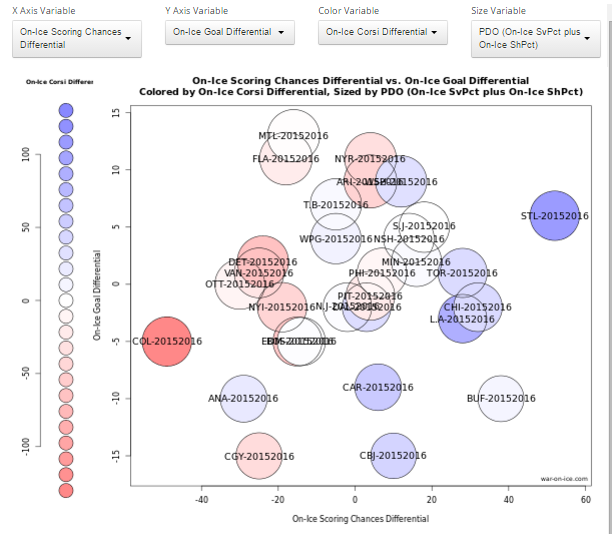
Last week, I showed you guys a chart which displayed the sustainability and unsustainability of certain team’s struggles and success based on corsi. Here is a chart taking it one step further. Keep in mind that 67% of goals are scored at even strength, and the other 33% can often be very predictive with power-play goals, and 3-on-3 OT goals (Skilled players in open ice). However, it is important to look at this to determine which players will do well at 5 vs 5, because most of the game is played at 5 on 5. In my opinion, this is the biggest skill in DFS NHL. I have factored in an indicator of shot quality, by measuring scoring chance differential. The difference between scoring chance differential and corsi differential, is that a scoring chance is a measured chance where there is a high opportunity at a goal, whereas a corsi attempt can be anything from a breakaway to a 1-on-3 slapshot from the neutral zone. This helps narrow down the quality of chances a team is getting, rather than the quantity. Here is a look at that chart:

On the X axis, like last week, I am using my analytics differential, but using scoring chances instead of corsi. However, I value corsi differential as a stat, and I have continued to include it in this chart. The more blue a team’s color is, the better corsi percentage they will have. The more red a team’s color is, that means their corsi percentage is worse. As you can see, there are a lot teams shaded blue more towards the right. On the Y-axis, we once again have goal differential, and the larger the team’s circle is an indicator of PDO, which I explained last week to be shooting % for added up by save % for. There is definitely a correlation between attempting a high quantity of shots and getting a lot of quality shots, but we can see a few teams indicating that it is worth considering both stats.
Applying to DFS
Anaheim is a team that is really struggling, and if you compare corsi numbers to last year, you might wonder why, but you can see that they are struggling to generate high quality scoring chances compared to their opponent. This is a team already considering new coaching options, and if they continue to play the way they are playing, we might see Boudreau out of town very soon. The Ducks are loaded with talent, and I think it would be a kneejerk reaction to fire Boudreau, as this team has a long history of success with him, and it is only a matter of time before their star players start scoring again. The big change this year is that they are generating a much lower % of scoring chances than they have in the past. This strongly correlates with the struggles of Corey Perry and Ryan Getzlaf, but it is also just a really small sample size for a team that has been so good for so long, without much change in personnel.
Colorado continues to be a joke of a team that relies on their goaltending. People defending Colorado will often cite their success as getting better quality shots, as opposed to quantity; but, it is clear here that Colorado cannot sustain this style of play. Mackinnon and Landeskog are great players, but besides them, this team is really overrated, and way too reliant on Semyon Varlamov. Continue to stack against them. The results will come.
St. Louis has been the best 5v5 team so far in hockey in terms of generating scoring chances and possessing the puck. Look for them to keep up their play, and continue to target them in your contests. They also have tremendous talent that should allow for them to maintain this really high goals for differential.

Perhaps the biggest story of the year so far is the Buffalo Sabres. They have really struggled on the penalty kill, and their starting goalie is hurt, leaving them with Chad Johnson (.885 sv pct since 2014). Because of this, while their good even strength play is nice, you can continue to take guys against them, but this team is not a bad team, and the % owned we are seeing against them is ridiculous. This team was tanking for the first overall pick last year, and have revamped their roster with quality players up and down the roster. Jack Eichel, Rasmus Ristolainen, Evander Kane, Cody Franson, and Ryan O’Reilly are all great possession players, and have a lot of talent to go along with it. When Robin Lehner returns, I will definitely fade players against Buffalo. This team is playing really good hockey, and I expect for it to keep up and lead to better results than we’ve seen. Montreal players were 40% + against Buffalo on Saturday and scored seven goals. It was a frustrating night for someone who is informed about Buffalo’s improvements, but things will even out in the long-haul.
Both Florida and Montreal have been carried by stellar goaltending play. Montreal’s lucky run might not be so lucky, as they do have the best goalie in hockey, but there is no way they can sustain their style of play and expect to keep winning games. Carey Price is an elite goalie, but against Toronto, he faced 52 shots, saw three hit the post, and had many pucks almost find their way in. Stacking against Montreal when their backup goalie, Mike Condon, is in net, could be a really sneaky move, as it might indicate that they are on a back to back, and will likely not be targeted based on pure results stats. Roberto Luongo has had the same impact on Florida as Carey Price has on Montreal. He is also a great goalie, but he can’t continue to play this well. Both of these teams are not bad, but they will not be able to keep this up.
As you can see, some teams with good possession numbers also predictably have good scoring chance numbers. A few other teams worth noting are the much improved Leafs, who are playing great hockey, and the Islanders, who have really struggled to limit opportunities on their back end.
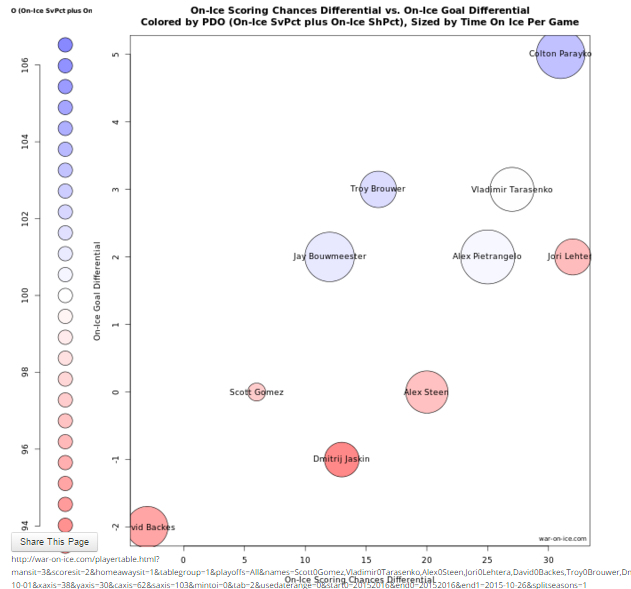
Last week, I introduced wowy stats, which only touched on corsi. While these charts for teams’ scoring chances are really awesome, you might look at St. Louis, for example and say, what now? I like St. Louis tonight, but who do I roster? First of all, unless there is an extremely good player on a really good line, at a really good price, I like fading people who get no power-play time. Players getting power-play time get a huge boost, so keep that in mind. That will help me narrow down this chart I am about to make. Using dailyfaceoff and leftwinglock, I will make a chart using only players who have seen decent power-play time in the last three games.

All of these guys on the chart saw time on the power play. In DFS, we want minutes. The bigger the circle, the more minutes a guy is playing. The color variable in this instance is PDO. Obviously defensemen will play the most, but if we are going to pair three Blues together in a good matchup, based on this chart, we should be rostering two from the top line of Alexander Steen, Vladimir Tarasenko, and Jori Lehtera, along with either Colton Parayko or Alex Pietrangelo, depending on who gets the top PP minutes. Parayko has been outstanding from the eye test, and he has been outstanding based on this chart. Tarasenko is obviously amazing, and it’s nice to see a chart like this confirm that. Him and Lehtera are an awesome combo and should always be rostered in good spots, especially considering Lehtera’s cheap price tag.
If you play DFS, making these player charts with the power-play guys can make your life easier if you don’t watch too much hockey. Pairing guys who are on the same unit also increases upside.
This Week’s Games to Target
Monday – Arizona at Toronto – The Leafs are really underachieving so far this year considering the style of hockey they have played. Look for them to finish their chances against an awful goalie in Mike Smith, and a PDO driven Coyotes team that is young and not ready to be good. Using the player charts on waronice, you will see Toronto’s top line is a great play.
Tuesday – Anaheim at Dallas – Anaheim is really struggling, and that top line on Dallas is unstoppable. Their numbers are off the charts good, and facing a really cold team on a back to back is not going to stop them.
Wednesday – Pittsburgh at Washington – On a small slate, the top Caps line really stands out at the best line, on a slate where there are no real mismatches.
Thursday – Montreal at Edmonton – This will be a great spot for a GPP line. With Montreal heading out west, and clearly overachieving, we could see Edmonton dominate the possession again. Taking guys against Carey Price isn’t fun, but he can’t stop 35+ shots every night. There is a good chance Price sits this one out too, as Montreal will play on the Friday night as well.
Friday – Colorado at Carolina – The Canes face the worst possession team in hockey, and they are a much better team at home. This will be an underowned team, but probably are the top plays of the night if you can narrow down their value options with the player charts. Eric Staal will be a must play for me.
Saturday – Minnesota at St. Louis – This will be a good spot to target St. Louis. Not many will be on them, but they are clearly the class of the West right now, and are at home. This is a great GPP spot for Tarasenko, Lehtera and Steen.
Sunday – San Jose at Colorado – For the same reasons I like Carolina, I love San Jose. Colorado sucks.
I hope you all enjoyed this piece. Next week I will introduce pace and power-play stats!