10 Definitely Interesting, Possibly Helpful MLB Notes for Friday, July 5th

Welcome to 10 Definitely Interesting, Possibly Helpful Notes! In this column, I’ll work to uncover some interesting bits of information that might shed some light on players from that day’s slate of MLB games. This is not a picks column, nor is it a “fun facts” article – it’s something in between.
I hope you enjoy it, and I hope it helps you think about today’s MLB plays in a new way as you build your DFS lineups. Here are 10 Notes for Friday, July 5th.

1. After struggling a bit at the beginning of the season, Jacob deGrom has looked like his old, Cy-Young-winning self over the past couple months, in large part because of the steady decline of hard hits against him. Take a look at how his hard-hit rate has declined over the course of the season:
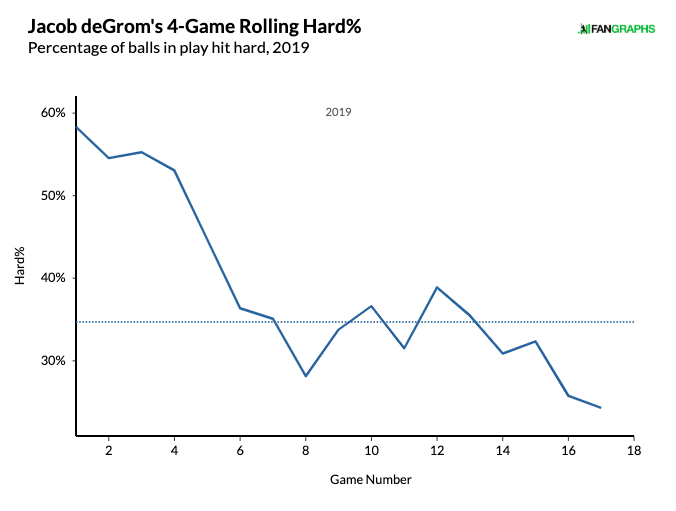
In fact, since June 1st, deGrom and Chris Sale are the only pitchers in MLB (min. 20 IP) to pair a hard-hit rate below 30 percent with a 32 percent strikeout rate or better. On Friday, it’s deGrom and Justin Verlander at the high end of the starting pitcher pool, and deGrom comes in with the superior matchup, at least in terms of strikeout upside. Against right-handed pitching, the Phillies strike out at a 22.9 percent clip, which is roughly in the middle of the pack, and despite having some big power bats, their .173 ISO ranks 22nd in MLB. It’s a close call, but if siding between the two, I’ll take deGrom at a slight discount.
2. While deGrom has seen a big decrease in hard hits as of late, Justin Verlander is on the other end of the spectrum, allowing hard hits 40 percent of the time. That’s an increase of 10.9 percent over his 2018 hard-hit rate of 29.1 percent, the fifth-largest increase in MLB. If we look at Verlander’s four-seam fastballs alone (his most frequent offering), he’s already allowed 14 home runs on the pitch; last season, he allowed 18 home runs on four-seamers all season. Overall, Verlander has allowed 23 home runs, tied with Mike Leake and Reynaldo Lopez for the most in MLB. That’s an awful lot of shade to throw on a pitcher who is unquestionably one of the best in the game. But the likelihood of a home run or two to Mike Trout and company, coupled with the fact that the Angels are allergic to strikeouts (their 17.7% K rate against RHPs is lowest in MLB), really limits Verlander’s ceiling. When he faced this same Angels team on May 5th, he allowed three earned runs (all on solo homers) and fanned 7 batters, an outcome that seems fairly likely for him to repeat. That may not be enough given his elevated price tag.

3. Let’s take a look at Zack Greinke’s games of 6+ innings and zero earned runs allowed by year since joining the Diamondbacks in 2016:
2016 (26 starts) – 2
2017 (32 starts) – 3
2018 (33 starts) – 4
2019 (18 starts) – 6
Greinke’s six games of 6+ innings and zero earned runs (in roughly half a season) is his most in a season since signing with the D-backs, and it ranks second to only Hyun-Jin Ryu (7 such games) in all of MLB this year. When he’s found himself in a good matchup, he’s locked it down, and though he doesn’t have the strikeout upside of deGrom or Verlander (he’s at just 22.6% strikeouts this year), Greinke’s floor remains super high. As always, the Rockies have been awful when away from Coors, sporting an MLB-worst .281 wOBA and a .157 ISO that isn’t much better (25th). More importantly, the Rockies’ 27.7 percent strikeout rate on the road is second-highest in MLB. If you’re looking for a pivot off likely massive deGrom and Verlander ownership for GPPs, Greinke fits the bill.
4. Only three pitchers in MLB this season have 5+ games of 20 percent hard hits or fewer: Stephen Strasburg, Noah Syndergaard, and … Eduardo Rodriguez. E-Rod has allowed exactly 20 percent hard hits in each of his past two games, and while the results haven’t been stellar (7 earned runs allowed in 11 2/3 innings against the White Sox and Yankees), it’s safe to say that limiting hard hits is a good thing, and Rodriguez is quietly one of the best in MLB in this regard. He’s got plenty of K upside on Friday given his matchup, as the Tigers strike out 25.5 percent of the time against lefties (sixth-most in MLB). Detroit’s .285 team wOBA against lefties is fifth-lowest in MLB, as well. But what makes this a really appealing matchup for Rodriguez is his reverse splits; for his career, E-Rod has allowed a stellar .303 wOBA to righties and 1.11 HR/9, compared to .339 to righties and a 1.55 HR/9 to lefties. Per PlateIQ, the Tigers should roll out eight righties (and mostly bad ones, at that), making E-Rod an excellent play in the mid-range at starting pitcher.
5. Drew Pomeranz has a 3.53 ERA at home this season…and a 9.76 ERA on the road. He’s got a 30.3 percent strikeout rate at home … and a 20.4 percent rate on the road. He’s allowing 29.2 percent hard contact at home … and 45.7 percent on the road. Now, we can say “variance” and shrug off these numbers, to a large extent. But there is reason to think Pomeranz would be better in Oracle Park, which is one of the most pitcher-friendly parks in MLB. And he’s been great recently: Over his last five starts dating back to June 7th, Pomeranz has a 30.9 percent strikeout rate and a 3.33 ERA (in spite of some really bad luck, as evidenced by his .371 BABIP and 16.3% HR/FB rate over that stretch). Only six other pitchers in MLB (Scherzer, Cole, Morton, deGrom, Buehler, Giolito) can say that. Pomeranz’s matchup with the Cardinals may not be as bad as it seems, as the Cardinals have been atrocious offensively as of late. Over the past 30 days, check out their rankings in a few DFS-relevant metrics:
.143 ISO (ranks 27th in MLB)
.282 wOBA (ranks 30th)
72 wRC+ (ranks 30th)
They’re down in Marlins and Tigers territory. It’s hard to give a wholehearted recommendation for a pitcher as up-and-down as Pomeranz. But given his cheap price tag across the industry ($7,300 at FD; $6,800 at DK; $34 at Yahoo), he’s appealing as an SP2 at two-pitcher sites.
6. In his last three seasons, J.D. Martinez has slugged .737 against left-handed pitching (331 PA). In MLB history, there’ve been 16 seasons where a hitter posted a .737 slugging, and it’s pretty much all Barry Bonds and Babe Ruth, with a few other legends mixed in. Take a look, per Baseball Reference’s Play Index:
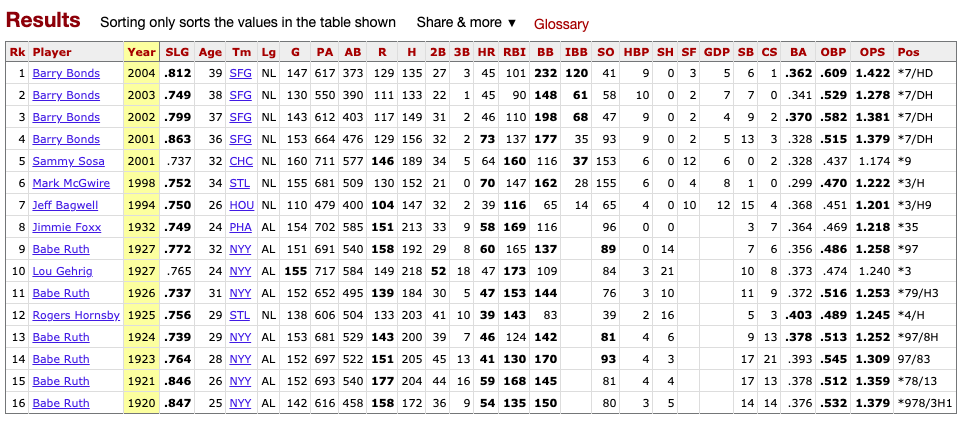
In other words, Martinez has been Hall-of-Fame caliber against lefties over the past few seasons. On Friday, he’ll take his swings against a bad lefty in the Tigers’ Gregory Soto, who, in a limited sample of 17 innings, has been smashed by righties to the tune of a .424 wOBA and 46.8 percent hard hits. It’s not often that a hitter this good, in this good of a matchup, is priced below $5,000 at DraftKings, but there Martinez sits at the bargain price of $4,800 (and he’s also reasonable at FanDuel and Yahoo at $4,400 and $24, respectively). Martinez could do Ruth-ian, Bonds-ian things on Friday, and he – along with any other Red Sox righties you can fit in – is a priority bat on Friday.
7. Only six players in MLB have hit 20+ balls at 110 MPH or harder this year: Pete Alonso (23), Mike Trout (23), Ronald Acuna (23), Gary Sanchez (21), Bryce Harper (20), and … C.J. Cron (20). It’s true that Cron been doing more of his damage against lefties this year (167 wRC+), but Texas righty Adrian Sampson might as well be left-handed, given his reverse splits: he’s allowing a .366 wOBA and a hard-to-believe 2.05 HR/9 to right-handed batters this year. With a hefty 5.78 implied run total in the favorable matchup, the Twins are another team worth fitting in wherever you can. Cron represents an affordable path to a high-upside offense ($3,200 at FD; $4,000 at DK; $13 at Yahoo), and he’s cash game playable at first base.
8. From the years 2016-2018, Jorge Soler totaled 35 barrels; in the first half of 2019 alone, he has 31. Just for context, it’s worth noting that Soler’s 31 barrels is tied with Statcast darlings like Bryce Harper, Nelson Cruz, J.D. Martinez (among a few others) for 17th-most in MLB. Soler is finally realizing his potential and (just as importantly) finding a way to stay healthy. Priced affordably ($3,200 at FD; $3,900 at DK) in a matchup against Nats unproven right-hander Austin Voth, Soler provides some power upside at a reasonable price. Given that he’s on the Royals, he likely won’t draw heavy ownership, either, which provides an added boost for him as an excellent tournament play.

9. Here are three quick reasons to play the perpetually underpriced Justin Turner ($3,000 at FD; $3,900 at DK; $15 at Yahoo) on Friday:
— Only two hitters in MLB have exceeded 50 percent hard hits over the past calendar year. One – Christian Yelich, with 52 percent hard hits – is obvious. Turner is the other, with 50.8 percent hard hits.
— Turner is also one of only two players, joining Mookie Betts, to slash .300/.400/.500 with a strikeout rate below 16 percent over the last calendar year.
— Since 2017, Turner has an impressive 1.034 OPS against left-handed pitching. The only others to match that are true lefty mashers: Nolan Arenado, J.D. Martinez, Giancarlo Stanton, and Kris Bryant. Turner faces Padres left-hander Eric Lauer on Friday.
10. Let’s take a look at Lorenzo Cain’s yearly BABIP marks over the past several seasons:
2014 – .380
2015 – .347
2016 – .341
2017 – .340
2018 – .357
2019 – .288
Cain has a career-low BABIP this year, and this despite the fact that he has a career-high 24.9 percent line drive rate. It’s hard to conceive of a speedster like Cain who is hitting a bunch of line drives carrying this low of a BABIP for much longer; he’s due for a breakout. At Yahoo in particular ($11), Cain is an awesome value, but he’s priced low at FanDuel ($3,100) and DraftKings ($4,200) as well. He faces lefty Steven Brault, and Cain has a history of hitting lefties well (career 127 wRC+). You could do much worse when saving salary than a low-priced leadoff hitter with speed, a bit of pop, and a high implied team total (Milwaukee’s implied 5.28 runs is sixth-highest on the slate).
______________________________________________________________________________________________________________________________________
Thanks for reading! Stats from this article were pulled from RotoGrinders’ PlateIQ tool, FanGraphs, Baseball Prospectus, Baseball Savant, Brooks Baseball, and Baseball Reference.
Check back for more “10 Notes” MLB articles every Tuesday and Friday throughout the year, and feel free to leave a question or comment down below!