MLB Grind Down: Tuesday, October 11th

The RotoGrinders MLB Grind Down will give you an in-depth analysis into the upcoming MLB schedule. This article will break down the numbers for every single game and give you analysis on which trends you can exploit. While matchups are a major factor in daily fantasy baseball, there are plenty of other factors to consider such as injuries, weather, and salaries.
The analysis should point you in the right direction, but it is still up to you to decipher the information and make your own selections. No sport has more variance than baseball. The best choice is not always the right choice but following the trends will win you money over time.
Note: As always, if you want to try a new DFS site, be sure to click through a RotoGrinders link and use our DraftKings promo code and FanDuel promo code to receive the best perks in the industry.
Stackability Rating System:
GREEN – One of the top stacks of the day, viable in cash games and GPPs
YELLOW – A viable stack option in most formats, specifically GPPs
ORANGE – There are better stacks out there, but playable in large GPPs
RED – Not a recommended stack for cash games or GPPs
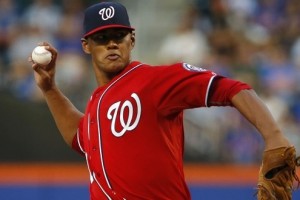
Washington at LA Dodgers – 5:05 PM ET
| Washington | LA Dodgers | ||||||||
 | Joe Ross |  | Clayton Kershaw | ||||||
| RIGHT | LEFT | ||||||||
| Vegas Moneyline | Vegas Over/Under | ||||||||
| LAD -250 | 6.5 | ||||||||
| Stats | wOBA | HR All. | HC% | K% | Stats | wOBA | HR All. | HC% | K% |
|---|---|---|---|---|---|---|---|---|---|
| SP vs. Left (2016) | 0.356 | 4 | 33.8% | 17.8% | SP vs. Left (2016) | 0.137 | 0 | 24.1% | 36.9% |
| SP vs. Right (2016) | 0.265 | 5 | 25.5% | 23.6% | SP vs. Right (2016) | 0.227 | 8 | 29.8% | 29.8% |
Pitcher Grind Down
| Joe Ross | ||||||||||
 | FanDuel | DraftKings | ||||||||
| Salary: | $7,700 | Salary: | $6,400 | |||||||
| FPPG: | 24.3 | FPPG: | 12.4 | |||||||
| Pitcher Rating: | 61.2 | Pitcher Rank: | 4 | |||||||
| Statistics | Starts | PitchPS | SIERA | ERA | K% | BB% | SS% | GB% | FB% | HC% |
|---|---|---|---|---|---|---|---|---|---|---|
| L30 Days | 3 | 68.0 | 3.21 | 2.79 | 29.8% | 6.4% | 11.8% | 27.6% | 37.9% | 31.0% |
| 2016 | 19 | 89.9 | 4.06 | 3.43 | 20.8% | 6.5% | 11.0% | 42.6% | 30.3% | 29.5% |
| 2015 | 13 | 88.7 | 3.66 | 3.64 | 22.0% | 6.7% | 11.9% | 49.8% | 33.8% | 30.2% |
Home (2015-16):—ERA: 3.31 — K%: 20.0% — wOBA Allowed: 0.278
Away (2015-16):—ERA: 3.73 — K%: 22.5% — wOBA Allowed: 0.313
The Nationals have yet to officially name a starter for Game 4, but most expect Joe Ross to get the nod. He looked sharp in his final three starts of the season, posting a 3.21 SIERA with a strikeout rate of 29.8%. His pitch count was limited in those outings, but he did throw 90 pitches in his last start. At this point in the season, it’s rare to find a mediocre pitcher that is going to last more than four or five innings anyway. He comes into this game as an underdog and he draws a difficult matchup against the Dodgers, who were ranked sixth in team wOBA and seventh in team ISO against right-handed pitching during the regular season. The price is nice, but Ross will have a short leash if he isn’t pitching well.
| Clayton Kershaw | ||||||||||
 | FanDuel | DraftKings | ||||||||
| Salary: | $9,800 | Salary: | $12,400 | |||||||
| FPPG: | 44.5 | FPPG: | 26.6 | |||||||
| Pitcher Rating: | 92.0 | Pitcher Rank: | 1 | |||||||
| Statistics | Starts | PitchPS | SIERA | ERA | K% | BB% | SS% | GB% | FB% | HC% |
|---|---|---|---|---|---|---|---|---|---|---|
| L30 Days | 5 | 78.2 | 2.98 | 1.29 | 26.2% | 1.9% | 12.0% | 47.9% | 34.2% | 25.7% |
| 2016 | 21 | 98.2 | 2.41 | 1.69 | 31.6% | 2.0% | 15.3% | 49.4% | 30.1% | 28.4% |
| 2015 | 33 | 102.8 | 2.24 | 2.13 | 33.8% | 4.7% | 15.9% | 50.0% | 28.2% | 25.3% |
Home (2015-16):—ERA: 1.44 — K%: 35.1% — wOBA Allowed: 0.197
Away (2015-16):—ERA: 2.48 — K%: 30.9% — wOBA Allowed: 0.244
With the Dodgers facing elimination in Game 4, they will turn to Clayton Kershaw on short rest. I’m a little surprised by the decision, as Kershaw has only thrown over 100 pitches one time since coming back from injury. Now he has to face the Nationals on short rest in an elimination game. While there are concerns about his ability to pitch deep into the game, Kershaw is the obvious play at pitcher today and he is recommended in all league formats. In the last two seasons, Kershaw has a ridiculous 1.44 ERA with a strikeout rate of 35.1% at home.
Batter Grind Down
Washington
The Nationals were an offense that I was looking to target when Julio Urias was projected to start, but that’s no longer the case. They draw the toughest matchup on the board, as they have to face Clayton Kershaw in the pitcher-friendly Dodger Stadium. During the regular season, Kershaw held both left and right-handed hitters under a .230 wOBA.
- Nationals Offense (2016)
Team wOBA vs. LHP — 0.332 (4 of 30)
Team ISO vs. LHP — 0.196 (2 of 30)
Team K% vs. LHP — 20.9% (11 of 30)
Runs Per Game — 4.71 (8 of 30)
Projected Run Total — 2.39 (4 of 4)
Projected Lineup
| # | Player | Bats | wOBA vs. LHP | ISO vs. LHP | HC% vs. LHP | wOBA L14 | FD Position | FD Salary | DK Position | DK Salary |
|---|---|---|---|---|---|---|---|---|---|---|
| 1 | Trea Turner | RIGHT | 0.325 | 0.095 | 42.0% | 0.341 | OF | $3,800 | 2B/OF | $5,000 |
| 2 | Bryce Harper | LEFT | 0.322 | 0.212 | 31.4% | 0.281 | OF | $3,500 | OF | $4,100 |
| 3 | Jayson Werth | RIGHT | 0.432 | 0.298 | 46.3% | 0.298 | OF | $3,200 | OF | $3,900 |
| 4 | Daniel Murphy | LEFT | 0.383 | 0.219 | 31.2% | 0.000 | 2B | $3,700 | 2B | $4,600 |
| 5 | Anthony Rendon | RIGHT | 0.355 | 0.143 | 34.9% | 0.263 | 3B | $3,100 | 3B | $4,500 |
| 6 | Ryan Zimmerman | RIGHT | 0.292 | 0.200 | 39.7% | 0.329 | 1B | $2,900 | 1B | $3,700 |
| 7 | Danny Espinosa | SWITCH | 0.297 | 0.261 | 40.7% | 0.260 | SS | $2,800 | SS | $3,200 |
| 8 | Jose Lobaton | SWITCH | 0.200 | 0.200 | 20.0% | 0.323 | C | $2,300 | C | $3,100 |
| 9 | Joe Ross | RIGHT | 0.359 | 0.063 | 30.8% | 0.000 | P | $7,700 | P | $6,400 |
| Team Averages | — | 0.329 | 0.188 | 35.2% | 0.233 | — | — | — | — |
Elite Plays – NONE
Secondary Plays – Jayson Werth
Stackability – RED
LA Dodgers
The Dodgers may not hit southpaws well, but they are one of the best offenses in baseball against right-handed pitching. They draw an exploitable matchup today against Joe Ross, who allowed a .356 wOBA and a 33.8% hard contact rate to left-handed hitters during the regular season. He is tough on right-handed bats, but Ross may not pitch more than four or five innings anyway, so I’ll be targeting batters from both sides of the plate here.
- Dodgers Offense (2016)
Team wOBA vs. RHP — 0.331 (6 of 30)
Team ISO vs. RHP — 0.177 (7 of 30)
Team K% vs. RHP — 21.1% (18 of 30)
Runs Per Game — 4.48 (14 of 30)
Projected Run Total — 4.11 (1 of 4)
Projected Lineup
| # | Player | Bats | wOBA vs. RHP | ISO vs. RHP | HC% vs. RHP | wOBA L14 | FD Position | FD Salary | DK Position | DK Salary |
|---|---|---|---|---|---|---|---|---|---|---|
| 1 | Chase Utley | LEFT | 0.334 | 0.152 | 38.8% | 0.325 | 2B | $2,900 | 2B | $3,100 |
| 2 | Corey Seager | LEFT | 0.400 | 0.223 | 39.6% | 0.277 | SS | $3,700 | SS | $4,200 |
| 3 | Justin Turner | RIGHT | 0.385 | 0.258 | 37.2% | 0.370 | 3B | $3,600 | 3B | $4,400 |
| 4 | Adrian Gonzalez | LEFT | 0.362 | 0.185 | 36.9% | 0.335 | 1B | $2,900 | 1B | $3,300 |
| 5 | Josh Reddick | LEFT | 0.371 | 0.163 | 32.8% | 0.388 | OF | $2,800 | OF | $3,500 |
| 6 | Joc Pederson | LEFT | 0.386 | 0.278 | 41.3% | 0.446 | OF | $3,100 | OF | $3,400 |
| 7 | Yasmani Grandal | SWITCH | 0.351 | 0.268 | 39.7% | 0.435 | C | $2,900 | C | $3,300 |
| 8 | Andrew Toles | LEFT | 0.375 | 0.185 | 32.4% | 0.227 | OF | $2,100 | OF | $2,100 |
| 9 | Julio Urias | LEFT | 0.155 | 0.000 | 18.8% | 0.000 | P | $7,400 | P | $6,700 |
| Team Averages | — | 0.347 | 0.190 | 35.3% | 0.311 | — | — | — | — |
Elite Plays – Corey Seager, Adrian Gonzalez
Secondary Plays – Chase Utley, Justin Turner, Josh Reddick, Joc Pederson, Yasmani Grandal
Stackability – YELLOW / GREEN
Chicago Cubs at San Francisco – 8:35 PM ET
| Chicago Cubs | San Francisco | ||||||||
 | John Lackey |  | Matt Moore | ||||||
| RIGHT | LEFT | ||||||||
| Vegas Moneyline | Vegas Over/Under | ||||||||
| CHC -122 | 7.5 | ||||||||
| Stats | wOBA | HR All. | HC% | K% | Stats | wOBA | HR All. | HC% | K% |
|---|---|---|---|---|---|---|---|---|---|
| SP vs. Left (2016) | 0.303 | 6 | 34.1% | 20.8% | SP vs. Left (2016) | 0.287 | 5 | 30.0% | 22.6% |
| SP vs. Right (2016) | 0.264 | 17 | 34.6% | 26.5% | SP vs. Right (2016) | 0.309 | 20 | 31.0% | 20.9% |
Pitcher Grind Down
| John Lackey | ||||||||||
 | FanDuel | DraftKings | ||||||||
| Salary: | $9,200 | Salary: | $8,600 | |||||||
| FPPG: | 35.4 | FPPG: | 19.4 | |||||||
| Pitcher Rating: | 72.9 | Pitcher Rank: | 1 | |||||||
| Statistics | Starts | PitchPS | SIERA | ERA | K% | BB% | SS% | GB% | FB% | HC% |
|---|---|---|---|---|---|---|---|---|---|---|
| L30 Days | 5 | 90.0 | 4.40 | 3.00 | 19.8% | 8.3% | 10.7% | 45.8% | 34.9% | 32.2% |
| 2016 | 29 | 98.4 | 3.83 | 3.35 | 24.1% | 7.1% | 11.5% | 41.0% | 36.3% | 34.4% |
| 2015 | 33 | 94.8 | 3.90 | 2.77 | 19.5% | 5.9% | 9.4% | 46.0% | 33.3% | 30.1% |
Home (2015-16):—ERA: 2.26 — K%: 21.8% — wOBA Allowed: 0.273
Away (2015-16):—ERA: 4.06 — K%: 21.3% — wOBA Allowed: 0.309
Game 3 was absolutely incredible. The Giants managed to score three runs in the bottom of the eighth to go up by two. Kris Bryant then followed with a two-run homer to tie it up in the ninth. The game finally ended in the 13th inning with a double off the bat of Joe Panik. Tonight’s game sets up for another good one, as Lackey squares off against Matt Moore. Lackey has had a great season overall, boasting a 3.35 ERA with a strikeout rate of 24.1%. He also has a ton of postseason experience. In 23 career appearances, he has a 3.11 ERA with a strikeout rate of 18.8%. If you want to fade Clayton Kershaw, Lackey is the best pivot.
| Matt Moore | ||||||||||
 | FanDuel | DraftKings | ||||||||
| Salary: | $8,000 | Salary: | $7,500 | |||||||
| FPPG: | 30.8 | FPPG: | 15.7 | |||||||
| Pitcher Rating: | 63.6 | Pitcher Rank: | 3 | |||||||
| Statistics | Starts | PitchPS | SIERA | ERA | K% | BB% | SS% | GB% | FB% | HC% |
|---|---|---|---|---|---|---|---|---|---|---|
| L30 Days | 6 | 86.7 | 3.97 | 5.17 | 23.9% | 8.0% | 12.3% | 38.0% | 35.9% | 28.0% |
| 2016 | 33 | 99.5 | 4.39 | 4.08 | 21.2% | 8.6% | 10.4% | 38.2% | 42.1% | 30.8% |
| 2015 | 12 | 88.0 | 4.67 | 5.43 | 16.6% | 8.3% | 9.9% | 39.2% | 38.7% | 31.7% |
Home (2015-16):—ERA: 3.67 — K%: 21.2% — wOBA Allowed: 0.296
Away (2015-16):—ERA: 5.43 — K%: 18.6% — wOBA Allowed: 0.346
Moore has had a roller coaster season for both the Rays and the Giants. He finished the season in decent form though, posting a 3.97 SIERA with a strikeout rate of 23.9% in his last six starts. The Giants need a big game out of him, as they try to stave off elimination one more time. He draws a difficult matchup against the Cubs, who were ranked sixth or better in team wOBA, team ISO, and team K% against left-handed pitching during the regular season. I can get behind the Moore play in a deep tournament, but he is an easy fade in cash games.
Batter Grind Down
Chicago Cubs
The Cubs are small favorites tonight against the Giants. They would love nothing more than to win this game and finally eliminate the Giants in an even-numbered year. They draw a favorable matchup against Matt Moore, who allowed a .309 wOBA, 20 home runs, and a 31% hard contact rate to right-handed hitters during the regular season. All of the right-handed hitters in this lineup are in play.
- Cubs Offense (2016)
Team wOBA vs. LHP — 0.347 (2 of 30)
Team ISO vs. LHP — 0.182 (3 of 30)
Team K% vs. LHP — 20.1% (6 of 30)
Runs Per Game — 5.02 (3 of 30)
Projected Run Total — 3.88 (2 of 4)
Projected Lineup
| # | Player | Bats | wOBA vs. LHP | ISO vs. LHP | HC% vs. LHP | wOBA L14 | FD Position | FD Salary | DK Position | DK Salary |
|---|---|---|---|---|---|---|---|---|---|---|
| 1 | Dexter Fowler | SWITCH | 0.380 | 0.187 | 34.7% | 0.455 | OF | $3,600 | OF | $3,900 |
| 2 | Kris Bryant | RIGHT | 0.438 | 0.327 | 40.5% | 0.331 | 3B | $3,900 | 3B/OF | $4,300 |
| 3 | Anthony Rizzo | LEFT | 0.362 | 0.205 | 24.8% | 0.346 | 1B | $4,000 | 1B | $3,800 |
| 4 | Jorge Soler | RIGHT | 0.351 | 0.200 | 33.3% | 0.173 | OF | $2,500 | OF | $3,000 |
| 5 | Ben Zobrist | SWITCH | 0.367 | 0.154 | 31.3% | 0.495 | 2B | $3,100 | 2B | $4,000 |
| 6 | Addison Russell | RIGHT | 0.343 | 0.245 | 31.7% | 0.253 | SS | $2,500 | SS | $2,900 |
| 7 | Javier Baez | RIGHT | 0.359 | 0.164 | 30.6% | 0.366 | SS | $2,900 | 2B/3B | $4,200 |
| 8 | Willson Contreras | RIGHT | 0.365 | 0.189 | 28.8% | 0.598 | C | $2,900 | C/OF | $3,800 |
| 9 | John Lackey | RIGHT | 0.046 | 0.000 | 25.0% | 0.000 | P | $9,200 | P | $8,600 |
| Team Averages | — | 0.335 | 0.186 | 31.2% | 0.335 | — | — | — | — |
Elite Plays – Kris Bryant, Ben Zobrist
Secondary Plays – Dexter Fowler, Jorge Soler, Addison Russell, Javier Baez
Stackability – YELLOW / GREEN
San Francisco
The Giants’ postseason magic continued last night with a monster hit from Conor Gillaspie in the eighth and another one from Joe Panik in the 13th. It’s hard to see this team ever losing. They draw a fairly difficult matchup against John Lackey, but it’s certainly more favorable than last night’s matchup against Jake Arrieta. During the regular season, Lackey allowed a .303 wOBA and 34.1% hard contact to left-handed hitters.
- Giants Offense (2016)
Team wOBA vs. RHP — 0.318 (12 of 30)
Team ISO vs. RHP — 0.142 (27 of 30)
Team K% vs. RHP — 17.3% (2 of 30)
Runs Per Game — 4.41 (19 of 30)
Projected Run Total — 3.62 (3 of 4)
Projected Lineup
| # | Player | Bats | wOBA vs. RHP | ISO vs. RHP | HC% vs. RHP | wOBA L14 | FD Position | FD Salary | DK Position | DK Salary |
|---|---|---|---|---|---|---|---|---|---|---|
| 1 | Denard Span | LEFT | 0.338 | 0.139 | 26.8% | 0.406 | OF | $2,800 | OF | $4,000 |
| 2 | Brandon Belt | LEFT | 0.370 | 0.193 | 38.2% | 0.445 | 1B | $2,900 | 1B | $3,600 |
| 3 | Buster Posey | RIGHT | 0.324 | 0.134 | 35.7% | 0.296 | C | $2,800 | C | $3,500 |
| 4 | Hunter Pence | RIGHT | 0.348 | 0.129 | 27.6% | 0.299 | OF | $2,700 | OF | $3,100 |
| 5 | Angel Pagan | SWITCH | 0.334 | 0.132 | 24.8% | 0.338 | OF | $2,800 | OF | $3,700 |
| 6 | Brandon Crawford | LEFT | 0.334 | 0.180 | 34.0% | 0.445 | SS | $2,600 | SS | $3,900 |
| 7 | Joe Panik | LEFT | 0.313 | 0.166 | 26.5% | 0.265 | 2B | $2,800 | 2B | $3,600 |
| 8 | Conor Gillaspie | LEFT | 0.322 | 0.183 | 33.8% | 0.512 | 3B | $2,500 | 3B | $3,000 |
| 9 | Matt Moore | LEFT | 0.068 | 0.000 | 31.6% | 0.110 | P | $8,000 | P | $7,500 |
| Team Averages | — | 0.306 | 0.140 | 31.0% | 0.346 | — | — | — | — |