MLB Grind Down: Wednesday, October 5th

The RotoGrinders MLB Grind Down will give you an in-depth analysis into the upcoming MLB schedule. This article will break down the numbers for every single game and give you analysis on which trends you can exploit. While matchups are a major factor in daily fantasy baseball, there are plenty of other factors to consider such as injuries, weather, and salaries.
The analysis should point you in the right direction, but it is still up to you to decipher the information and make your own selections. No sport has more variance than baseball. The best choice is not always the right choice but following the trends will win you money over time.
Note: As always, if you want to try a new DFS site, be sure to click through a RotoGrinders link and use our DraftKings promo code and FanDuel promo code to receive the best perks in the industry.
Stackability Rating System:
GREEN – One of the top stacks of the day, viable in cash games and GPPs
YELLOW – A viable stack option in most formats, specifically GPPs
ORANGE – There are better stacks out there, but playable in large GPPs
RED – Not a recommended stack for cash games or GPPs
San Francisco at NY Mets – Wednesday, 8:05 PM ET
| San Francisco | NY Mets | ||||||||
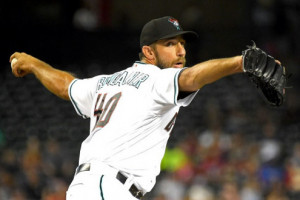
 | Madison Bumgarner |  | Noah Syndergaard | ||||||
| LEFT | RIGHT | ||||||||
| Vegas Moneyline | Vegas Over/Under | ||||||||
| SF -115 | 6.0 | ||||||||
| Stats | wOBA | HR All. | HC% | K% | Stats | wOBA | HR All. | HC% | K% |
|---|---|---|---|---|---|---|---|---|---|
| SP vs. Left (2016) | 0.223 | 4 | 25.2% | 33.3% | SP vs. Left (2016) | 0.309 | 6 | 31.3% | 28.1% |
| SP vs. Right (2016) | 0.279 | 22 | 32.9% | 26.2% | SP vs. Right (2016) | 0.252 | 5 | 25.6% | 30.3% |
Pitcher Grind Down
| Madison Bumgarner | ||||||||||
 | FanDuel | DraftKings | ||||||||
| Salary: | $10,000 | Salary: | $11,200 | |||||||
| FPPG: | 39.0 | FPPG: | 22.3 | |||||||
| Pitcher Rating: | 90.9 | Pitcher Rank: | 2 | |||||||
| Statistics | Starts | PitchPS | SIERA | ERA | K% | BB% | SS% | GB% | FB% | HC% |
|---|---|---|---|---|---|---|---|---|---|---|
| L30 Days | 6 | 103.7 | 3.04 | 3.92 | 28.0% | 3.2% | 12.4% | 42.9% | 45.7% | 30.5% |
| 2016 | 34 | 105.0 | 3.36 | 2.74 | 27.5% | 5.9% | 11.5% | 39.6% | 41.5% | 31.6% |
| 2015 | 32 | 103.5 | 3.00 | 2.93 | 26.9% | 4.5% | 12.5% | 41.7% | 35.6% | 27.8% |
Home (2015-16):—ERA: 2.04 — K%: 28.6% — wOBA Allowed: 0.241
Away (2015-16):—ERA: 3.75 — K%: 25.8% — wOBA Allowed: 0.296
The Giants didn’t have the best offensive finish to their season, but strong pitching put them in position to grab the final wildcard spot in the National League. Even if there are concerns about their offense, they have to feel good with their ace on the mound. In 34 starts this season, Madison Bumgarner posted a 3.36 SIERA with a strikeout rate of 27.5% and a walk rate of 5.9%. He is tough on hitters from both sides of the plate and he has as good of a postseason track record as anyone. In 14 career outings, he has a 2.14 ERA with a 0.88 WHIP. The line has moved in favor of Bumgarner and the Giants and I have these two pitchers with a nearly identical projection tonight.
| Noah Syndergaard | ||||||||||
 | FanDuel | DraftKings | ||||||||
| Salary: | $10,000 | Salary: | $10,500 | |||||||
| FPPG: | 39.2 | FPPG: | 21.7 | |||||||
| Pitcher Rating: | 92.3 | Pitcher Rank: | 1 | |||||||
| Statistics | Starts | PitchPS | SIERA | ERA | K% | BB% | SS% | GB% | FB% | HC% |
|---|---|---|---|---|---|---|---|---|---|---|
| L30 Days | 4 | 96.5 | 2.97 | 2.91 | 32.3% | 8.6% | 12.4% | 56.6% | 26.4% | 34.6% |
| 2016 | 30 | 97.8 | 2.95 | 2.60 | 29.3% | 5.8% | 14.2% | 51.2% | 27.2% | 28.1% |
| 2015 | 24 | 99.2 | 2.95 | 3.24 | 27.5% | 5.1% | 12.2% | 46.5% | 33.6% | 24.6% |
Home (2015-16):—ERA: 2.68 — K%: 28.7% — wOBA Allowed: 0.257
Away (2015-16):—ERA: 3.13 — K%: 28.3% — wOBA Allowed: 0.302
Even though this is only his second season, Noah Syndergaard has already made four postseason appearances (three starts). In 2015, he posted a 3.32 ERA with 26 strikeouts in only 19 innings of work. He has been dominant all season, boasting a 2.95 SIERA with a strikeout rate of 29.3% and a walk rate of 5.8%. It’s always tough to predict ownership in these situations, but I could see people leaning toward the more proven commodity in Madison Bumgarner and the Giants. I’m going to give the smallest of edges to Syndergaard here, as the Giants’ offense has been much worse than the Mets’ offense recently. Over the last month of play, San Francisco has the fourth lowest team wOBA.
Batter Grind Down
San Francisco
The Giants and Mets have an over/under of 6.0 runs, which is significantly lower than the other two games in this slate. In addition to an elite strikeout rate, Noah Syndergaard has held both left and right-handed hitters under a .310 wOBA this season. Ideally, I’d like to fade the Giants’ offense altogether, but if you have to target someone in this matchup, give an edge to those that can hit from the left side of the plate.
- Giants Offense (2016)
Team wOBA vs. RHP — 0.318 (12 of 30)
Team ISO vs. RHP — 0.142 (27 of 30)
Team K% vs. RHP — 17.3% (2 of 30)
Runs Per Game — 4.41 (19 of 30)
Projected Run Total — 3.09 (3 of 4)
Projected Lineup
| # | Player | Bats | wOBA vs. RHP | ISO vs. RHP | HC% vs. RHP | wOBA L14 | FD Position | FD Salary | DK Position | DK Salary |
|---|---|---|---|---|---|---|---|---|---|---|
| 1 | Denard Span | LEFT | 0.338 | 0.139 | 26.8% | 0.406 | OF | $2,600 | OF | $4,000 |
| 2 | Brandon Belt | LEFT | 0.370 | 0.193 | 38.2% | 0.445 | 1B | $2,800 | 1B | $3,700 |
| 3 | Buster Posey | RIGHT | 0.324 | 0.134 | 35.7% | 0.296 | C | $2,700 | C | $3,400 |
| 4 | Hunter Pence | RIGHT | 0.348 | 0.129 | 27.6% | 0.299 | OF | $2,500 | OF | $3,300 |
| 5 | Brandon Crawford | LEFT | 0.334 | 0.180 | 34.0% | 0.445 | SS | $2,500 | SS | $3,800 |
| 6 | Joe Panik | LEFT | 0.313 | 0.166 | 26.5% | 0.265 | 2B | $2,800 | 2B | $3,500 |
| 7 | Angel Pagan | SWITCH | 0.334 | 0.132 | 24.8% | 0.338 | OF | $2,500 | OF | $4,000 |
| 8 | Conor Gillaspie | LEFT | 0.322 | 0.183 | 33.8% | 0.512 | 3B | $2,500 | 3B | $2,800 |
| 9 | Madison Bumgarner | LEFT | 0.255 | 0.145 | 33.3% | 0.512 | P | $10,000 | P | $11,200 |
| Team Averages | — | 0.326 | 0.156 | 31.2% | 0.391 | — | — | — | — |
Elite Plays – NONE
Secondary Plays – Denard Span, Brandon Belt, Brandon Crawford
Stackability – ORANGE
NY Mets
The Mets draw one of the most difficult matchups in all of baseball, but they do have a few things going for them in this matchup. On the season, they are ranked tenth in team wOBA and sixth in team ISO against left-handed pitching this season. They playing at home and their offense has been firing on all cylinders over the last month of play. I’m not sure that’s enough to overcome a matchup against Madison Bumgarner, who has held both left and right-handed hitters under a .280 wOBA this season.
- Mets Offense (2016)
Team wOBA vs. LHP — 0.324 (10 of 30)
Team ISO vs. LHP — 0.174 (6 of 30)
Team K% vs. LHP — 22.3% (17 of 30)
Runs Per Game — 4.14 (25 of 30)
Projected Run Total — 2.91 (4 of 4)
Projected Lineup
| # | Player | Bats | wOBA vs. LHP | ISO vs. LHP | HC% vs. LHP | wOBA L14 | FD Position | FD Salary | DK Position | DK Salary |
|---|---|---|---|---|---|---|---|---|---|---|
| 1 | Jose Reyes | SWITCH | 0.492 | 0.360 | 39.5% | 0.313 | 3B | $2,800 | 3B | $3,900 |
| 2 | Asdrubal Cabrera | SWITCH | 0.356 | 0.143 | 39.8% | 0.404 | SS | $2,700 | SS | $3,700 |
| 3 | Yoenis Cespedes | RIGHT | 0.441 | 0.282 | 47.8% | 0.278 | OF | $3,200 | OF | $4,200 |
| 4 | Curtis Granderson | LEFT | 0.312 | 0.199 | 35.9% | 0.493 | OF | $2,900 | OF | $3,900 |
| 5 | Jay Bruce | LEFT | 0.289 | 0.190 | 33.3% | 0.510 | OF | $2,700 | OF | $3,800 |
| 6 | T.J. Rivera | RIGHT | 0.201 | 0.000 | 32.0% | 0.339 | 2B | $2,700 | 2B/3B | $3,100 |
| 7 | Lucas Duda | LEFT | 0.200 | 0.133 | 13.6% | 0.300 | 1B | $2,300 | 1B | $3,200 |
| 8 | Rene Rivera | RIGHT | 0.400 | 0.200 | 41.7% | 0.261 | C | $2,300 | C | $2,500 |
| 9 | Noah Syndergaard | RIGHT | 0.143 | 0.000 | 50.0% | 0.439 | P | $10,000 | P | $10,500 |
| Team Averages | — | 0.315 | 0.167 | 37.1% | 0.371 | — | — | — | — |
Elite Plays – NONE
Secondary Plays – Jose Reyes, Asdrubal Cabrera, Yoenis Cespedes
Stackability – ORANGE
Boston at Cleveland – Thursday, 8:05 PM ET
| Boston | Cleveland | ||||||||
 | Rick Porcello |  | Trevor Bauer | ||||||
| RIGHT | RIGHT | ||||||||
| Vegas Moneyline | Vegas Over/Under | ||||||||
| BOS -140 | 8.5 | ||||||||
| Stats | wOBA | HR All. | HC% | K% | Stats | wOBA | HR All. | HC% | K% |
|---|---|---|---|---|---|---|---|---|---|
| SP vs. Left (2016) | 0.261 | 8 | 32.1% | 21.4% | SP vs. Left (2016) | 0.299 | 8 | 36.5% | 25.1% |
| SP vs. Right (2016) | 0.289 | 15 | 27.9% | 21.1% | SP vs. Right (2016) | 0.320 | 12 | 28.2% | 16.8% |
Pitcher Grind Down
| Rick Porcello | ||||||||||
 | FanDuel | DraftKings | ||||||||
| Salary: | $9,900 | Salary: | $9,300 | |||||||
| FPPG: | 38.4 | FPPG: | 20.5 | |||||||
| Pitcher Rating: | 67.5 | Pitcher Rank:3 | ||||||||
| Statistics | Starts | PitchPS | SIERA | ERA | K% | BB% | SS% | GB% | FB% | HC% |
|---|---|---|---|---|---|---|---|---|---|---|
| L30 Days | 6 | 105.8 | 3.75 | 2.70 | 22.0% | 2.4% | 10.1% | 34.7% | 46.8% | 28.0% |
| 2016 | 33 | 103.3 | 3.78 | 3.15 | 21.2% | 3.6% | 8.2% | 43.1% | 38.0% | 30.0% |
| 2015 | 28 | 98.0 | 3.73 | 4.92 | 20.2% | 5.2% | 8.5% | 45.7% | 32.5% | 32.8% |
Home (2015-16):—ERA: 3.52 — K%: 21.2% — wOBA Allowed: 0.297
Away (2015-16):—ERA: 4.28 — K%: 20.4% — wOBA Allowed: 0.311
Porcello finished the season strong, posting a 2.70 ERA with a strikeout rate of 22% in his last six starts. He has great command of all his pitches and he is generally able to limit the hard contact against him. He has made eight postseason appearances, posting a 4.41 ERA (2.17 FIP) with a strikeout rate of 18.3%. The biggest issue with Porcello here is his matchup against the Indians, who were ranked tenth or better in team wOBA, team ISO, and team K% against right-handed pitching this season. The good news is that he is a sizable favorite in this game thanks to the fact that the Indians have to start Trevor Bauer. Porcello is a decent play here, although he makes more sense in tomorrow’s slate that isn’t going to have Noah Syndergaard and Madison Bumgarner in the player pool.
| Trevor Bauer | ||||||||||
 | FanDuel | DraftKings | ||||||||
| Salary: | $7,800 | Salary: | $7,000 | |||||||
| FPPG: | 27.1 | FPPG: | 13.7 | |||||||
| Pitcher Rating: | 52.7 | Pitcher Rank:4 | ||||||||
| Statistics | Starts | PitchPS | SIERA | ERA | K% | BB% | SS% | GB% | FB% | HC% |
|---|---|---|---|---|---|---|---|---|---|---|
| L30 Days | 6 | 95.0 | 4.11 | 6.39 | 20.3% | 7.4% | 9.3% | 48.2% | 27.7% | 27.2% |
| 2016 | 28 | 110.4 | 4.22 | 4.26 | 20.7% | 8.6% | 9.0% | 48.7% | 30.8% | 31.9% |
| 2015 | 30 | 95.6 | 4.20 | 4.55 | 22.9% | 10.6% | 9.6% | 39.2% | 40.7% | 31.0% |
Home (2015-16):—ERA: 5.14 — K%: 21.1% — wOBA Allowed: 0.335
Away (2015-16):—ERA: 3.50 — K%: 22.5% — wOBA Allowed: 0.283
Carlos Carrasco (hand) is on the DL, Danny Salazar (forearm) is not on the active roster for this series, and Corey Kluber isn’t expected to pitch until Game 2. The Indians basically ran out of options and now have to put Bauer on the mound for Game 1 of the ALDS. Bauer has a decent strikeout rate, but he has to be considered one of the most hittable starters left in the postseason. In 28 starts this season, he had a 4.22 SIERA with a strikeout rate of 20.7%. He isn’t particularly effective against hitters from either side of the plate and he has allowed a hard contact rate of 31.9%. To make matters worse, he has to face the best offense in baseball. Bauer is an easy fade against the Red Sox at home.
Batter Grind Down
Boston
The Red Sox have the highest implied team total in this two-day slate. They draw the best matchup on the board and they were ranked first in team wOBA against right-handed pitching during the regular season. Hitters from both sides of the plate are worth a look here and this could be a situation where we try to stack the Red Sox in both cash games and tournaments. In 2016, Trevor Bauer allowed a .320 wOBA to right-handed hitters and a 36.5% hard contact rate to left-handed hitters.
- Red Sox Offense (2016)
Team wOBA vs. RHP — 0.348 (1 of 30)
Team ISO vs. RHP — 0.183 (5 of 30)
Team K% vs. RHP — 18.0% (3 of 30)
Runs Per Game — 5.42 (1 of 30)
Projected Run Total — 4.48 (1 of 4)
Confirmed Lineup
| # | Player | Bats | wOBA vs. RHP | ISO vs. RHP | HC% vs. RHP | wOBA L14 | FD Position | FD Salary | DK Position | DK Salary |
|---|---|---|---|---|---|---|---|---|---|---|
| 1 | Dustin Pedroia | RIGHT | 0.358 | 0.136 | 33.1% | 0.295 | 2B | $3,400 | 2B | $4,200 |
| 2 | Brock Holt | LEFT | 0.329 | 0.147 | 25.5% | 0.234 | OF | $2,900 | OF | $3,300 |
| 3 | Mookie Betts | RIGHT | 0.388 | 0.208 | 33.0% | 0.429 | OF | $4,200 | OF | $5,600 |
| 4 | David Ortiz | LEFT | 0.435 | 0.350 | 46.2% | 0.396 | 1B | $4,300 | 1B | $5,500 |
| 5 | Hanley Ramirez | RIGHT | 0.342 | 0.185 | 36.8% | 0.295 | 1B | $4,100 | 1B | $4,000 |
| 6 | Xander Bogaerts | RIGHT | 0.340 | 0.146 | 29.7% | 0.325 | SS | $3,900 | SS | $4,000 |
| 7 | Jackie Bradley Jr. | LEFT | 0.378 | 0.261 | 38.5% | 0.268 | OF | $3,500 | OF | $4,200 |
| 8 | Sandy Leon | SWITCH | 0.329 | 0.141 | 34.1% | 0.124 | C | $2,900 | C | $2,900 |
| 9 | Andrew Benintendi | LEFT | 0.416 | 0.247 | 34.4% | 0.329 | OF | $2,900 | OF | $2,900 |
| Team Averages | — | 0.368 | 0.202 | 34.6% | 0.299 | — | — | — | — |
Elite Plays – Dustin Pedroia, Mookie Betts, David Ortiz
Secondary Plays – Brock Holt, Hanley Ramirez, Xander Bogaerts, Jackie Bradley Jr., Sandy Leon
Stackability – GREEN
Cleveland
The Indians need a big outing from their offense if they are going to pull the upset in Game 1 of the ALDS. Even though they are underdogs in this matchup, their offense is still in a decent spot. They were ranked inside the top ten in almost every offensive category against right-handed pitching this season and they have a respectable projection of 4.02 runs. Rick Porcello has been tough on hitters from both sides of the plate, but he did allow a 32.1% hard contact rate to left-handed hitters this season.
- Indians Offense (2016)
Team wOBA vs. RHP — 0.328 (7 of 30)
Team ISO vs. RHP — 0.175 (9 of 30)
Team K% vs. RHP — 20.1% (10 of 30)
Runs Per Game — 4.83 (4 of 30)
Projected Run Total — 4.02 (2 of 4)
Projected Lineup
| # | Player | Bats | wOBA vs. RHP | ISO vs. RHP | HC% vs. RHP | wOBA L14 | FD Position | FD Salary | DK Position | DK Salary |
|---|---|---|---|---|---|---|---|---|---|---|
| 1 | Carlos Santana | SWITCH | 0.388 | 0.285 | 39.5% | 0.526 | 1B | $3,800 | 1B | $4,700 |
| 2 | Jason Kipnis | LEFT | 0.353 | 0.200 | 38.9% | 0.333 | 2B | $3,900 | 2B | $4,300 |
| 3 | Francisco Lindor | SWITCH | 0.351 | 0.139 | 26.8% | 0.320 | SS | $3,300 | SS | $3,900 |
| 4 | Mike Napoli | RIGHT | 0.338 | 0.242 | 34.9% | 0.178 | 1B | $3,500 | 1B | $3,600 |
| 5 | Jose Ramirez | SWITCH | 0.351 | 0.146 | 25.5% | 0.398 | 3B | $3,500 | 3B/OF | $4,100 |
| 6 | Lonnie Chisenhall | LEFT | 0.333 | 0.156 | 28.1% | 0.197 | OF | $2,900 | OF | $2,700 |
| 7 | Rajai Davis | RIGHT | 0.308 | 0.138 | 26.6% | 0.159 | OF | $3,100 | OF | $3,200 |
| 8 | Tyler Naquin | LEFT | 0.378 | 0.225 | 40.3% | 0.282 | OF | $2,700 | OF | $3,000 |
| 9 | Yan Gomes | RIGHT | 0.191 | 0.155 | 28.6% | 1.007 | C | $2,500 | C | $2,500 |
| Team Averages | — | 0.332 | 0.187 | 32.1% | 0.378 | — | — | — | — |
Elite Plays – NONE
Secondary Plays – Carlos Santana, Jason Kipnis, Francisco Lindor, Mike Napoli, Jose Ramirez
Stackability – YELLOW
Toronto at Texas – Thursday, 8:05 PM ET
Note: The starting pitchers have yet to be announced for this game. We will update the Grind Down as soon as they are announced.