MLB Grind Down: Sunday, October 9th

The RotoGrinders MLB Grind Down will give you an in-depth analysis into the upcoming MLB schedule. This article will break down the numbers for every single game and give you analysis on which trends you can exploit. While matchups are a major factor in daily fantasy baseball, there are plenty of other factors to consider such as injuries, weather, and salaries.
The analysis should point you in the right direction, but it is still up to you to decipher the information and make your own selections. No sport has more variance than baseball. The best choice is not always the right choice but following the trends will win you money over time.
Note: As always, if you want to try a new DFS site, be sure to click through a RotoGrinders link and use our DraftKings promo code and FanDuel promo code to receive the best perks in the industry.
Stackability Rating System:
GREEN – One of the top stacks of the day, viable in cash games and GPPs
YELLOW – A viable stack option in most formats, specifically GPPs
ORANGE – There are better stacks out there, but playable in large GPPs
RED – Not a recommended stack for cash games or GPPs
LA Dodgers at Washington – 1:05 PM ET
| LA Dodgers | Washington | ||||||||
 | Rich Hill |  | Tanner Roark | ||||||
| LEFT | RIGHT | ||||||||
| Vegas Moneyline | Vegas Over/Under | ||||||||
| LAD -115 | 7.5 | ||||||||
| Stats | wOBA | HR All. | HC% | K% | Stats | wOBA | HR All. | HC% | K% |
|---|---|---|---|---|---|---|---|---|---|
| SP vs. Left (2016) | 0.232 | 0 | 23.9% | 18.3% | SP vs. Left (2016) | 0.281 | 6 | 29.2% | 18.8% |
| SP vs. Right (2016) | 0.244 | 4 | 29.8% | 32.4% | SP vs. Right (2016) | 0.283 | 11 | 20.0% | 21.3% |
Pitcher Grind Down
| Rich Hill | ||||||||||
 | FanDuel | DraftKings | ||||||||
| Salary: | $9,000 | Salary: | $9,600 | |||||||
| FPPG: | 39.2 | FPPG: | 21.6 | |||||||
| Pitcher Rating: | 90.8 | Pitcher Rank: | 1 | |||||||
| Statistics | Starts | PitchPS | SIERA | ERA | K% | BB% | SS% | GB% | FB% | HC% |
|---|---|---|---|---|---|---|---|---|---|---|
| L30 Days | 5 | 86.0 | 2.59 | 2.22 | 34.3% | 4.8% | 10.9% | 31.1% | 41.0% | 34.4% |
| 2016 | 20 | 91.0 | 3.29 | 2.12 | 29.4% | 7.5% | 10.6% | 45.3% | 35.8% | 28.3% |
| 2015 | 4 | 108.5 | 2.29 | 1.55 | 34.0% | 4.7% | 11.3% | 48.4% | 35.5% | 22.2% |
Home (2015-16):—ERA: 2.04 — K%: 27.0% — wOBA Allowed: 0.242
Away (2015-16):—ERA: 1.98 — K%: 32.7% — wOBA Allowed: 0.223
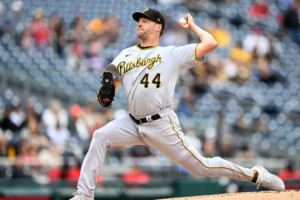
At the beginning of the season, it was hard to imagine that the Dodgers would have a southpaw with nearly as good of numbers as Clayton Kershaw. In 20 starts, Hill had a 2.12 ERA with a strikeout rate of 29.4%. The only knock on him is that he typically doesn’t pitch deep into games (91 pitches per start this season, 86 in his last five). He has been as effective on the road as he has been at home and he is listed as a small favorite today against the Nationals. The Dodgers are looking to head back to Los Angeles up 2-0 in the series.
| Tanner Roark | ||||||||||
 | FanDuel | DraftKings | ||||||||
| Salary: | $8,000 | Salary: | $9,000 | |||||||
| FPPG: | 33.5 | FPPG: | 17.4 | |||||||
| Pitcher Rating: | 69.8 | Pitcher Rank: | 2 | |||||||
| Statistics | Starts | PitchPS | SIERA | ERA | K% | BB% | SS% | GB% | FB% | HC% |
|---|---|---|---|---|---|---|---|---|---|---|
| L30 Days | 6 | 94.8 | 4.59 | 2.60 | 23.2% | 12.7% | 10.0% | 46.1% | 32.6% | 22.2% |
| 2016 | 33 | 101.7 | 4.32 | 2.83 | 20.1% | 8.5% | 8.9% | 48.7% | 31.2% | 24.3% |
| 2015 | 12 | 150.0 | 4.16 | 4.38 | 15.0% | 5.6% | 7.1% | 47.8% | 30.6% | 26.3% |
Home (2015-16):—ERA: 3.25 — K%: 20.0% — wOBA Allowed: 0.297
Away (2015-16):—ERA: 3.47 — K%: 16.8% — wOBA Allowed: 0.304
Roark had a career year, posting a 2.83 ERA with a strikeout rate of 20.1%. He has been a regression candidate all season though, as his peripheral statistics aren’t nearly as good. While he does get to pitch at home, he draws a difficult matchup against the Dodgers, who were ranked sixth in team wOBA and seventh in team ISO against right-handed pitching. Roark comes in as the lowest ranked pitcher in this two-game slate.
Batter Grind Down
LA Dodgers
The Dodgers come into today’s game with the second-highest implied team total in the slate. While Tanner Roark has held both left and right-handed hitters under a .285 wOBA, he had a 4.85 xFIP against left-handed hitters. All of the lefties in this lineup are in play, as is Justin Turner, who loves playing in Nationals Park.
- Dodgers Offense (2016)
Team wOBA vs. RHP — 0.331 (6 of 30)
Team ISO vs. RHP — 0.177 (7 of 30)
Team K% vs. RHP — 21.1% (18 of 30)
Runs Per Game — 4.48 (14 of 30)
Projected Run Total — 3.84 (5 of 6)
Confirmed Lineup
| # | Player | Bats | wOBA vs. RHP | ISO vs. RHP | HC% vs. RHP | wOBA L14 | FD Position | FD Salary | DK Position | DK Salary |
|---|---|---|---|---|---|---|---|---|---|---|
| 1 | Chase Utley | LEFT | 0.334 | 0.152 | 38.8% | 0.325 | 2B | $2,900 | 2B | $3,500 |
| 2 | Corey Seager | LEFT | 0.400 | 0.223 | 39.6% | 0.277 | SS | $3,700 | SS | $4,500 |
| 3 | Justin Turner | RIGHT | 0.385 | 0.258 | 37.2% | 0.370 | 3B | $3,600 | 3B | $4,400 |
| 4 | Adrian Gonzalez | LEFT | 0.362 | 0.185 | 36.9% | 0.335 | 1B | $2,900 | 1B | $3,800 |
| 5 | Josh Reddick | LEFT | 0.371 | 0.163 | 32.8% | 0.388 | OF | $2,800 | OF | $3,900 |
| 6 | Joc Pederson | LEFT | 0.386 | 0.278 | 41.3% | 0.446 | OF | $3,100 | OF | $3,900 |
| 7 | Yasmani Grandal | SWITCH | 0.351 | 0.268 | 39.7% | 0.435 | C | $2,900 | C | $3,700 |
| 8 | Andrew Toles | LEFT | 0.375 | 0.185 | 32.4% | 0.227 | OF | $2,100 | OF | $2,400 |
| 9 | Rich Hill | LEFT | 0.000 | 0.000 | 0.0% | 0.000 | P | $9,000 | P | $9,600 |
| Team Averages | — | 0.329 | 0.190 | 33.2% | 0.311 | — | — | — | — |
Elite Plays – Corey Seager, Adrian Gonzalez
Secondary Plays – Chase Utley, Justin Turner, Josh Reddick, Yasmani Grandal
Stackability – YELLOW / GREEN
Washington
The Nationals need to find a way to win this game or they will fall in an 0-2 hole against the Dodgers. Unfortunately, they draw the most difficult matchup in the slate. In the regular season, Rich Hill held both left and right-handed hitters under a .245 wOBA. Jayson Werth is on my radar in all formats, but the rest of the Nationals’ hitters are secondary plays at best.
- Nationals Offense (2016)
Team wOBA vs. LHP — 0.332 (4 of 30)
Team ISO vs. LHP — 0.196 (2 of 30)
Team K% vs. LHP — 20.9% (11 of 30)
Runs Per Game — 4.71 (8 of 30)
Projected Run Total — 3.66 (6 of 6)
Confirmed Lineup
| # | Player | Bats | wOBA vs. LHP | ISO vs. LHP | HC% vs. LHP | wOBA L14 | FD Position | FD Salary | DK Position | DK Salary |
|---|---|---|---|---|---|---|---|---|---|---|
| 1 | Trea Turner | RIGHT | 0.325 | 0.095 | 42.0% | 0.341 | OF | $3,800 | 2B/OF | $4,700 |
| 2 | Bryce Harper | LEFT | 0.322 | 0.212 | 31.4% | 0.281 | OF | $3,500 | OF | $3,800 |
| 3 | Jayson Werth | RIGHT | 0.432 | 0.298 | 46.3% | 0.298 | OF | $3,200 | OF | $3,300 |
| 4 | Daniel Murphy | LEFT | 0.383 | 0.219 | 31.2% | 0.000 | 2B | $3,700 | 2B | $4,200 |
| 5 | Anthony Rendon | RIGHT | 0.355 | 0.143 | 34.9% | 0.263 | 3B | $3,100 | 3B | $3,900 |
| 6 | Ryan Zimmerman | RIGHT | 0.292 | 0.200 | 39.7% | 0.329 | 1B | $2,900 | 1B | $3,400 |
| 7 | Danny Espinosa | SWITCH | 0.297 | 0.261 | 40.7% | 0.260 | SS | $2,800 | SS | $3,100 |
| 8 | Jose Lobaton | SWITCH | 0.200 | 0.200 | 20.0% | 0.323 | C | $2,300 | C | $3,000 |
| 9 | Tanner Roark | RIGHT | 0.129 | 0.071 | 16.7% | 0.138 | P | $8,000 | P | $9,000 |
| Team Averages | — | 0.304 | 0.189 | 33.7% | 0.248 | — | — | — | — |
Elite Plays – Jayson Werth
Secondary Plays – Trea Turner, Jayson Werth
Stackability – ORANGE
Cleveland at Boston – 4:05 PM ET
| Cleveland | Boston | ||||||||
 | Josh Tomlin |  | Clay Buchholz | ||||||
| RIGHT | RIGHT | ||||||||
| Vegas Moneyline | Vegas Over/Under | ||||||||
| BOS -142 | 9.5 | ||||||||
| Stats | wOBA | HR All. | HC% | K% | Stats | wOBA | HR All. | HC% | K% |
|---|---|---|---|---|---|---|---|---|---|
| SP vs. Left (2016) | 0.287 | 14 | 37.1% | 15.6% | SP vs. Left (2016) | 0.342 | 6 | 35.8% | 15.0% |
| SP vs. Right (2016) | 0.356 | 22 | 31.6% | 16.8% | SP vs. Right (2016) | 0.300 | 15 | 26.8% | 16.7% |
Pitcher Grind Down
| Josh Tomlin | ||||||||||
 | FanDuel | DraftKings | ||||||||
| Salary: | $6,900 | Salary: | $7,400 | |||||||
| FPPG: | 25.9 | FPPG: | 12.8 | |||||||
| Pitcher Rating: | 53.7 | Pitcher Rank: | 4 | |||||||
| Statistics | Starts | PitchPS | SIERA | ERA | K% | BB% | SS% | GB% | FB% | HC% |
|---|---|---|---|---|---|---|---|---|---|---|
| L30 Days | 4 | 87.8 | 4.59 | 1.69 | 10.1% | 0.0% | 7.7% | 46.6% | 31.8% | 25.8% |
| 2016 | 29 | 90.1 | 4.24 | 4.40 | 16.3% | 2.8% | 7.4% | 43.8% | 35.2% | 34.1% |
| 2015 | 10 | 94.9 | 3.46 | 3.02 | 22.7% | 3.2% | 9.4% | 37.5% | 46.2% | 33.2% |
Home (2015-16):—ERA: 3.95 — K%: 18.4% — wOBA Allowed: 0.322
Away (2015-16):—ERA: 4.08 — K%: 17.5% — wOBA Allowed: 0.306
Tomlin has been one of my favorite pitchers to pick on this season. He is a slow-throwing right-hander that gives up a lot of hard contact. In 29 starts during the regular season, he posted a 4.24 SIERA with a strikeout rate of 16.3% and a hard contact rate of 34.1%. He draws a terrible matchup against the Red Sox, who are in a win-or-stay-home game at home. During the regular season, Boston led the majors in team wOBA and runs scored per game.
| Clay Buchholz | ||||||||||
 | FanDuel | DraftKings | ||||||||
| Salary: | $6,400 | Salary: | $7,000 | |||||||
| FPPG: | 15.4 | FPPG: | 7.3 | |||||||
| Pitcher Rating: | 50.9 | Pitcher Rank: | 5 | |||||||
| Statistics | Starts | PitchPS | SIERA | ERA | K% | BB% | SS% | GB% | FB% | HC% |
|---|---|---|---|---|---|---|---|---|---|---|
| L30 Days | 5 | 85.4 | 4.91 | 3.14 | 17.8% | 8.5% | 10.3% | 38.8% | 51.8% | 36.1% |
| 2016 | 21 | 106.0 | 5.09 | 4.78 | 15.8% | 9.4% | 9.5% | 41.2% | 43.0% | 31.3% |
| 2015 | 18 | 95.3 | 3.35 | 3.26 | 22.8% | 4.9% | 10.6% | 48.3% | 30.5% | 23.7% |
Home (2015-16):—ERA: 4.68 — K%: 17.3% — wOBA Allowed: 0.337
Away (2015-16):—ERA: 3.45 — K%: 20.8% — wOBA Allowed: 0.275
Buchholz had one of his worst seasons as a pro, posting a 5.09 SIERA with a strikeout rate of only 15.8%. He is listed as a sizable favorite today, but his matchup against the Indians is less than ideal. During the regular season, Cleveland was ranked tenth or better in team wOBA, team ISO, and team K% against right-handed pitching. I like the potential run support for Buchholz, but there is a good chance that he doesn’t pitch deep enough into the game to even be eligible for the win.
Batter Grind Down
Cleveland
The Indians are one game away from advancing to the ALCS, but they have a tough test ahead of them playing in Fenway. They draw a favorable matchup against Clay Buchholz, who has allowed a .342 wOBA to left-handed hitters this season.
- Indians Offense (2016)
Team wOBA vs. RHP — 0.328 (7 of 30)
Team ISO vs. RHP — 0.175 (9 of 30)
Team K% vs. RHP — 20.1% (10 of 30)
Runs Per Game — 4.83 (4 of 30)
Projected Run Total — 4.50 (3 of 6)
Projected Lineup
| # | Player | Bats | wOBA vs. RHP | ISO vs. RHP | HC% vs. RHP | wOBA L14 | FD Position | FD Salary | DK Position | DK Salary |
|---|---|---|---|---|---|---|---|---|---|---|
| 1 | Carlos Santana | SWITCH | 0.388 | 0.285 | 39.5% | 0.526 | 1B | $3,500 | 1B | $4,900 |
| 2 | Jason Kipnis | LEFT | 0.353 | 0.200 | 38.9% | 0.333 | 2B | $3,700 | 2B | $4,800 |
| 3 | Francisco Lindor | SWITCH | 0.351 | 0.139 | 26.8% | 0.320 | SS | $3,400 | SS | $4,700 |
| 4 | Mike Napoli | RIGHT | 0.338 | 0.242 | 34.9% | 0.178 | 1B | $3,300 | 1B | $3,900 |
| 5 | Jose Ramirez | SWITCH | 0.351 | 0.146 | 25.5% | 0.398 | 3B | $3,400 | 3B/OF | $4,500 |
| 6 | Lonnie Chisenhall | LEFT | 0.333 | 0.156 | 28.1% | 0.197 | OF | $2,900 | OF | $3,500 |
| 7 | Coco Crisp | SWITCH | 0.309 | 0.175 | 24.6% | 0.381 | OF | $2,900 | OF | $3,700 |
| 8 | Tyler Naquin | LEFT | 0.378 | 0.225 | 40.3% | 0.282 | OF | $2,600 | OF | $3,600 |
| 9 | Roberto Perez | RIGHT | 0.247 | 0.087 | 25.9% | 0.307 | C | $2,300 | C | $2,800 |
| Team Averages | — | 0.339 | 0.184 | 31.6% | 0.325 | — | — | — | — |
Elite Plays – Jason Kipnis
Secondary Plays – Carlos Santana, Francisco Lindor, Mike Napoli, Lonnie Chisenhall
Stackability – YELLOW
Boston
This could be David Ortiz final major league baseball game. Let that sink in for a minute. Something tells me that the Red Sox aren’t going to go out that way though, as they were one of the best home teams in baseball during the regular season. I will be stacking the Red Sox in all formats today, as they square off against the hittable Josh Tomlin.
- Red Sox Offense (2016)
Team wOBA vs. RHP — 0.348 (1 of 30)
Team ISO vs. RHP — 0.183 (5 of 30)
Team K% vs. RHP — 18.0% (3 of 30)
Runs Per Game — 5.42 (1 of 30)
Projected Run Total — 5.00 (2 of 6)
Projected Lineup
| # | Player | Bats | wOBA vs. RHP | ISO vs. RHP | HC% vs. RHP | wOBA L14 | FD Position | FD Salary | DK Position | DK Salary |
|---|---|---|---|---|---|---|---|---|---|---|
| 1 | Dustin Pedroia | RIGHT | 0.358 | 0.136 | 33.1% | 0.295 | 2B | $3,300 | 2B | $4,200 |
| 2 | Brock Holt | LEFT | 0.329 | 0.147 | 25.5% | 0.234 | OF | $2,900 | 3B/OF | $3,400 |
| 3 | Mookie Betts | RIGHT | 0.388 | 0.208 | 33.0% | 0.429 | OF | $4,200 | OF | $5,300 |
| 4 | David Ortiz | LEFT | 0.435 | 0.350 | 46.2% | 0.396 | 1B | $4,300 | 1B | $5,200 |
| 5 | Hanley Ramirez | RIGHT | 0.342 | 0.185 | 36.8% | 0.295 | 1B | $3,900 | 1B | $3,800 |
| 6 | Xander Bogaerts | RIGHT | 0.340 | 0.146 | 29.7% | 0.325 | SS | $3,600 | SS | $4,100 |
| 7 | Andrew Benintendi | LEFT | 0.416 | 0.247 | 34.4% | 0.329 | OF | $2,900 | OF | $3,000 |
| 8 | Sandy Leon | SWITCH | 0.329 | 0.141 | 34.1% | 0.124 | C | $2,600 | C | $3,300 |
| 9 | Jackie Bradley Jr. | LEFT | 0.378 | 0.261 | 38.5% | 0.268 | OF | $3,500 | OF | $4,000 |
| Team Averages | — | 0.368 | 0.202 | 34.6% | 0.299 | — | — | — | — |
Elite Plays – Dustin Pedroia, Brock Holt, David Ortiz, Mookie Betts
Secondary Plays – Hanley Ramirez, Sandy Leon
Stackability – GREEN
Texas at Toronto – 7:35 PM ET
| Texas | Toronto | ||||||||
 | Colby Lewis |  | Aaron Sanchez | ||||||
| RIGHT | RIGHT | ||||||||
| Vegas Moneyline | Vegas Over/Under | ||||||||
| TOR -190 | 9.0 | ||||||||
| Stats | wOBA | HR All. | HC% | K% | Stats | wOBA | HR All. | HC% | K% |
|---|---|---|---|---|---|---|---|---|---|
| SP vs. Left (2016) | 0.295 | 8 | 37.3% | 13.3% | SP vs. Left (2016) | 0.292 | 11 | 32.7% | 21.1% |
| SP vs. Right (2016) | 0.302 | 11 | 36.7% | 17.5% | SP vs. Right (2016) | 0.260 | 4 | 27.9% | 19.6% |
Pitcher Grind Down
| Colby Lewis | ||||||||||
 | FanDuel | DraftKings | ||||||||
| Salary: | $6,500 | Salary: | $6,500 | |||||||
| FPPG: | 26.1 | FPPG: | 13.6 | |||||||
| Pitcher Rating: | 37.0 | Pitcher Rank: | 6 | |||||||
| Statistics | Starts | PitchPS | SIERA | ERA | K% | BB% | SS% | GB% | FB% | HC% |
|---|---|---|---|---|---|---|---|---|---|---|
| L30 Days | 4 | 82.8 | 5.98 | 6.38 | 13.8% | 10.3% | 7.3% | 25.0% | 53.1% | 36.9% |
| 2016 | 19 | 92.1 | 4.95 | 3.71 | 15.5% | 5.9% | 8.0% | 34.1% | 47.4% | 37.0% |
| 2015 | 33 | 96.4 | 4.43 | 4.66 | 16.5% | 4.9% | 8.2% | 33.7% | 44.2% | 33.3% |
Home (2015-16):—ERA: 4.89 — K%: 15.7% — wOBA Allowed: 0.319
Away (2015-16):—ERA: 3.72 — K%: 16.6% — wOBA Allowed: 0.302
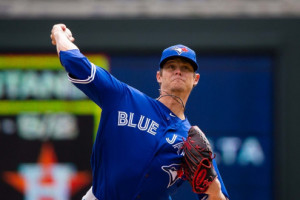
It’s hard to believe that the Rangers’ playoff lives hinge on a start from Colby Lewis. They are a game away from being swept by the Blue Jays, who seem to have their number in the postseason (five straight wins). Lewis draws arguably the worst matchup in the slate and he has to face the Jays in the hitter-friendly Rogers Centre. This is not the spot to get cute with your pitcher. Lewis is an easy fade in all formats.
| Aaron Sanchez | ||||||||||
 | FanDuel | DraftKings | ||||||||
| Salary: | $9,000 | Salary: | $10,500 | |||||||
| FPPG: | 34.8 | FPPG: | 18.3 | |||||||
| Pitcher Rating: | 69.8 | Pitcher Rank: | 3 | |||||||
| Statistics | Starts | PitchPS | SIERA | ERA | K% | BB% | SS% | GB% | FB% | HC% |
|---|---|---|---|---|---|---|---|---|---|---|
| L30 Days | 5 | 93.0 | 4.65 | 3.64 | 22.0% | 11.4% | 9.3% | 40.0% | 41.3% | 39.5% |
| 2016 | 30 | 97.3 | 4.01 | 3.00 | 20.4% | 8.0% | 8.2% | 54.4% | 25.1% | 30.7% |
| 2015 | 11 | 131.7 | 4.43 | 3.22 | 16.1% | 11.6% | 7.0% | 60.6% | 21.6% | 21.0% |
Home (2015-16):—ERA: 3.32 — K%: 18.1% — wOBA Allowed: 0.291
Away (2015-16):—ERA: 2.85 — K%: 19.8% — wOBA Allowed: 0.277
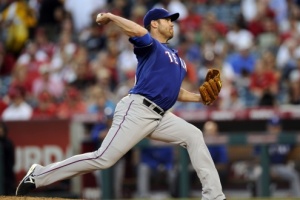
Sanchez was a lot better in the first half of the season, but he still finished the year with a 3.00 ERA and a strikeout rate of 20.4%. He is the largest favorite in the slate, but the total for the game is set at 9.0 runs. The Rangers need a win tonight or else they will be eliminated from the postseason, so we can expect their offense to show up here. Sanchez is my second favorite pitching target in the slate, but I have him quite a bit lower than Rich Hill.
Batter Grind Down
Texas
The Rangers’ offense forgot to show up in the first two games of the series, but need a big performance tonight in order to keep their postseason hopes alive. They draw a decent matchup against Aaron Sanchez, who allowed a .292 wOBA to left-handed hitters during the regular season.
- Rangers Offense (2016)
Team wOBA vs. RHP — 0.324 (11 of 30)
Team wOBA L30 Days — 0.322 (13 of 30)
Team ISO vs. RHP — 0.176 (8 of 30)
Team K% vs. RHP — 20.0% (7 of 30)
Pitches Per PA vs. RHP — 3.83 (23 of 30)
Runs Per Game — 4.72 (7 of 30)
Projected Run Total — 3.98 (4 of 6)
Projected Lineup
| # | Player | Bats | wOBA vs. RHP | ISO vs. RHP | HC% vs. RHP | wOBA L14 | FD Position | FD Salary | DK Position | DK Salary |
|---|---|---|---|---|---|---|---|---|---|---|
| 1 | Carlos Gomez | RIGHT | 0.304 | 0.172 | 30.0% | 0.426 | OF | $3,000 | OF | $3,000 |
| 2 | Ian Desmond | RIGHT | 0.326 | 0.160 | 30.5% | 0.256 | OF | $3,600 | OF | $3,300 |
| 3 | Carlos Beltran | SWITCH | 0.340 | 0.204 | 33.6% | 0.291 | OF | $3,700 | OF | $3,400 |
| 4 | Adrian Beltre | RIGHT | 0.357 | 0.207 | 33.9% | 0.466 | 3B | $3,200 | 3B | $3,600 |
| 5 | Rougned Odor | LEFT | 0.340 | 0.247 | 34.5% | 0.237 | 2B | $3,400 | 2B | $3,600 |
| 6 | Jonathan Lucroy | RIGHT | 0.371 | 0.195 | 33.1% | 0.297 | C | $3,300 | C | $3,500 |
| 7 | Mitch Moreland | LEFT | 0.299 | 0.186 | 36.5% | 0.095 | 1B | $2,800 | 1B | $2,800 |
| 8 | Elvis Andrus | RIGHT | 0.335 | 0.133 | 26.2% | 0.501 | SS | $2,800 | SS | $3,400 |
| 9 | Shin-Soo Choo | LEFT | 0.299 | 0.114 | 43.8% | 0.146 | OF | $3,500 | OF | $3,200 |
| Team Averages | — | 0.330 | 0.180 | 33.6% | 0.302 | — | — | — | — |
Elite Plays – Carlos Beltran, Rougned Odor
Secondary Plays – Carlos Gomez, Adrian Beltre, Jonathan Lucroy
Stackability – YELLOW
Toronto
The Blue Jays have the Rangers number and they have a chance to sweep the series with a win tonight at home. They come into this game with the highest implied team total in the slate, as they square off against the very hittable Colby Lewis. We can stack Toronto in all league formats.
- Blue Jays Offense (2016)
Team wOBA vs. RHP — 0.328 (7 of 30)
Team wOBA L30 Days — 0.310 (20 of 30)
Team ISO vs. RHP — 0.181 (6 of 30)
Team K% vs. RHP — 22.4% (24 of 30)
Pitches Per PA vs. RHP — 4.06 (1 of 30)
Runs Per Game — 4.69 (9 of 30)
Projected Run Total — 5.02 (1 of 6)
Projected Lineup
| # | Player | Bats | wOBA vs. RHP | ISO vs. RHP | HC% vs. RHP | wOBA L14 | FD Position | FD Salary | DK Position | DK Salary |
|---|---|---|---|---|---|---|---|---|---|---|
| 1 | Ezequiel Carrera | LEFT | 0.282 | 0.102 | 25.5% | 0.353 | OF | $2,700 | OF | $3,500 |
| 2 | Josh Donaldson | RIGHT | 0.405 | 0.272 | 41.0% | 0.395 | 3B | $3,900 | 3B | $5,400 |
| 3 | Edwin Encarnacion | RIGHT | 0.370 | 0.264 | 37.5% | 0.349 | 1B | $4,100 | 1B | $4,500 |
| 4 | Jose Bautista | RIGHT | 0.361 | 0.220 | 41.0% | 0.443 | OF | $3,500 | OF | $5,100 |
| 5 | Russell Martin | RIGHT | 0.325 | 0.173 | 29.9% | 0.283 | C | $2,800 | C | $3,400 |
| 6 | Troy Tulowitzki | RIGHT | 0.326 | 0.196 | 34.5% | 0.290 | SS | $2,900 | SS | $4,600 |
| 7 | Michael Saunders | LEFT | 0.335 | 0.205 | 38.6% | 0.270 | OF | $2,600 | OF | $3,700 |
| 8 | Kevin Pillar | RIGHT | 0.291 | 0.104 | 25.4% | 0.326 | OF | $2,400 | OF | $3,300 |
| 9 | Darwin Barney | RIGHT | 0.284 | 0.099 | 25.8% | 0.314 | 2B | $2,000 | 2B/3B | $2,900 |
| Team Averages | — | 0.331 | 0.182 | 33.2% | 0.336 | — | — | — | — |