MLB Grind Down: Monday, August 29th - Page Three
Jump to Page 1 2 3
NY Yankees at Kansas City – 8:15 PM ET
| NY Yankees | Kansas City |
 | |  | |
| RIGHT | RIGHT |
| Vegas Moneyline | Vegas Over/Under |
| NYY -124 | 8.5 |
| Stats | wOBA | HR All. | HC% | K% | Stats | wOBA | HR All. | HC% | K% |
| SP vs. Left (2015-16) | 0.330 | 17 | 31.4% | 24.9% | SP vs. Left (2015-16) | 0.385 | 11 | 33.5% | 14.8% |
| SP vs. Right (2015-16) | 0.329 | 26 | 31.4% | 24.6% | SP vs. Right (2015-16) | 0.327 | 13 | 28.3% | 19.0% |
Pitcher Grind Down
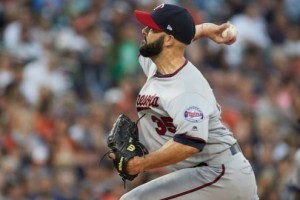
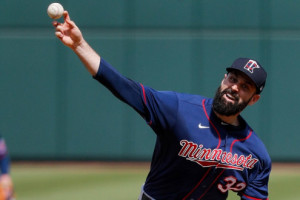
| Michael Pineda |
 | FanDuel | DraftKings |
| Salary: | $8,500 | Salary: | $7,100 |
| FPPG: | 29.6 | FPPG: | 15.5 |
| Pitcher Rating: | 77.6 | Pitcher Rank: | 3 |
| Statistics | Starts | PitchPS | SIERA | ERA | K% | BB% | SS% | GB% | FB% | HC% |
| L30 Days | 5 | 86.0 | 4.00 | 5.08 | 21.0% | 7.6% | 12.8% | 53.6% | 29.8% | 35.7% |
| 2016 | 25 | 95.5 | 3.47 | 5.02 | 26.3% | 6.6% | 13.9% | 46.0% | 32.6% | 32.9% |
| 2015 | 27 | 94.4 | 3.09 | 4.37 | 23.4% | 3.1% | 11.9% | 48.2% | 29.9% | 30.1% |
Pineda has been a money pit this season. His numbers continue to suggest that the results will eventually come, but he continues to give up a lot of runs. He has a full 1.5 run difference between his SIERA and his ERA on the year. I’m close to jumping ship, but will give him one last shot tonight against the Royals. He sees a massive ballpark boost here and he gets to face one of the worst offenses in all of baseball. On the season, Kansas City is ranked 27th in team wOBA and 30th in team K% against right-handed pitching. They also average very few pitches per plate appearance. This could finally be the time when Pineda awaits the patience of those who have been targeting him all season.
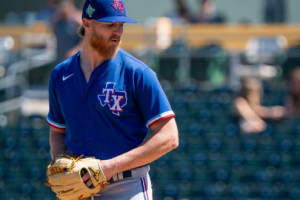
| Dillon Gee |
 | FanDuel | DraftKings |
| Salary: | $5,800 | Salary: | $4,200 |
| FPPG: | 17.2 | FPPG: | 8.2 |
| Pitcher Rating: | 46.9 | Pitcher Rank: | 22 |
| Statistics | Starts | PitchPS | SIERA | ERA | K% | BB% | SS% | GB% | FB% | HC% |
| L30 Days | 5 | 92.6 | 4.15 | 4.55 | 19.2% | 5.4% | 9.9% | 46.3% | 37.9% | 30.9% |
| 2016 | 11 | 90.7 | 4.32 | 4.55 | 18.3% | 6.9% | 9.4% | 43.2% | 36.9% | 29.7% |
| 2015 | 7 | 88.0 | 4.41 | 5.90 | 13.7% | 6.0% | 9.4% | 51.0% | 29.4% | 33.6% |
Gee has not pitched well this season, posting a 4.56 ERA with a strikeout rate of 18.3% in 11 starts. He doesn’t do anything particularly well and opposing offenses have had quite a bit of success against him. The Yankees have been one of the best offenses in baseball over the last month of play, ranking fifth in team wOBA. There is more risk than potential reward for Gee tonight.
Batter Grind Down
NY Yankees
The Yankees’ offense has been on fire lately, largely in part thanks to aka Barry Sanchez aka GOAT Sanchez, aka Way Better than Butt-Fumble Sanchez. He currently has a .623 wOBA against right-handed pitching with a 44.4% hard contact rate this season. The hot streak will inevitably come to an end, but why not ride it while we still can. He remains an elite play in all league formats, even at his chalky ownership levels.
- Yankees Offense (2016)
Team wOBA vs. RHP — 0.313 (18 of 30)
Team wOBA L30 Days — 0.341 (5 of 30)
Team ISO vs. RHP — 0.161 (17 of 30)
Team K% vs. RHP — 19.8% (9 of 30)
Pitches Per PA vs. RHP — 3.82 (23 of 30)
Runs Per Game — 4.31 (21 of 30)
Projected Run Total — 4.39 (13 of 26)
Projected Lineup
| # | Player | Bats | wOBA vs. RHP | ISO vs. RHP | HC% vs. RHP | wOBA L14 | FD Position | FD Salary | DK Position | DK Salary |
| 1 | | LEFT | 0.324 | 0.136 | 27.2% | 0.222 | OF | $3,200 | OF | $4,000 |
| 2 | | LEFT | 0.308 | 0.106 | 24.8% | 0.273 | OF | $3,000 | OF | $4,300 |
| 3 | | RIGHT | 0.623 | 0.569 | 44.4% | 0.724 | C | $4,000 | C | $4,700 |
| 4 | | SWITCH | 0.343 | 0.259 | 35.9% | 0.304 | 1B | $3,000 | 1B | $3,500 |
| 5 | | LEFT | 0.312 | 0.149 | 24.5% | 0.305 | SS | $3,200 | SS | $3,900 |
| 6 | | RIGHT | 0.298 | 0.138 | 26.1% | 0.396 | 2B | $3,100 | 2B | $4,400 |
| 7 | | LEFT | 0.327 | 0.196 | 33.5% | 0.383 | C | $3,200 | C | $4,100 |
| 8 | | RIGHT | 0.355 | 0.242 | 47.6% | 0.283 | OF | $3,000 | OF | $3,700 |
| 9 | | RIGHT | 0.358 | 0.185 | 15.1% | 0.532 | 2B | $2,700 | 3B/SS | $3,000 |
| | Team Averages | — | 0.361 | 0.220 | 31.0% | 0.380 | — | — | — | — |
Elite Plays –
Secondary Plays – , ,
Stackability – YELLOW
Kansas City
The Royals have been one of the worst offenses in baseball against right-handed pitching this season, ranking in the bottom five in both team wOBA and team ISO. They draw a difficult matchup tonight against , whose advanced stats suggest that he is a much better pitcher than his ERA does. I’m not a big fan of the Royals tonight and I will be avoiding them in all league formats.
- Royals Offense (2016)
Team wOBA vs. RHP — 0.300 (27 of 30)
Team wOBA L30 Days — 0.297 (26 of 30)
Team ISO vs. RHP — 0.128 (30 of 30)
Team K% vs. RHP — 20.4% (11 of 30)
Pitches Per PA vs. RHP — 3.77 (27 of 30)
Runs Per Game — 3.95 (27 of 30)
Projected Run Total — 4.11 (16 of 26)
Projected Lineup
| # | Player | Bats | wOBA vs. RHP | ISO vs. RHP | HC% vs. RHP | wOBA L14 | FD Position | FD Salary | DK Position | DK Salary |
| 1 | | RIGHT | 0.302 | 0.127 | 31.0% | 0.233 | OF | $2,900 | OF | $3,500 |
| 2 | | RIGHT | 0.308 | 0.145 | 29.9% | 0.275 | 3B | $3,100 | 3B | $3,300 |
| 3 | | RIGHT | 0.317 | 0.117 | 30.2% | 0.444 | OF | $3,000 | OF | $3,800 |
| 4 | | LEFT | 0.365 | 0.179 | 35.3% | 0.351 | 1B | $3,100 | 1B | $4,000 |
| 5 | | SWITCH | 0.347 | 0.212 | 39.9% | 0.286 | 1B | $2,700 | 1B/OF | $3,000 |
| 6 | | RIGHT | 0.321 | 0.190 | 29.7% | 0.306 | C | $3,000 | C | $3,800 |
| 7 | | LEFT | 0.329 | 0.168 | 35.5% | 0.488 | OF | $2,800 | OF | $4,200 |
| 8 | | RIGHT | 0.275 | 0.067 | 20.8% | 0.427 | SS | $2,200 | SS | $3,700 |
| 9 | | SWITCH | 0.210 | 0.098 | 31.0% | 0.257 | 2B | $2,500 | 2B | $2,600 |
| | Team Averages | — | 0.308 | 0.145 | 31.5% | 0.341 | — | — | — | — |
Elite Plays – NONE
Secondary Plays – NONE
Stackability – RED
LA Dodgers at Colorado – 8:40 PM ET
| LA Dodgers | Colorado |
 | |  | |
| RIGHT | RIGHT |
| Vegas Moneyline | Vegas Over/Under |
| LAD -122 | 11.0 |
| Stats | wOBA | HR All. | HC% | K% | Stats | wOBA | HR All. | HC% | K% |
| SP vs. Left (2015-16) | 0.303 | 9 | 33.5% | 19.5% | SP vs. Left (2015-16) | 0.314 | 8 | 35.9% | 24.8% |
| SP vs. Right (2015-16) | 0.258 | 8 | 25.3% | 29.6% | SP vs. Right (2015-16) | 0.327 | 11 | 28.6% | 24.2% |
Pitcher Grind Down
| Kenta Maeda |
 | FanDuel | DraftKings |
| Salary: | $7,500 | Salary: | $6,500 |
| FPPG: | 30.3 | FPPG: | 16.1 |
| Pitcher Rating: | 51.2 | Pitcher Rank: | 18 |
| Statistics | Starts | PitchPS | SIERA | ERA | K% | BB% | SS% | GB% | FB% | HC% |
| L30 Days | 5 | 97.8 | 3.81 | 3.86 | 23.9% | 6.2% | 11.5% | 39.0% | 41.6% | 28.6% |
| 2016 | 25 | 93.5 | 3.72 | 3.37 | 24.9% | 6.8% | 11.6% | 43.3% | 37.7% | 29.2% |
Maeda would be one of my favorite pitchers in the slate if this game were being played in Los Angeles. Alas, that is not the case. He has to pitch in the hitter’s paradise that is Coors Field. Even though he is a small favorite here, the over/under for the game is set at 11.0 runs. His high fly-ball rate concerns me in this ballpark. There are better pitching options to target tonight.
| Jon Gray |
 | FanDuel | DraftKings |
| Salary: | $7,400 | Salary: | $6,800 |
| FPPG: | 31.0 | FPPG: | 16.3 |
| Pitcher Rating: | 47.0 | Pitcher Rank: | 21 |
| Statistics | Starts | PitchPS | SIERA | ERA | K% | BB% | SS% | GB% | FB% | HC% |
| L30 Days | 5 | 98.0 | 4.03 | 7.83 | 25.7% | 10.1% | 10.6% | 37.7% | 33.3% | 31.4% |
| 2016 | 23 | 95.7 | 3.76 | 4.61 | 25.5% | 8.2% | 11.8% | 44.6% | 31.8% | 30.5% |
| 2015 | 9 | 75.8 | 3.89 | 5.53 | 21.6% | 7.6% | 10.1% | 42.4% | 32.8% | 36.4% |
Gray is coming off of a strong outing against the Brewers in Milwaukee, but now he has to face a red-hot Dodgers’ offense in Coors Field. Over the last month of play, only the Rockies have a higher team wOBA than the Dodgers. This is expected to be the highest scoring game of the night, which makes both pitchers easy fades in both cash games and tournaments.
Batter Grind Down
LA Dodgers
Even though I have the Tigers ranked ahead of the Dodgers, Los Angeles has the highest run projection in the slate. They are one of the best offenses in baseball against right-handed pitching and they get to play in Coors Field. has done a great job of limiting hard contact this season, but Coors is the ultimate trump card. You can load up on Dodgers in all league formats.
- Dodgers Offense (2016)
Team wOBA vs. RHP — 0.327 (9 of 30)
Team wOBA L30 Days — 0.345 (2 of 30)
Team ISO vs. RHP — 0.176 (8 of 30)
Team K% vs. RHP — 21.0% (17 of 30)
Pitches Per PA vs. RHP — 3.82 (25 of 30)
Runs Per Game — 4.53 (17 of 30)
Projected Run Total — 5.63 (1 of 26)
Projected Lineup
| # | Player | Bats | wOBA vs. RHP | ISO vs. RHP | HC% vs. RHP | wOBA L14 | FD Position | FD Salary | DK Position | DK Salary |
| 1 | | LEFT | 0.310 | 0.142 | 37.0% | 0.345 | 2B | $3,700 | 2B | $4,600 |
| 2 | | LEFT | 0.409 | 0.234 | 39.9% | 0.483 | SS | $4,400 | SS | $5,500 |
| 3 | | RIGHT | 0.387 | 0.238 | 36.3% | 0.356 | 3B | $3,900 | 3B | $5,100 |
| 4 | | LEFT | 0.364 | 0.213 | 36.2% | 0.422 | 1B | $3,600 | 1B | $4,800 |
| 5 | | SWITCH | 0.340 | 0.224 | 34.8% | 0.336 | C | $3,600 | C | $4,600 |
| 6 | | LEFT | 0.353 | 0.179 | 26.9% | 0.183 | OF | $3,500 | OF | $4,000 |
| 7 | | LEFT | 0.357 | 0.233 | 39.0% | 0.272 | OF | $3,500 | OF | $4,400 |
| 8 | | RIGHT | 0.327 | 0.133 | 32.1% | 0.321 | 2B | $3,300 | 2B/OF | $3,800 |
| 9 | | RIGHT | 0.163 | 0.118 | 6.7% | 0.000 | P | $7,500 | P | $6,500 |
| | Team Averages | — | 0.334 | 0.190 | 32.1% | 0.302 | — | — | — | — |
Elite Plays – ,
Secondary Plays – , , , ,
Stackability – GREEN
Colorado
The Rockies draw a difficult matchup on paper, but they are still one of the top offenses to target in this slate. They have been red-hot at the plate (.355 team wOBA over the last month of play) and they are playing at home in Coors Field. has been tough on hitters from both sides of the plate, but he has allowed a 33.5% hard contact rate to lefties this season.
- Rockies Offense (2016)
Team wOBA vs. RHP — 0.340 (3 of 30)
Team wOBA L30 Days — 0.355 (1 of 30)
Team ISO vs. RHP — 0.187 (5 of 30)
Team K% vs. RHP — 20.6% (13 of 30)
Pitches Per PA vs. RHP — 3.90 (10 of 30)
Runs Per Game — 5.28 (2 of 30)
Projected Run Total — 5.37 (3 of 26)
Projected Lineup
| # | Player | Bats | wOBA vs. RHP | ISO vs. RHP | HC% vs. RHP | wOBA L14 | FD Position | FD Salary | DK Position | DK Salary |
| 1 | | LEFT | 0.372 | 0.214 | 36.0% | 0.452 | OF | $4,200 | OF | $5,500 |
| 2 | | RIGHT | 0.352 | 0.119 | 29.9% | 0.567 | 2B | $3,900 | 2B | $5,200 |
| 3 | | LEFT | 0.404 | 0.284 | 35.5% | 0.208 | OF | $3,900 | OF | $5,100 |
| 4 | | RIGHT | 0.386 | 0.303 | 36.3% | 0.398 | 3B | $4,100 | 3B | $5,400 |
| 5 | | LEFT | 0.394 | 0.235 | 36.2% | 0.359 | OF | $3,900 | OF | $4,800 |
| 6 | | LEFT | 0.321 | 0.162 | 32.1% | 0.272 | OF | $3,200 | OF | $3,100 |
| 7 | | RIGHT | 0.331 | 0.167 | 30.4% | 0.372 | C | $3,000 | C | $3,700 |
| 8 | | LEFT | 0.304 | 0.127 | 24.8% | 0.236 | SS | $3,000 | 1B/SS | $3,200 |
| 9 | | RIGHT | 0.212 | 0.057 | 33.3% | 0.634 | P | $7,400 | P | $6,800 |
| | Team Averages | — | 0.342 | 0.185 | 32.7% | 0.389 | — | — | — | — |
Elite Plays – , ,
Secondary Plays – ,
Stackability – GREEN
Cincinnati at LA Angels – 10:05 PM ET
| Cincinnati | LA Angels |
 | |  | |
| RIGHT | RIGHT |
| Vegas Moneyline | Vegas Over/Under |
| LAA -148 | 8.0 |
| Stats | wOBA | HR All. | HC% | K% | Stats | wOBA | HR All. | HC% | K% |
| SP vs. Left (2015-16) | 0.305 | 10 | 29.3% | 16.4% | SP vs. Left (2015-16) | 0.304 | 18 | 32.0% | 18.9% |
| SP vs. Right (2015-16) | 0.279 | 12 | 33.6% | 23.3% | SP vs. Right (2015-16) | 0.334 | 23 | 29.1% | 22.9% |
Pitcher Grind Down
| Dan Straily |
 | FanDuel | DraftKings |
| Salary: | $7,300 | Salary: | $9,100 |
| FPPG: | 28.3 | FPPG: | 14.8 |
| Pitcher Rating: | 53.8 | Pitcher Rank: | 15 |
| Statistics | Starts | PitchPS | SIERA | ERA | K% | BB% | SS% | GB% | FB% | HC% |
| L30 Days | 5 | 91.2 | 3.84 | 2.45 | 22.4% | 2.6% | 11.0% | 31.0% | 49.4% | 31.0% |
| 2016 | 24 | 101.1 | 4.63 | 3.57 | 20.0% | 8.6% | 9.8% | 32.8% | 46.2% | 31.9% |
| 2015 | 3 | 97.0 | 4.67 | 5.40 | 18.4% | 10.5% | 9.6% | 41.5% | 37.7% | 28.3% |
Straily has been in solid form over the last month of play, posting a 2.45 ERA (3.84 SIERA) with a strikeout rate of 22.4%. While I haven’t been targeting him during this stretch, I have been limiting my exposure to the offenses that he has been facing. He comes into tonight’s game as a sizable underdog against the Angels, who are the toughest team to strikeout in the majors. Straily is an easy fade tonight, especially at this inflated price point.
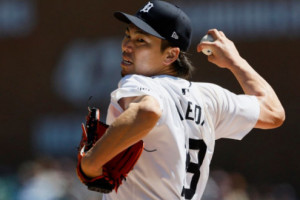
| Matt Shoemaker |
 | FanDuel | DraftKings |
| Salary: | $8,700 | Salary: | $7,200 |
| FPPG: | 30.1 | FPPG: | 15.8 |
| Pitcher Rating: | 60.9 | Pitcher Rank: | 10 |
| Statistics | Starts | PitchPS | SIERA | ERA | K% | BB% | SS% | GB% | FB% | HC% |
| L30 Days | 5 | 97.2 | 4.80 | 3.27 | 13.4% | 4.5% | 10.5% | 42.3% | 34.6% | 29.3% |
| 2016 | 25 | 94.3 | 3.95 | 3.98 | 21.1% | 4.7% | 12.9% | 38.8% | 37.4% | 30.5% |
| 2015 | 24 | 87.0 | 3.98 | 4.46 | 20.4% | 6.2% | 9.1% | 39.2% | 42.4% | 30.9% |
Shoemaker’s strikeouts have disappeared over the last couple of months. At one point, his strikeout rate was up over 30% on the season. It’s not down to 21.1%, thanks to a 13.4% k-rate over his last five starts. I have a soft spot in my heart for Shoemaker, but have a hard time justifying the play tonight. The Reds have been making good contact lately and there are pitchers that provide more upside.
Batter Grind Down
Cincinnati
The Reds have one of the lowest implied team totals on the board tonight. While I won’t be heavily targeting this offense, I do like as a one-off target. He has been hitting the ball extremely hard in the last couple of weeks and has allowed a .334 wOBA and 23 home runs to right-handed hitters in the last two seasons.
- Reds Offense (2016)
Team wOBA vs. RHP — 0.312 (19 of 30)
Team wOBA L30 Days — 0.333 (10 of 30)
Team ISO vs. RHP — 0.158 (19 of 30)
Team K% vs. RHP — 21.1% (18 of 30)
Pitches Per PA vs. RHP — 3.81 (26 of 30)
Runs Per Game — 4.54 (15 of 30)
Projected Run Total — 3.72 (24 of 26)
Projected Lineup
| # | Player | Bats | wOBA vs. RHP | ISO vs. RHP | HC% vs. RHP | wOBA L14 | FD Position | FD Salary | DK Position | DK Salary |
| 1 | | SWITCH | 0.275 | 0.061 | 19.3% | 0.313 | OF | $3,000 | OF | $3,700 |
| 2 | | RIGHT | 0.324 | 0.178 | 29.6% | 0.432 | SS | $3,000 | SS | $3,300 |
| 3 | | LEFT | 0.423 | 0.241 | 43.3% | 0.480 | 1B | $4,000 | 1B | $4,900 |
| 4 | | RIGHT | 0.352 | 0.298 | 37.3% | 0.351 | OF | $3,400 | OF | $4,300 |
| 5 | | RIGHT | 0.317 | 0.113 | 26.9% | 0.322 | 2B | $2,600 | 2B | $3,100 |
| 6 | | LEFT | 0.310 | 0.201 | 37.5% | 0.409 | OF | $3,200 | OF | $2,900 |
| 7 | | RIGHT | 0.310 | 0.155 | 32.6% | 0.415 | 3B | $3,200 | 3B | $3,200 |
| 8 | | SWITCH | 0.258 | 0.101 | 21.8% | 0.185 | C | $2,200 | C | $2,300 |
| 9 | | RIGHT | 0.281 | 0.043 | 21.3% | 0.468 | SS | $2,600 | OF/SS | $3,600 |
| | Team Averages | — | 0.317 | 0.155 | 30.0% | 0.375 | — | — | — | — |
Elite Plays – NONE
Secondary Plays – ,
Stackability – ORANGE
LA Angels
The Angels have really struggled against right-handed pitching this season and comes into the game in great form. An Angels’ stack is certainly out of the equation for me, but I do like and . Trout is a beast and Pujols has been hitting the ball very hard in the last two weeks. Add in the fact that Straily has allowed a 33.6% hard contact rate to righties and they become intriguing plays tonight.
- Angels Offense (2016)
Team wOBA vs. RHP — 0.312 (19 of 30)
Team wOBA L30 Days — 0.291 (29 of 30)
Team ISO vs. RHP — 0.139 (26 of 30)
Team K% vs. RHP — 15.9% (1 of 30)
Pitches Per PA vs. RHP — 3.70 (30 of 30)
Runs Per Game — 4.43 (19 of 30)
Projected Run Total — 4.28 (14 of 26)
Projected Lineup
| # | Player | Bats | wOBA vs. RHP | ISO vs. RHP | HC% vs. RHP | wOBA L14 | FD Position | FD Salary | DK Position | DK Salary |
| 1 | | LEFT | 0.325 | 0.158 | 32.0% | 0.288 | OF | $3,300 | OF | $3,300 |
| 2 | | RIGHT | 0.417 | 0.278 | 41.2% | 0.444 | OF | $4,200 | OF | $4,900 |
| 3 | | RIGHT | 0.326 | 0.202 | 34.8% | 0.370 | 1B | $3,600 | 1B | $3,600 |
| 4 | | RIGHT | 0.334 | 0.190 | 30.5% | 0.205 | 1B | $2,900 | 1B | $3,100 |
| 5 | | RIGHT | 0.292 | 0.068 | 24.3% | 0.246 | SS | $2,200 | SS | $2,100 |
| 6 | | RIGHT | 0.282 | 0.156 | 32.3% | 0.244 | 3B | $2,600 | 1B/3B | $2,800 |
| 7 | | RIGHT | 0.308 | 0.164 | 27.9% | 0.329 | C | $2,500 | C | $2,700 |
| 8 | | RIGHT | 0.332 | 0.225 | 28.1% | 0.284 | OF | $2,200 | OF | $2,200 |
| 9 | | SWITCH | 0.301 | 0.180 | 28.1% | 0.395 | 3B | $2,500 | 3B | $2,300 |
| | Team Averages | — | 0.324 | 0.180 | 31.0% | 0.312 | — | — | — | — |
Elite Plays –
Secondary Plays –
Stackability – ORANGE
Jump to Page 1 2 3
