MLB Grind Down: Monday, August 29th
Jump to Page 1 2 3
The RotoGrinders MLB Grind Down will give you an in-depth analysis into the upcoming MLB schedule. This article will break down the numbers for every single game and give you analysis on which trends you can exploit. While matchups are a major factor in daily fantasy baseball, there are plenty of other factors to consider such as injuries, weather, and salaries.
The analysis should point you in the right direction, but it is still up to you to decipher the information and make your own selections. No sport has more variance than baseball. The best choice is not always the right choice but following the trends will win you money over time.
Note: As always, if you want to try a new DFS site, be sure to click through a RotoGrinders link and use our DraftKings promo code and FanDuel promo code to receive the best perks in the industry.
Stackability Rating System:
GREEN – One of the top stacks of the day, viable in cash games and GPPs
YELLOW – A viable stack option in most formats, specifically GPPs
ORANGE – There are better stacks out there, but playable in large GPPs
RED – Not a recommended stack for cash games or GPPs
Toronto at Baltimore – 7:05 PM ET
| Toronto | Baltimore |
 | |  | |
| RIGHT | LEFT |
| Vegas Moneyline | Vegas Over/Under |
| TOR -133 | 10.0 |
| Stats | wOBA | HR All. | HC% | K% | Stats | wOBA | HR All. | HC% | K% |
| SP vs. Left (2015-16) | 0.275 | 24 | 28.3% | 19.6% | SP vs. Left (2015-16) | 0.297 | 6 | 27.6% | 18.9% |
| SP vs. Right (2015-16) | 0.283 | 20 | 31.6% | 20.6% | SP vs. Right (2015-16) | 0.346 | 33 | 28.0% | 17.3% |
Pitcher Grind Down
| Marco Estrada |
 | FanDuel | DraftKings |
| Salary: | $7,900 | Salary: | $6,600 |
| FPPG: | 32.6 | FPPG: | 17.8 |
| Pitcher Rating: | 51.3 | Pitcher Rank: | 17 |
| Statistics | Starts | PitchPS | SIERA | ERA | K% | BB% | SS% | GB% | FB% | HC% |
| L30 Days | 5 | 92.6 | 4.32 | 5.67 | 20.5% | 7.4% | 11.7% | 40.7% | 40.7% | 35.6% |
| 2016 | 22 | 98.7 | 4.31 | 3.47 | 22.6% | 8.7% | 10.8% | 35.4% | 46.5% | 33.3% |
| 2015 | 28 | 104.0 | 4.64 | 3.13 | 18.1% | 7.6% | 9.9% | 32.2% | 52.3% | 27.4% |
I’ve been hinting that regression could be looming for Estrada all season and we are finally start to see it come to fruition. In his last five starts, he has a 5.67 ERA with a strikeout rate of 20.5%. It’s always a red flag for me when a pitcher has such a big discrepancy between his ERA and his ERA estimators and it generally leads to an inflated price tag as well. Tonight he squares off against the Orioles in Camden Yards. While Estrada does have a nice track record against Baltimore, they hit too many home runs for me to give him a serious look. This game has one of the highest over/unders in the slate.
| Wade Miley |
 | FanDuel | DraftKings |
| Salary: | $6,200 | Salary: | $4,600 |
| FPPG: | 23.1 | FPPG: | 10.8 |
| Pitcher Rating: | 49.4 | Pitcher Rank: | 20 |
| Statistics | Starts | PitchPS | SIERA | ERA | K% | BB% | SS% | GB% | FB% | HC% |
| L30 Days | 6 | 84.3 | 3.68 | 6.52 | 21.5% | 5.4% | 8.7% | 50.0% | 25.6% | 34.4% |
| 2016 | 24 | 91.2 | 4.46 | 5.51 | 17.5% | 6.9% | 8.7% | 46.8% | 31.6% | 32.6% |
| 2015 | 32 | 99.8 | 4.24 | 4.46 | 17.7% | 7.7% | 8.3% | 48.8% | 30.5% | 24.7% |
Miley is always one of our favorite pitchers to pick on. In 24 starts this season, he has a 5.51 ERA (4.46 SIERA) with a strikeout rate of only 17.5%. He gives up a lot of hard contact and he is pitching in a park built for right-handed power hitters. He is a small underdog tonight against the Blue Jays, who are ranked fifth in team wOBA and sixth in team ISO against southpaws this season. There are a million reasons why you shouldn’t play Miley tonight.
Batter Grind Down
Toronto
The Blue Jays’ offense is one of the best in baseball against left-handed pitching and that’s after a very slow start to the season. They come into tonight’s game with one of the highest run projections in the slate. They draw a favorable matchup against , who has allowed a .346 wOBA and 33 home runs to right-handed hitters in the last two seasons combined. The Blue Jays would typically be the chalk in this situation, but with so many great offenses to target tonight, ownership should be evenly spread out when it comes to stacks.
- Blue Jays Offense (2016)
Team wOBA vs. LHP — 0.335 (5 of 30)
Team wOBA L30 Days — 0.325 (14 of 30)
Team ISO vs. LHP — 0.178 (6 of 30)
Team K% vs. LHP — 19.5% (7 of 30)
Pitches Per PA vs. LHP — 3.87 (14 of 30)
Runs Per Game — 4.89 (6 of 30)
Projected Run Total — 5.19 (4 of 26)
Projected Lineup
| # | Player | Bats | wOBA vs. LHP | ISO vs. LHP | HC% vs. LHP | wOBA L14 | FD Position | FD Salary | DK Position | DK Salary |
| 1 | | RIGHT | 0.348 | 0.215 | 36.1% | 0.316 | OF | $3,700 | OF | $4,800 |
| 2 | | RIGHT | 0.426 | 0.295 | 40.7% | 0.371 | 3B | $4,400 | 3B | $5,200 |
| 3 | | RIGHT | 0.368 | 0.254 | 38.3% | 0.422 | 1B | $4,200 | 1B | $5,000 |
| 4 | | RIGHT | 0.365 | 0.197 | 37.3% | 0.553 | C | $3,400 | C | $4,500 |
| 5 | | RIGHT | 0.370 | 0.188 | 40.8% | 0.380 | SS | $3,200 | SS | $4,200 |
| 6 | | LEFT | 0.409 | 0.308 | 31.9% | 0.290 | OF | $3,300 | OF | $4,600 |
| 7 | | RIGHT | 0.371 | 0.235 | 31.9% | 0.391 | OF | $3,400 | OF | $4,600 |
| 8 | | RIGHT | 0.312 | 0.109 | 29.3% | 0.265 | OF | $2,900 | OF | $3,800 |
| 9 | | RIGHT | 0.330 | 0.165 | 27.7% | 0.285 | 2B | $3,500 | 2B | $4,500 |
| | Team Averages | — | 0.367 | 0.218 | 34.9% | 0.364 | — | — | — | — |
Elite Plays – , , , ,
Secondary Plays –
Stackability – GREEN
Baltimore
The Orioles haven’t been great at the plate recently, but they do have the highest ISO of any ball club against right-handed pitching this season. That bodes well for their matchup tonight against , who is an extreme fly-ball pitcher. The one concern here is that the Orioles haven’t fared well against Estrada in the past, but they do have nine home runs off of him in 154 at bats. I’m not as high on the Orioles as I am the Blue Jays, but I’m certainly not going to talk you off of them tonight at home.
- Orioles Offense (2016)
Team wOBA vs. RHP — 0.341 (2 of 30)
Team wOBA L30 Days — 0.322 (17 of 30)
Team ISO vs. RHP — 0.203 (1 of 30)
Team K% vs. RHP — 21.8% (21 of 30)
Pitches Per PA vs. RHP — 3.84 (20 of 30)
Runs Per Game — 4.73 (8 of 30)
Projected Run Total — 4.81 (8 of 26)
Projected Lineup
| # | Player | Bats | wOBA vs. RHP | ISO vs. RHP | HC% vs. RHP | wOBA L14 | FD Position | FD Salary | DK Position | DK Salary |
| 1 | | RIGHT | 0.346 | 0.208 | 31.7% | 0.272 | OF | $3,500 | OF | $4,500 |
| 2 | Hyun-Soo Kim | LEFT | 0.382 | 0.123 | 31.6% | 0.379 | OF | $3,200 | OF | $3,900 |
| 3 | | RIGHT | 0.385 | 0.253 | 35.1% | 0.402 | 3B | $4,100 | 3B/SS | $5,000 |
| 4 | | RIGHT | 0.350 | 0.228 | 34.7% | 0.434 | OF | $3,600 | OF | $4,900 |
| 5 | | LEFT | 0.386 | 0.316 | 43.5% | 0.480 | 1B | $3,700 | 1B | $4,700 |
| 6 | | RIGHT | 0.354 | 0.220 | 32.5% | 0.325 | 2B | $3,200 | 2B | $4,200 |
| 7 | | LEFT | 0.347 | 0.252 | 39.0% | 0.325 | 3B | $3,300 | 1B | $3,800 |
| 8 | | SWITCH | 0.316 | 0.161 | 31.3% | 0.373 | C | $2,900 | C | $4,000 |
| 9 | | RIGHT | 0.277 | 0.121 | 28.4% | 0.257 | SS | $2,500 | SS | $3,100 |
| | Team Averages | — | 0.349 | 0.209 | 34.2% | 0.361 | — | — | — | — |
Elite Plays –
Secondary Plays – , ,
Stackability – YELLOW
Washington at Philadelphia – 7:05 PM ET
| Washington | Philadelphia |
 | |  | |
| RIGHT | RIGHT |
| Vegas Moneyline | Vegas Over/Under |
| WAS -200 | 9.0 |
| Stats | wOBA | HR All. | HC% | K% | Stats | wOBA | HR All. | HC% | K% |
| SP vs. Left (2015-16) | 0.315 | 15 | 31.3% | 16.6% | SP vs. Left (2015-16) | 0.426 | 3 | 39.5% | 12.5% |
| SP vs. Right (2015-16) | 0.299 | 16 | 20.2% | 18.7% | SP vs. Right (2015-16) | 0.389 | 2 | 42.9% | 16.2% |
Pitcher Grind Down
| Tanner Roark |
 | FanDuel | DraftKings |
| Salary: | $8,500 | Salary: | $8,600 |
| FPPG: | 33.1 | FPPG: | 17.0 |
| Pitcher Rating: | 65.5 | Pitcher Rank: | 7 |
| Statistics | Starts | PitchPS | SIERA | ERA | K% | BB% | SS% | GB% | FB% | HC% |
| L30 Days | 5 | 104.2 | 5.16 | 3.13 | 15.7% | 9.7% | 6.7% | 43.8% | 37.5% | 30.2% |
| 2016 | 26 | 103.3 | 4.29 | 2.99 | 19.5% | 7.9% | 8.4% | 49.4% | 30.5% | 24.7% |
| 2015 | 12 | 150.0 | 4.16 | 4.38 | 15.0% | 5.6% | 7.1% | 47.8% | 30.6% | 26.3% |
Roark is another pitcher that I have been avoiding due to potential regression. His ERA is nearly a run and a half lower than his SIERA this season, which is a red flag. He comes into the game in bad form, posting a 5.16 SIERA with a strikeout rate of only 15.7% in his last five starts. He is overpriced given his recent dip in strikeouts and yet, people are still going to be targeting him tonight against the Phillies. I’m on team ‘Fade Roark,’ even though he is one of the largest favorites in the slate.
| Jake Thompson |
 | FanDuel | DraftKings |
| Salary: | $5,500 | Salary: | $4,000 |
| FPPG: | 11.5 | FPPG: | 2.5 |
| Pitcher Rating: | 31.8 | Pitcher Rank: | 26 |
| Statistics | Starts | PitchPS | SIERA | ERA | K% | BB% | SS% | GB% | FB% | HC% |
| L30 Days | 4 | 91.3 | 5.92 | 9.78 | 14.0% | 14.0% | 7.7% | 47.6% | 34.9% | 40.9% |
| 2016 | 4 | 91.3 | 5.92 | 9.78 | 14.0% | 14.0% | 7.7% | 47.6% | 34.9% | 40.9% |
Thompson didn’t show a lot of strikeout potential in the minors and so far that hasn’t changed in the majors. In his first four career starts, he has a 9.78 ERA (5.92 SIERA) with a strikeout rate of 14% and a walk rate of 14%. He has been a great pitcher to stack against, allowing a hard contact rate of 40.9%. He comes into tonight’s contest as one of the largest underdogs in the slate. Until he flashes some better form at this level, Thompson should be avoided in all league formats.
Batter Grind Down
Washington
The Nationals’ offense was a disappointment over the weekend, but they should bounce back nicely tonight against and the Phillies. The sample size is small (four starts), but Thompson has allowed a lot of hard contact to hitters from both sides of the plate. He has also given up five home runs, three to left-handed hitters and two to right-handed hitters. You can stack the Nationals in both cash games and tournaments tonight.
- Nationals Offense (2016)
Team wOBA vs. RHP — 0.322 (11 of 30)
Team wOBA L30 Days — 0.342 (4 of 30)
Team ISO vs. RHP — 0.170 (12 of 30)
Team K% vs. RHP — 19.3% (6 of 30)
Pitches Per PA vs. RHP — 3.88 (12 of 30)
Runs Per Game — 4.87 (7 of 30)
Projected Run Total — 5.08 (5 of 26)
Projected Lineup
| # | Player | Bats | wOBA vs. RHP | ISO vs. RHP | HC% vs. RHP | wOBA L14 | FD Position | FD Salary | DK Position | DK Salary |
| 1 | | RIGHT | 0.371 | 0.213 | 33.9% | 0.385 | OF | $4,000 | 2B/OF | $4,900 |
| 2 | | RIGHT | 0.299 | 0.144 | 34.6% | 0.364 | OF | $3,800 | OF | $4,100 |
| 3 | | LEFT | 0.381 | 0.234 | 36.0% | 0.425 | 2B | $4,300 | 2B | $5,400 |
| 4 | | LEFT | 0.433 | 0.294 | 36.8% | 0.476 | OF | $4,300 | OF | $5,300 |
| 5 | | RIGHT | 0.331 | 0.158 | 37.0% | 0.421 | 3B | $3,600 | 3B | $4,600 |
| 6 | | RIGHT | 0.286 | 0.159 | 32.8% | 0.238 | 1B | $3,200 | 1B | $3,500 |
| 7 | | RIGHT | 0.308 | 0.146 | 30.6% | 0.199 | C | $3,300 | C | $3,900 |
| 8 | | SWITCH | 0.306 | 0.160 | 30.3% | 0.312 | SS | $3,400 | SS | $3,800 |
| 9 | | RIGHT | 0.149 | 0.033 | 8.7% | 0.138 | P | $8,500 | P | $8,600 |
| | Team Averages | — | 0.318 | 0.171 | 31.2% | 0.329 | — | — | — | — |
Elite Plays – , ,
Secondary Plays – ,
Stackability – YELLOW / GREEN
Philadelphia
The Phillies have struggled against right-handed pitching this season, but they draw a decent matchup against . His command has been off in his last few starts, which has led to a higher walk rate and a lower strikeout rate. There isn’t a lot to like from the Phillies’ side tonight, but Roark has allowed a .315 wOBA and a 31.3% hard contact rate to left-handed hitters in the last two seasons. makes an intriguing one-off in tournaments.
- Phillies Offense (2016)
Team wOBA vs. RHP — 0.298 (28 of 30)
Team wOBA L30 Days — 0.309 (23 of 30)
Team ISO vs. RHP — 0.161 (17 of 30)
Team K% vs. RHP — 21.9% (22 of 30)
Pitches Per PA vs. RHP — 3.77 (28 of 30)
Runs Per Game — 3.75 (29 of 30)
Projected Run Total — 3.92 (20 of 26)
Projected Lineup
| # | Player | Bats | wOBA vs. RHP | ISO vs. RHP | HC% vs. RHP | wOBA L14 | FD Position | FD Salary | DK Position | DK Salary |
| 1 | | SWITCH | 0.310 | 0.106 | 26.2% | 0.475 | 2B | $3,000 | 2B | $4,200 |
| 2 | | LEFT | 0.348 | 0.147 | 29.8% | 0.304 | OF | $2,900 | OF | $4,200 |
| 3 | | RIGHT | 0.347 | 0.218 | 33.6% | 0.254 | OF | $2,900 | OF | $3,900 |
| 4 | | RIGHT | 0.322 | 0.185 | 27.9% | 0.322 | 3B | $2,700 | 3B | $3,700 |
| 5 | | LEFT | 0.324 | 0.247 | 42.7% | 0.291 | 1B | $2,800 | 1B | $3,400 |
| 6 | | RIGHT | 0.295 | 0.148 | 29.5% | 0.249 | C | $2,600 | C | $3,300 |
| 7 | | SWITCH | 0.291 | 0.135 | 28.2% | 0.353 | SS | $2,500 | SS | $3,800 |
| 8 | | RIGHT | 0.276 | 0.143 | 22.5% | 0.262 | OF | $2,600 | OF | $2,800 |
| 9 | | RIGHT | 0.219 | 0.000 | 25.0% | 0.000 | P | $5,500 | P | $4,000 |
| | Team Averages | — | 0.304 | 0.148 | 29.5% | 0.279 | — | — | — | — |
Elite Plays – NONE
Secondary Plays –
Stackability – RED
Chicago White Sox at Detroit – 7:08 PM ET
| Chicago White Sox | Detroit |
 | |  | |
| RIGHT | LEFT |
| Vegas Moneyline | Vegas Over/Under |
| DET -185 | 10.0 |
| Stats | wOBA | HR All. | HC% | K% | Stats | wOBA | HR All. | HC% | K% |
| SP vs. Left (2015-16) | 0.377 | 35 | 31.3% | 17.6% | SP vs. Left (2015-16) | 0.377 | 8 | 31.7% | 14.8% |
| SP vs. Right (2015-16) | 0.334 | 29 | 34.5% | 24.0% | SP vs. Right (2015-16) | 0.348 | 22 | 33.1% | 20.3% |
Pitcher Grind Down
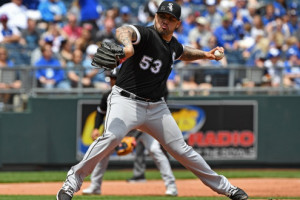
| James Shields |
 | FanDuel | DraftKings |
| Salary: | $5,900 | Salary: | $4,000 |
| FPPG: | 19.0 | FPPG: | 8.0 |
| Pitcher Rating: | 37.9 | Pitcher Rank: | 24 |
| Statistics | Starts | PitchPS | SIERA | ERA | K% | BB% | SS% | GB% | FB% | HC% |
| L30 Days | 5 | 84.0 | 5.87 | 13.95 | 9.9% | 7.2% | 6.9% | 33.0% | 45.5% | 43.2% |
| 2016 | 26 | 93.9 | 5.22 | 5.98 | 15.0% | 9.3% | 8.6% | 40.5% | 37.8% | 34.7% |
| 2015 | 33 | 101.1 | 3.72 | 3.91 | 25.1% | 9.4% | 12.4% | 44.9% | 34.4% | 31.2% |
Something has to give in this matchup. Shields hasn’t been able to get anyone out this season and the Tigers haven’t been able to capitalize on favorable matchups (which has led to a lot of DFS tilt). While anything can happen in baseball, I’m more inclined to trust the Tigers than I am Shields. In his last five starts, he has a 13.95 ERA (5.87 SIERA) with a strikeout rate under 10%. He is allowing a ridiculous amount of hard contact lately and his high fly-ball rate is compounding the problem.
| Matt Boyd |
 | FanDuel | DraftKings |
| Salary: | $6,600 | Salary: | $6,700 |
| FPPG: | 25.1 | FPPG: | 12.9 |
| Pitcher Rating: | 56.2 | Pitcher Rank: | 12 |
| Statistics | Starts | PitchPS | SIERA | ERA | K% | BB% | SS% | GB% | FB% | HC% |
| L30 Days | 5 | 105.6 | 4.43 | 3.00 | 21.7% | 8.3% | 10.2% | 36.9% | 52.4% | 31.0% |
| 2016 | 13 | 98.9 | 4.35 | 3.98 | 20.5% | 7.7% | 8.9% | 39.9% | 43.6% | 31.7% |
| 2015 | 12 | 83.6 | 4.83 | 7.53 | 17.1% | 7.9% | 8.2% | 31.9% | 51.9% | 34.0% |
If Boyd makes it out of the fifth inning, he should walk away with a win. There isn’t another offense on the board that I feel more comfortable with when it comes to run support. Boyd hasn’t been great this season, but he does have a strikeout rate above 20%. He draws a mediocre matchup against the White Sox, who are ranked right around the major league average in team wOBA, team ISO, and team K% against left-handed pitching this season. Boyd is cheap and has a good chance at picking up the win, but I wouldn’t consider him a cash game option in this slate.
Batter Grind Down
Chicago White Sox
The White Sox offense has struggled all season, but they have been better over the last month of play. They are going to get overlooked tonight, as everyone is going to be targeting the other offense in this game. Chicago draws an exploitable matchup against , who has allowed a .348 wOBA, 22 home runs, and a hard contact rate of 33.1% to right-handed hitters in the last two seasons.
- White Sox Offense (2016)
Team wOBA vs. LHP — 0.325 (13 of 30)
Team wOBA L30 Days — 0.323 (15 of 30)
Team ISO vs. LHP — 0.163 (16 of 30)
Team K% vs. LHP — 22.0% (17 of 30)
Pitches Per PA vs. LHP — 3.83 (18 of 30)
Runs Per Game — 4.08 (25 of 30)
Projected Run Total — 4.51 (12 of 26)
Projected Lineup
| # | Player | Bats | wOBA vs. LHP | ISO vs. LHP | HC% vs. LHP | wOBA L14 | FD Position | FD Salary | DK Position | DK Salary |
| 1 | | LEFT | 0.305 | 0.062 | 23.8% | 0.363 | OF | $3,200 | OF | $3,900 |
| 2 | | RIGHT | 0.383 | 0.185 | 37.5% | 0.427 | SS | $2,600 | SS | $4,000 |
| 3 | | SWITCH | 0.297 | 0.123 | 27.3% | 0.274 | OF | $3,100 | OF | $3,700 |
| 4 | | RIGHT | 0.287 | 0.142 | 35.6% | 0.441 | 1B | $3,500 | 1B | $3,900 |
| 5 | | RIGHT | 0.363 | 0.332 | 36.7% | 0.309 | 3B | $3,900 | 3B | $4,300 |
| 6 | | LEFT | 0.360 | 0.177 | 26.0% | 0.291 | 1B | $2,700 | 1B | $3,000 |
| 7 | | RIGHT | 0.330 | 0.145 | 33.8% | 0.486 | OF | $3,100 | OF | $3,600 |
| 8 | | LEFT | 0.275 | 0.100 | 17.4% | 0.675 | C | $2,300 | C | $2,900 |
| 9 | | RIGHT | 0.304 | 0.120 | 20.8% | 0.364 | SS | $3,000 | 2B/SS | $3,500 |
| | Team Averages | — | 0.323 | 0.154 | 28.8% | 0.403 | — | — | — | — |
Elite Plays – NONE
Secondary Plays – , ,
Stackability – ORANGE / YELLOW
Detroit
The Tigers would have the highest run projection in the slate if there weren’t a game in Coors Field tonight. They easily have the best matchup, as they get to face James “I’m allergic to outs” Shields. In addition to the fly balls and the hard contact, Shields has allowed a .391 wOBA to left-handed hitters and a .371 wOBA to right-handed hitters this season. The Tigers must be played tonight and they must be stacked.
- Tigers Offense (2016)
Team wOBA vs. RHP — 0.328 (8 of 30)
Team wOBA L30 Days — 0.333 (10 of 30)
Team ISO vs. RHP — 0.171 (10 of 30)
Team K% vs. RHP — 21.4% (19 of 30)
Pitches Per PA vs. RHP — 3.87 (15 of 30)
Runs Per Game — 4.67 (9 of 30)
Projected Run Total — 5.49 (2 of 26)
Projected Lineup
| # | Player | Bats | wOBA vs. RHP | ISO vs. RHP | HC% vs. RHP | wOBA L14 | FD Position | FD Salary | DK Position | DK Salary |
| 1 | | RIGHT | 0.330 | 0.149 | 29.3% | 0.199 | 2B | $3,800 | 2B | $4,400 |
| 2 | | RIGHT | 0.320 | 0.092 | 21.6% | 0.462 | OF | $2,800 | OF | $4,400 |
| 3 | | RIGHT | 0.402 | 0.221 | 40.0% | 0.369 | 1B | $3,900 | 1B | $5,400 |
| 4 | | SWITCH | 0.314 | 0.163 | 36.0% | 0.417 | C | $3,600 | 1B | $4,500 |
| 5 | | RIGHT | 0.378 | 0.245 | 40.4% | 0.507 | OF | $3,700 | OF | $5,100 |
| 6 | | RIGHT | 0.336 | 0.202 | 36.2% | 0.392 | OF | $3,000 | OF | $4,400 |
| 7 | | RIGHT | 0.220 | 0.065 | 21.8% | 0.213 | 3B | $2,200 | 3B | $2,700 |
| 8 | | RIGHT | 0.255 | 0.083 | 25.6% | 0.398 | C | $2,700 | C | $3,500 |
| 9 | | RIGHT | 0.278 | 0.052 | 14.5% | 0.230 | SS | $2,300 | SS | $2,400 |
| | Team Averages | — | 0.315 | 0.141 | 29.5% | 0.354 | — | — | — | — |
Elite Plays – , , , ,
Secondary Plays –
Stackability – GREEN
Miami at NY Mets – 7:10 PM ET
| Miami | NY Mets |
 | |  | |
| RIGHT | RIGHT |
| Vegas Moneyline | Vegas Over/Under |
| MIA -155 | 7.0 |
| Stats | wOBA | HR All. | HC% | K% | Stats | wOBA | HR All. | HC% | K% |
| SP vs. Left (2015-16) | 0.319 | 9 | 34.3% | 26.5% | SP vs. Left (2015-16) | 0.561 | 0 | 45.5% | 16.7% |
| SP vs. Right (2015-16) | 0.228 | 6 | 26.6% | 40.8% | SP vs. Right (2015-16) | 0.200 | 0 | 28.0% | 32.5% |
Pitcher Grind Down
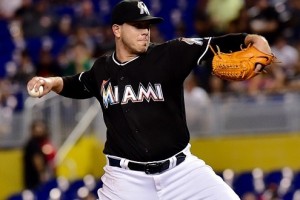
| Jose Fernandez |
 | FanDuel | DraftKings |
| Salary: | $11,000 | Salary: | $12,700 |
| FPPG: | 43.9 | FPPG: | 24.6 |
| Pitcher Rating: | 94.9 | Pitcher Rank: | 1 |
| Statistics | Starts | PitchPS | SIERA | ERA | K% | BB% | SS% | GB% | FB% | HC% |
| L30 Days | 4 | 96.3 | 3.20 | 3.52 | 28.4% | 6.9% | 16.1% | 43.8% | 21.9% | 30.8% |
| 2016 | 24 | 99.8 | 2.69 | 2.91 | 35.4% | 7.3% | 15.0% | 41.4% | 29.0% | 31.5% |
| 2015 | 11 | 90.2 | 2.77 | 2.92 | 29.8% | 5.3% | 13.3% | 40.1% | 31.1% | 29.4% |
Fernandez pitched out of some jams in his last start, finishing with nine strikeouts in seven shutout innings of work. While he is pitching on the road tonight, he should still be considered the premier pitcher in the slate. The Mets’ offense is getting some of their key pieces back, but they are still an exploitable matchup. They have the ninth highest team strikeout rate against right-handed pitching this season. Fernandez can afford to be aggressive (I suppose he’s always aggressive) in this ballpark, which doesn’t yield a lot of runs historically.
| Rafael Montero |
 | FanDuel | DraftKings |
| Salary: | | Salary: | $4,000 |
| FPPG: | | FPPG: | 0.8 |
| Pitcher Rating: | 54.1 | Pitcher Rank: | 14 |
| Statistics | Starts | PitchPS | SIERA | ERA | K% | BB% | SS% | GB% | FB% | HC% |
| 2016 | 0 | 0.0 | 3.45 | 11.57 | 25.0% | 8.3% | 2.1% | 37.5% | 25.0% | 62.5% |
| 2015 | 1 | 92.0 | 3.38 | 4.50 | 28.3% | 10.9% | 9.9% | 48.1% | 33.3% | 25.0% |
Montero will be making a spot start for Jacob deGrom, who will be skipped in the rotation one time. Montero has made 17 career major league appearances, posting a 4.45 ERA with a strikeout rate of 23%. While these spot starts can provide value opportunities every now and then, Montero has been in bad form in the minors. In his last 16 Triple-A starts, he has a 7.20 ERA with a strikeout rate of only 17.7%. As a large underdog at home, Montero should be avoided in all league formats tonight.
Batter Grind Down
Miami
Even though the Marlins are sizable favorites tonight, they still have the fifth lowest run projection in the slate. That says more about the other offenses than it does the Marlins, as they draw an exploitable matchup against . There is a good chance that I won’t end up with any Marlins’ hitters tonight, but I do expect them to give some run support. In his 17 major league appearances, Montero has allowed a .423 wOBA to left-handed hitters.
- Marlins Offense (2016)
Team wOBA vs. RHP — 0.315 (15 of 30)
Team wOBA L30 Days — 0.306 (25 of 30)
Team ISO vs. RHP — 0.132 (28 of 30)
Team K% vs. RHP — 18.9% (5 of 30)
Pitches Per PA vs. RHP — 3.82 (24 of 30)
Runs Per Game — 4.19 (22 of 30)
Projected Run Total — 3.82 (22 of 26)
Projected Lineup
| # | Player | Bats | wOBA vs. RHP | ISO vs. RHP | HC% vs. RHP | wOBA L14 | FD Position | FD Salary | DK Position | DK Salary |
| 1 | | LEFT | 0.318 | 0.073 | 18.0% | 0.222 | 2B | $2,900 | 2B | $4,600 |
| 2 | | RIGHT | 0.308 | 0.098 | 25.0% | 0.338 | 3B | $3,100 | 3B | $3,500 |
| 3 | | LEFT | 0.376 | 0.175 | 38.9% | 0.316 | OF | $3,800 | OF | $5,000 |
| 4 | | RIGHT | 0.302 | 0.142 | 34.6% | 0.280 | OF | $3,300 | OF | $4,000 |
| 5 | | RIGHT | 0.317 | 0.122 | 29.6% | 0.306 | C | $3,000 | C | $4,100 |
| 6 | | LEFT | 0.264 | 0.045 | 17.7% | 0.228 | OF | $2,700 | OF | $3,400 |
| 7 | | RIGHT | 0.295 | 0.074 | 23.3% | 0.300 | 1B | $2,000 | 1B | $2,600 |
| 8 | | RIGHT | 0.273 | 0.078 | 27.0% | 0.288 | SS | $2,300 | SS | $2,700 |
| 9 | | RIGHT | 0.261 | 0.089 | 14.0% | 0.585 | P | $11,000 | P | $12,700 |
| | Team Averages | — | 0.302 | 0.100 | 25.3% | 0.318 | — | — | — | — |
Elite Plays – NONE
Secondary Plays – ,
Stackability – ORANGE
NY Mets
The Mets have the most difficult matchup on the board tonight. In addition to an elite strikeout rate, has held both left and right-handed hitters under a .300 wOBA this season. With the second lowest implied team total in the slate, the Mets can be avoided in both cash games and GPPs.
- Mets Offense (2016)
Team wOBA vs. RHP — 0.306 (24 of 30)
Team wOBA L30 Days — 0.319 (18 of 30)
Team ISO vs. RHP — 0.169 (13 of 30)
Team K% vs. RHP — 21.9% (22 of 30)
Pitches Per PA vs. RHP — 3.91 (8 of 30)
Runs Per Game — 3.94 (28 of 30)
Projected Run Total — 3.18 (25 of 26)
Projected Lineup
| # | Player | Bats | wOBA vs. RHP | ISO vs. RHP | HC% vs. RHP | wOBA L14 | FD Position | FD Salary | DK Position | DK Salary |
| 1 | | SWITCH | 0.297 | 0.105 | 20.5% | 0.408 | 3B | $3,000 | 3B/SS | $3,200 |
| 2 | | LEFT | 0.358 | 0.220 | 36.8% | 0.218 | OF | $3,000 | OF | $3,100 |
| 3 | | RIGHT | 0.379 | 0.263 | 36.6% | 0.499 | OF | $3,400 | OF | $3,900 |
| 4 | | SWITCH | 0.335 | 0.175 | 34.6% | 0.534 | 2B | $3,200 | 2B | $3,200 |
| 5 | | LEFT | 0.333 | 0.253 | 38.4% | 0.245 | OF | $3,000 | OF | $3,200 |
| 6 | | LEFT | 0.314 | 0.098 | 24.6% | 0.186 | 1B | $2,200 | 1B | $2,200 |
| 7 | Travis D’Arnaud | RIGHT | 0.317 | 0.158 | 29.4% | 0.327 | C | $2,200 | C | $2,500 |
| 8 | | LEFT | 0.320 | 0.165 | 32.7% | 0.482 | 3B | $2,500 | 2B/3B | $2,600 |
| 9 | | RIGHT | | | | | | | P | $4,000 |
| | Team Averages | — | 0.332 | 0.180 | 31.7% | 0.362 | — | — | — | — |
Elite Plays – NONE
Secondary Plays – NONE
Stackability – RED
Minnesota at Cleveland – 7:10 PM ET
| Minnesota | Cleveland |
 | |  | |
| LEFT | RIGHT |
| Vegas Moneyline | Vegas Over/Under |
| CLE -185 | 9.0 |
| Stats | wOBA | HR All. | HC% | K% | Stats | wOBA | HR All. | HC% | K% |
| SP vs. Left (2015-16) | 0.306 | 9 | 30.2% | 18.7% | SP vs. Left (2015-16) | 0.311 | 18 | 33.6% | 22.7% |
| SP vs. Right (2015-16) | 0.332 | 47 | 36.2% | 20.8% | SP vs. Right (2015-16) | 0.306 | 20 | 30.3% | 21.3% |
Pitcher Grind Down
| Hector Santiago |
 | FanDuel | DraftKings |
| Salary: | $7,100 | Salary: | $4,300 |
| FPPG: | 25.2 | FPPG: | 12.0 |
| Pitcher Rating: | 39.4 | Pitcher Rank: | 23 |
| Statistics | Starts | PitchPS | SIERA | ERA | K% | BB% | SS% | GB% | FB% | HC% |
| L30 Days | 5 | 91.8 | 5.37 | 9.38 | 15.4% | 7.7% | 6.5% | 26.4% | 50.6% | 38.2% |
| 2016 | 26 | 94.8 | 4.83 | 5.16 | 19.6% | 9.9% | 8.9% | 36.4% | 48.2% | 36.2% |
| 2015 | 32 | 98.8 | 4.50 | 3.59 | 20.9% | 9.2% | 8.5% | 29.9% | 53.6% | 33.6% |
Santiago has been shelled in his last five starts, posting a 9.38 ERA (5.37 SIERA) with a strikeout rate of 15.4% and a walk rate of 7.7%. He is an extreme fly-ball pitcher that gives up a lot of hard contact. That is one of the worst possible combinations that a pitcher can have, especially when it is accompanied by a low strikeout rate. Santiago is one of my least favorite pitchers in the slate and as I will get to below, the Indians are one of my favorite GPP stacks.
| Trevor Bauer |
 | FanDuel | DraftKings |
| Salary: | $8,200 | Salary: | $8,300 |
| FPPG: | 26.8 | FPPG: | 13.8 |
| Pitcher Rating: | 61.2 | Pitcher Rank: | 9 |
| Statistics | Starts | PitchPS | SIERA | ERA | K% | BB% | SS% | GB% | FB% | HC% |
| L30 Days | 6 | 98.5 | 4.67 | 4.63 | 18.5% | 9.6% | 7.6% | 45.9% | 29.7% | 29.5% |
| 2016 | 21 | 115.5 | 4.27 | 3.88 | 21.0% | 9.1% | 9.0% | 48.6% | 31.8% | 32.9% |
| 2015 | 30 | 95.6 | 4.20 | 4.55 | 22.9% | 10.6% | 9.6% | 39.2% | 40.7% | 31.0% |
Bauer hasn’t looked sharp over the last month of play, posting a 4.67 SIERA with a strikeout rate of 18.5% and a walk rate of 9.6%. He may be a large favorite tonight, but that has more to do with the opposing pitcher than anything else. The Twins have quietly been one of the best offenses in baseball recently, ranking eighth in team wOBA in the last month of play. I fully expect this game to turn into a shootout and will be avoiding both of the starting pitchers.
Batter Grind Down
Minnesota
Do you know who is going to be on the Twins tonight? No one.
They are an intriguing stack in tournaments, as their ownership is going to be close to non-existent. They are large underdogs and they have the tenth lowest run projection in the slate. However, I see a red-hot offense that gets to face a struggling pitcher. is the only cash-viable hitter in this lineup, but don’t be afraid to throw out a Twins’ stack in a GPP or two tonight.
- Twins Offense (2016)
Team wOBA vs. RHP — 0.316 (14 of 30)
Team wOBA L30 Days — 0.335 (8 of 30)
Team ISO vs. RHP — 0.165 (16 of 30)
Team K% vs. RHP — 21.7% (20 of 30)
Pitches Per PA vs. RHP — 3.95 (5 of 30)
Runs Per Game — 4.57 (12 of 30)
Projected Run Total — 4.01 (17 of 26)
Projected Lineup
| # | Player | Bats | wOBA vs. RHP | ISO vs. RHP | HC% vs. RHP | wOBA L14 | FD Position | FD Salary | DK Position | DK Salary |
| 1 | | RIGHT | 0.333 | 0.222 | 30.9% | 0.403 | 2B | $3,900 | 2B | $4,700 |
| 2 | | LEFT | 0.326 | 0.120 | 31.2% | 0.273 | 1B | $3,100 | 1B | $4,000 |
| 3 | | LEFT | 0.369 | 0.262 | 35.0% | 0.287 | OF | $3,500 | OF | $4,600 |
| 4 | | RIGHT | 0.306 | 0.173 | 32.4% | 0.397 | 3B | $2,900 | 3B | $3,800 |
| 5 | | RIGHT | 0.361 | 0.243 | 39.5% | 0.176 | OF | $3,400 | 3B/OF | $3,500 |
| 6 | | RIGHT | 0.321 | 0.118 | 26.4% | 0.279 | 3B | $3,000 | 3B/SS | $3,400 |
| 7 | | LEFT | 0.308 | 0.188 | 31.2% | 0.249 | OF | $2,900 | OF | $3,200 |
| 8 | | RIGHT | 0.284 | 0.095 | 26.9% | 0.280 | C | $2,200 | C | $3,000 |
| 9 | | SWITCH | 0.316 | 0.150 | 31.3% | 0.338 | OF | $2,600 | OF | $3,600 |
| | Team Averages | — | 0.325 | 0.175 | 31.6% | 0.298 | — | — | — | — |
Elite Plays –
Secondary Plays – , ,
Stackability – ORANGE / YELLOW
Cleveland
Even though the Indians have one of the best matchups in the slate, I don’t expect their offense to be very popular tonight. There are a ton of great offenses to target and we typically don’t like to target Cleveland against southpaws. While has been tough on left-handed hitters, he is atrocious against righties. In the last two seasons, he has allowed a .332 wOBA, 47 home runs, and a hard contact rate of 36.2% to batters from the right side of the plate.
- Indians Offense (2016)
Team wOBA vs. LHP — 0.323 (18 of 30)
Team wOBA L30 Days — 0.339 (6 of 30)
Team ISO vs. LHP — 0.149 (24 of 30)
Team K% vs. LHP — 21.2% (14 of 30)
Pitches Per PA vs. LHP — 3.92 (8 of 30)
Runs Per Game — 4.93 (5 of 30)
Projected Run Total — 4.99 (7 of 26)
Projected Lineup
| # | Player | Bats | wOBA vs. LHP | ISO vs. LHP | HC% vs. LHP | wOBA L14 | FD Position | FD Salary | DK Position | DK Salary |
| 1 | | RIGHT | 0.315 | 0.173 | 29.9% | 0.269 | OF | $3,300 | OF | $4,800 |
| 2 | | LEFT | 0.319 | 0.148 | 29.7% | 0.268 | 2B | $3,600 | 2B | $4,100 |
| 3 | | SWITCH | 0.349 | 0.154 | 23.2% | 0.284 | SS | $3,400 | SS | $4,200 |
| 4 | | RIGHT | 0.394 | 0.263 | 38.8% | 0.235 | 1B | $3,400 | 1B | $4,200 |
| 5 | | SWITCH | 0.324 | 0.108 | 28.1% | 0.377 | 1B | $3,500 | 1B | $4,300 |
| 6 | Jose Ramirez | SWITCH | 0.311 | 0.129 | 23.7% | 0.341 | 3B | $3,400 | 3B/OF | $4,500 |
| 7 | | RIGHT | 0.398 | 0.203 | 32.9% | 0.335 | OF | $2,900 | OF | $4,500 |
| 8 | | SWITCH | 0.287 | 0.105 | 23.8% | 0.281 | OF | $2,600 | OF | $3,700 |
| 9 | | RIGHT | 0.320 | 0.115 | 28.1% | 0.333 | C | $2,300 | C | $3,200 |
| | Team Averages | — | 0.335 | 0.155 | 28.7% | 0.303 | — | — | — | — |
Elite Plays –
Secondary Plays – , , , Jose Ramirez
Stackability – YELLOW / GREEN
Want to discuss strategy for today’s games? Head over to the RotoGrinders Forums
Jump to Page 1 2 3
