MLB Grind Down: Wednesday, August 23rd

Jump to Page 1 2 3
The RotoGrinders MLB Grind Down will give you an in-depth analysis into the upcoming MLB schedule. This article will break down the numbers for every single game and give you analysis on which trends you can exploit. While matchups are a major factor in daily fantasy baseball, there are plenty of other factors to consider such as injuries, weather, and salaries.
The analysis should point you in the right direction, but it is still up to you to decipher the information and make your own selections. No sport has more variance than baseball. The best choice is not always the right choice but following the trends will win you money over time.
Note: As always, if you want to try a new DFS site, be sure to click through a RotoGrinders link and use our DraftKings promo code, FanDuel promo code, and FantasyDraft promo code to receive the best perks in the industry.
Stackability Rating System:
GREEN – A viable full stack in cash games and GPPs.
YELLOW – A viable mini-stack in cash games and full stack in GPPs.
ORANGE – A viable stack in large field GPPs.
RED – Not a recommended stack for cash games or GPPs.
Oakland at Baltimore – 3:05 PM ET
| Oakland | Baltimore | ||||||||||||||
 | Daniel Gossett |  | Dylan Bundy | ||||||||||||
| RIGHT | RIGHT | ||||||||||||||
| Vegas Moneyline | Vegas Over/Under | ||||||||||||||
| BAL-180 | 10.5 | ||||||||||||||
| Stats | wOBA | xwOBA | HC% | BB% | K% | GB% | Stats | wOBA | xwOBA | HC% | BB% | K% | GB% | ||
|---|---|---|---|---|---|---|---|---|---|---|---|---|---|---|---|
| SP vs. Left (2016-17) | 0.332 | 0.321 | 21.8% | 8.2% | 12.7% | 54.1% | SP vs. Left (2016-17) | 0.331 | 0.333 | 34.0% | 8.1% | 17.1% | 33.3% | ||
| SP vs. Right (2016-17) | 0.346 | 0.382 | 37.4% | 3.2% | 18.9% | 36.7% | SP vs. Right (2016-17) | 0.315 | 0.309 | 30.6% | 8.1% | 24.9% | 34.6% | ||
Pitcher Grind Down
| Daniel Gossett | |||||||||
 | FanDuel | DraftKings | FantasyDraft | ||||||
| Salary: | $6,700 | Salary: | $8,600 | Salary: | |||||
| Salary Rank: | 16 of 30 | Salary Rank: | 8 of 30 | Salary Rank: | of 30 | ||||
| Stats | Starts | SIERA | ERA | K% | BB% | GB% | HC% | SC% | |
|---|---|---|---|---|---|---|---|---|---|
| 2017 | 10 | 4.64 | 5.17 | 16.0% | 5.5% | 44.8% | 30.1% | 16.7% | |
| L30 | 3 | 4.69 | 3.78 | 20.6% | 9.6% | 38.0% | 23.5% | 7.8% | |
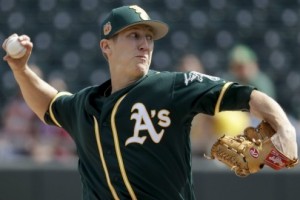
The day slates seem to be getting smaller and smaller each week. On a typical Wednesday, we usually have five or six early games, but there are only two on the schedule today. Sean Manaea was originally scheduled to make today’s start, but it looks like Gossett will be on the mound for the A’s instead. Gossett was never a top pitching prospect as he made his way up through the ranks, but he had a great ability to get better at each and every level. He’s been in slightly better form over his last three starts, so maybe he can develop into a back of the rotation type of pitcher. As for his appeal today, he is an easy fade in a road start against the Orioles, who have the highest implied total of any team on the board.
Quick Breakdown: Continue to take a wait and see approach with Gossett.
| Dylan Bundy | |||||||||
 | FanDuel | DraftKings | FantasyDraft | ||||||
| Salary: | $8,600 | Salary: | $10,800 | Salary: | |||||
| Salary Rank: | 6 of 30 | Salary Rank: | 4 of 30 | Salary Rank: | of 30 | ||||
| Stats | Starts | SIERA | ERA | K% | BB% | GB% | HC% | SC% | |
|---|---|---|---|---|---|---|---|---|---|
| 2016 | 14 | 4.23 | 4.02 | 21.9% | 8.9% | 35.9% | 28.0% | 23.6% | |
| 2017 | 23 | 4.65 | 4.17 | 20.3% | 7.5% | 32.3% | 35.9% | 17.8% | |
| L30 | 4 | 3.73 | 4.10 | 26.9% | 6.5% | 35.2% | 40.3% | 12.5% | |
When you play these small two-game slates, you are going to be uncomfortable with some of your selections. That’s just the way it works when there are only four teams to select players from. Bundy would ordinarily be way overpriced, but looking at the other options in the slate, he’s the cream of the crop. He has flashed some form in his last five outings, posting a 3.73 SIERA with a strikeout rate of 27%. While the A’s have more power in their lineup than they did earlier in the year, they still strikeout at a high clip. Eight of their nine projected starters have a strikeout rate above 20% against right-handed pitching this season.
Quick Breakdown: Bundy is a large favorite and has the best strikeout potential of any pitcher in the early slate.
Batter Grind Down
Oakland
If you want to be contrarian in the early slate, you can take a pitcher from the other game and look to target a few A’s hitters against Dylan Bundy, who figures to be the chalkiest play on the board. This certainly isn’t a bad matchup for the A’s, as they see a sizable ballpark shift playing in Camden Yards. Since the start of last season, Bundy has allowed a .333 xwOBA and a 34% hard contact rate to left-handed hitters. He is also a fly-ball pitcher that is facing a fly-ball offense in a home run-friendly ballpark.
Projected Lineup (Splits vs. RH Pitching)
| # | Player | Bats | wOBA | xwOBA | ISO | HC% | BB% | K% | GB% | FD Pos. | FD Sal. | DK Pos. | DK Sal. | FDRFT Pos. | FDRFT Sal. |
|---|---|---|---|---|---|---|---|---|---|---|---|---|---|---|---|
| 1 | Matt Joyce | LEFT | 0.342 | 0.362 | 0.234 | 32.3% | 13.4% | 20.4% | 33.2% | OF | $3,500 | OF | $4,700 | N/A | N/A |
| 2 | Marcus Semien | RIGHT | 0.321 | 0.318 | 0.146 | 26.0% | 10.8% | 24.8% | 37.0% | SS | $3,200 | SS | $3,500 | N/A | N/A |
| 3 | Jed Lowrie | SWITCH | 0.346 | 0.368 | 0.180 | 37.2% | 9.6% | 15.1% | 27.2% | 2B | $3,300 | 2B | $4,400 | N/A | N/A |
| 4 | Khris Davis | RIGHT | 0.365 | 0.380 | 0.301 | 40.5% | 10.1% | 31.4% | 39.2% | OF | $4,200 | OF | $4,000 | N/A | N/A |
| 5 | Ryon Healy | RIGHT | 0.291 | 0.304 | 0.172 | 36.5% | 3.6% | 25.7% | 44.9% | 1B | $3,500 | 1B/3B | $3,600 | N/A | N/A |
| 6 | Matt Olson | LEFT | 0.378 | 0.348 | 0.333 | 42.9% | 10.7% | 32.0% | 46.3% | 1B | $2,600 | 1B/OF | $3,500 | N/A | N/A |
| 7 | Matt Chapman | RIGHT | 0.364 | 0.289 | 0.324 | 39.4% | 9.8% | 31.1% | 32.4% | 3B | $3,100 | 3B | $3,500 | N/A | N/A |
| 8 | Bruce Maxwell | LEFT | 0.292 | 0.301 | 0.078 | 35.6% | 13.9% | 22.6% | 46.0% | C | $2,000 | C | $2,200 | N/A | N/A |
| 9 | Boog Powell | LEFT | 0.260 | 0.247 | 0.022 | 23.5% | 11.5% | 23.1% | 59.4% | OF | $2,500 | OF | $3,400 | N/A | N/A |
Elite Plays – None
Secondary Plays – Matt Joyce, Jed Lowrie, Khris Davis, Matt Olson
Stackability – ORANGE / YELLOW
Baltimore
As mentioned earlier, the Orioles have the highest implied run total of any team on the board today and that includes the 13 games in the main slate. They draw a favorable matchup against the rookie Daniel Gossett, who has allowed a .321 xwOBA to left-handed hitters and a .382 xwOBA with a 37% hard contact rate to right-handed hitters. We have a reverse-splits pitcher that is facing a right-handed heavy lineup in a hitter-friendly ballpark. The O’s may have let a lot of people down last night, but we can hop right back on them today against Gossett.
Projected Lineup (Splits vs. RH Pitching)
| # | Player | Bats | wOBA | xwOBA | ISO | HC% | BB% | K% | GB% | FD Pos. | FD Sal. | DK Pos. | DK Sal. | FDRFT Pos. | FDRFT Sal. |
|---|---|---|---|---|---|---|---|---|---|---|---|---|---|---|---|
| 1 | Tim Beckham | RIGHT | 0.353 | 0.320 | 0.197 | 43.4% | 5.3% | 29.7% | 47.2% | SS | $3,600 | SS | $4,800 | N/A | N/A |
| 2 | Manny Machado | RIGHT | 0.332 | 0.360 | 0.217 | 37.2% | 7.9% | 16.5% | 42.2% | 3B | $4,300 | 3B | $5,700 | N/A | N/A |
| 3 | Jonathan Schoop | RIGHT | 0.360 | 0.311 | 0.211 | 32.0% | 4.5% | 20.3% | 41.5% | 2B | $4,000 | 2B | $5,200 | N/A | N/A |
| 4 | Adam Jones | RIGHT | 0.333 | 0.309 | 0.188 | 31.1% | 3.5% | 17.5% | 45.1% | OF | $4,100 | OF | $5,300 | N/A | N/A |
| 5 | Trey Mancini | RIGHT | 0.384 | 0.349 | 0.268 | 34.7% | 6.6% | 23.4% | 53.1% | OF | $3,300 | 1B/OF | $3,700 | N/A | N/A |
| 6 | Mark Trumbo | RIGHT | 0.301 | 0.315 | 0.173 | 31.2% | 8.1% | 23.7% | 42.6% | OF | $3,800 | OF | $4,300 | N/A | N/A |
| 7 | Chris Davis | LEFT | 0.325 | 0.333 | 0.243 | 43.5% | 12.7% | 34.9% | 33.1% | 1B | $3,400 | 1B | $4,600 | N/A | N/A |
| 8 | Welington Castillo | RIGHT | 0.327 | 0.322 | 0.195 | 35.5% | 6.4% | 25.6% | 42.0% | C | $3,200 | C | $3,700 | N/A | N/A |
| 9 | Seth Smith | LEFT | 0.348 | 0.359 | 0.192 | 37.4% | 9.7% | 20.0% | 41.9% | OF | $2,600 | OF | $3,800 | N/A | N/A |
Elite Plays – Tim Beckham, Manny Machado, Jonathan Schoop, Adam Jones
Secondary Plays – Trey Mancini, Mark Trumbo, Chris Davis
Stackability – GREEN
Milwaukee at San Francisco – 3:45 PM ET
| Milwaukee | San Francisco | ||||||||||||||
 | Matt Garza |  | Matt Moore | ||||||||||||
| RIGHT | LEFT | ||||||||||||||
| Vegas Moneyline | Vegas Over/Under | ||||||||||||||
| SF -105 | 9.0 | ||||||||||||||
| Stats | wOBA | xwOBA | HC% | BB% | K% | GB% | Stats | wOBA | xwOBA | HC% | BB% | K% | GB% | ||
|---|---|---|---|---|---|---|---|---|---|---|---|---|---|---|---|
| SP vs. Left (2016-17) | 0.363 | 0.354 | 37.1% | 10.6% | 11.5% | 44.7% | SP vs. Left (2016-17) | 0.362 | 0.349 | 32.8% | 7.9% | 19.8% | 40.5% | ||
| SP vs. Right (2016-17) | 0.308 | 0.299 | 32.6% | 5.6% | 18.9% | 51.8% | SP vs. Right (2016-17) | 0.313 | 0.326 | 32.2% | 8.7% | 20.6% | 36.9% | ||
Pitcher Grind Down
| Matt Garza | |||||||||
 | FanDuel | DraftKings | FantasyDraft | ||||||
| Salary: | $6,600 | Salary: | $7,000 | Salary: | |||||
| Salary Rank: | 17 of 30 | Salary Rank: | 14 of 30 | Salary Rank: | of 30 | ||||
| Stats | Starts | SIERA | ERA | K% | BB% | GB% | HC% | SC% | |
|---|---|---|---|---|---|---|---|---|---|
| 2016 | 19 | 4.60 | 4.51 | 15.2% | 7.8% | 54.8% | 34.9% | 19.0% | |
| 2017 | 19 | 5.19 | 4.81 | 15.4% | 8.3% | 41.3% | 34.6% | 16.6% | |
| L30 | 5 | 6.15 | 7.99 | 13.3% | 12.4% | 31.6% | 37.4% | 15.7% | |
Garza actually got off to a pretty good start this season. When you look at his numbers from the season as a whole, you can see that the good form is long gone. Over his last five starts, he has a 6.15 SIERA with a strikeout rate of 13% and a walk rate of 12%. He is a fly-ball pitcher that gives up a lot of hard contact. The good news for Garza is that he gets to face the Giants (dead last in team wOBA against right-handed pitching) in one of the most pitcher-friendly ballparks in baseball (AT&T Park). The bad news is that he is still Matt Garza and that the Giants have one of the lowest strikeout rates in baseball.
Quick Breakdown: Garza is a deep GPP flier thanks to a good matchup in a good ballpark. For cash games, play Bundy and/or Moore.
| Matt Moore | |||||||||
 | FanDuel | DraftKings | FantasyDraft | ||||||
| Salary: | $8,100 | Salary: | $7,900 | Salary: | |||||
| Salary Rank: | 9 of 30 | Salary Rank: | 10 of 30 | Salary Rank: | of 30 | ||||
| Stats | Starts | SIERA | ERA | K% | BB% | GB% | HC% | SC% | |
|---|---|---|---|---|---|---|---|---|---|
| 2016 | 33 | 4.39 | 4.08 | 21.2% | 8.6% | 38.2% | 30.8% | 15.3% | |
| 2017 | 25 | 4.78 | 5.54 | 19.3% | 8.4% | 37.2% | 34.3% | 16.3% | |
| L30 | 6 | 4.19 | 4.78 | 23.9% | 7.7% | 35.9% | 27.6% | 19.1% | |
Moore has taken a step back this season, which isn’t good considering the fact that his 2016 numbers weren’t very good to begin with. In 25 starts in 2017, Moore owns a 4.78 SIERA with a strikeout rate below 20%. He is also a fly-ball pitcher that gives up a lot of hard contact. While he will face a right-handed heavy Brewers’ lineup today, he does have decent strikeout potential in this matchup. On the season, Milwaukee has the second highest k-rate against left-handed pitching. Both of the pitchers in this game will likely give up runs (the total is set at 9.0), but Moore at least has the strikeout upside to make up for some of them.
Quick Breakdown: Moore is the preferred target over Matt Garza if you are looking for an SP2 on multi-pitcher sites.
Batter Grind Down
Milwaukee
It’s always hard to differentiate your lineups in smaller slates, especially if you want to play the popular pitchers. I never recommend this in bigger slates, but one way to get a unique roster is to take a hitter or two that is facing your pitcher. It allows you to play the chalky pitcher, while differentiating your lineup in the process. Since the start of last season, Matt Moore has allowed a .326 xwOBA and a 32%+ hard contact rate to both left and right-handed hitters. Domingo Santana, Ryan Braun, Jesus Aguilar, and Manny Pina are all intriguing plays in this small slate, even though this isn’t a great ballpark for offensive production.
Projected Lineup (Splits vs. LH Pitching)
| # | Player | Bats | wOBA | xwOBA | ISO | HC% | BB% | K% | GB% | FD Pos. | FD Sal. | DK Pos. | DK Sal. | FDRFT Pos. | FDRFT Sal. |
|---|---|---|---|---|---|---|---|---|---|---|---|---|---|---|---|
| 1 | Jonathan Villar | SWITCH | 0.228 | 0.219 | 0.102 | 27.7% | 8.3% | 31.5% | 62.5% | SS | $3,000 | 2B | $4,600 | N/A | N/A |
| 2 | Domingo Santana | RIGHT | 0.363 | 0.360 | 0.232 | 40.3% | 13.0% | 24.3% | 51.4% | OF | $3,500 | OF | $4,300 | N/A | N/A |
| 3 | Ryan Braun | RIGHT | 0.408 | 0.452 | 0.255 | 52.1% | 15.4% | 10.8% | 41.7% | OF | $4,400 | OF | $4,300 | N/A | N/A |
| 4 | Travis Shaw | LEFT | 0.322 | 0.267 | 0.225 | 31.0% | 5.5% | 28.2% | 40.8% | 3B | $3,300 | 3B | $4,200 | N/A | N/A |
| 5 | Jesus Aguilar | RIGHT | 0.375 | 0.339 | 0.205 | 49.0% | 9.8% | 30.5% | 40.8% | 1B | $2,900 | 1B | $4,000 | N/A | N/A |
| 6 | Manny Pina | RIGHT | 0.358 | 0.338 | 0.111 | 44.8% | 2.6% | 19.5% | 34.5% | C | $2,800 | C | $3,600 | N/A | N/A |
| 7 | Keon Broxton | RIGHT | 0.356 | 0.329 | 0.280 | 33.3% | 11.8% | 35.3% | 40.9% | OF | $3,200 | OF | $3,900 | N/A | N/A |
| 8 | Orlando Arcia | RIGHT | 0.302 | 0.261 | 0.080 | 26.8% | 9.4% | 16.7% | 50.0% | SS | $3,100 | SS | $3,400 | N/A | N/A |
| 9 | Matt Garza | RIGHT | 0.175 | 0.121 | 0.000 | 50.0% | 0.0% | 60.0% | 100.0% | P | $6,600 | P | $7,000 | N/A | N/A |
Elite Plays – None
Secondary Plays – Domingo Santana, Ryan Braun, Jesus Aguilar, Manny Pina
Stackability – ORANGE / YELLOW
San Francisco
The Giants have little to no firepower in their lineup right now, but they are a low-strikeout offense that is facing a low-strikeout pitcher in Matt Garza. At the very least, we can expect them to put the ball in play often, which generally results in runs when Garza is on the mound. In terms of splits, Garza has allowed a .354 xwOBA and a 37% hard contact rate to left-handed hitters in the last two seasons, while holding righties to a .299 xwOBA and a 33% hard contact rate. This typically wouldn’t be a spot to load up on the Giants, but we are forced to make strange decisions in two game slates.
Projected Lineup (Splits vs. RH Pitching)
| # | Player | Bats | wOBA | xwOBA | ISO | HC% | BB% | K% | GB% | FD Pos. | FD Sal. | DK Pos. | DK Sal. | FDRFT Pos. | FDRFT Sal. |
|---|---|---|---|---|---|---|---|---|---|---|---|---|---|---|---|
| 1 | Denard Span | LEFT | 0.346 | 0.335 | 0.185 | 26.1% | 6.5% | 11.5% | 39.0% | OF | $3,400 | OF | $3,900 | N/A | N/A |
| 2 | Kelby Tomlinson | RIGHT | 0.305 | 0.254 | 0.075 | 27.1% | 9.1% | 23.9% | 55.4% | 2B | $2,800 | 3B/SS | $3,500 | N/A | N/A |
| 3 | Jarrett Parker | LEFT | 0.306 | 0.282 | 0.156 | 21.4% | 5.9% | 32.4% | 47.6% | OF | $2,800 | OF | $3,700 | N/A | N/A |
| 4 | Buster Posey | RIGHT | 0.343 | 0.360 | 0.116 | 30.6% | 9.8% | 11.4% | 46.3% | C | $3,100 | 1B/C | $3,900 | N/A | N/A |
| 5 | Brandon Crawford | LEFT | 0.272 | 0.299 | 0.134 | 33.5% | 6.8% | 21.9% | 50.7% | SS | $2,900 | SS | $3,500 | N/A | N/A |
| 6 | Pablo Sandoval | SWITCH | 0.306 | 0.338 | 0.171 | 39.1% | 7.1% | 20.5% | 46.7% | 3B | $2,400 | 3B | $3,500 | N/A | N/A |
| 7 | Ryder Jones | LEFT | 0.270 | 0.262 | 0.175 | 32.6% | 4.8% | 22.6% | 37.2% | 1B | $2,600 | 1B/3B | $2,400 | N/A | N/A |
| 8 | Gorkys Hernandez | RIGHT | 0.299 | 0.273 | 0.063 | 24.6% | 8.6% | 20.2% | 52.3% | OF | $2,400 | OF | $3,000 | N/A | N/A |
| 9 | Matt Moore | LEFT | 0.120 | 0.140 | 0.000 | 12.0% | 2.6% | 33.3% | 65.0% | P | $8,100 | P | $7,900 | N/A | N/A |
Elite Plays – Denard Span, Jarrett Parker
Secondary Plays – Kelby Tomlinson, Buster Posey, Brandon Crawford, Ryder Jones
Stackability – YELLOW
LA Dodgers at Pittsburgh – 7:05 PM ET
| LA Dodgers | Pittsburgh | ||||||||||||||
 | Rich Hill |  | Trevor Williams | ||||||||||||
| LEFT | RIGHT | ||||||||||||||
| Vegas Moneyline | Vegas Over/Under | ||||||||||||||
| LAD-145 | 9.0 | ||||||||||||||
| Stats | wOBA | xwOBA | HC% | BB% | K% | GB% | Stats | wOBA | xwOBA | HC% | BB% | K% | GB% | ||
|---|---|---|---|---|---|---|---|---|---|---|---|---|---|---|---|
| SP vs. Left (2016-17) | 0.312 | 0.309 | 25.2% | 9.3% | 19.8% | 51.3% | SP vs. Left (2016-17) | 0.342 | 0.289 | 24.6% | 7.1% | 15.1% | 49.0% | ||
| SP vs. Right (2016-17) | 0.259 | 0.269 | 31.2% | 8.6% | 31.5% | 38.9% | SP vs. Right (2016-17) | 0.314 | 0.331 | 34.0% | 8.0% | 19.6% | 48.3% | ||
Pitcher Grind Down
| Rich Hill | |||||||||
 | FanDuel | DraftKings | FantasyDraft | ||||||
| Salary: | $8,800 | Salary: | $10,400 | Salary: | $20,000 | ||||
| Salary Rank: | 4 of 30 | Salary Rank: | 5 of 30 | Salary Rank: | 4 of 30 | ||||
| Stats | Starts | SIERA | ERA | K% | BB% | GB% | HC% | SC% | |
|---|---|---|---|---|---|---|---|---|---|
| 2016 | 20 | 3.29 | 2.12 | 29.4% | 7.5% | 45.3% | 28.3% | 22.3% | |
| 2017 | 18 | 3.93 | 3.54 | 28.4% | 10.2% | 37.9% | 31.5% | 22.1% | |
| L30 | 5 | 3.88 | 3.54 | 28.0% | 9.3% | 34.3% | 41.1% | 15.1% | |
Hill is one of four “aces” that we have on the mound tonight (and yes, I’m considering Zack Godley an ace). Of the four, I expect him to garner the lowest ownership, which makes him an intriguing tournament play right off the bat. He has been in very good form recently, posting a 3.88 SIERA with a strikeout rate of 28% in his last five starts. His curveball is one of the toughest to hit in baseball and he actually has a much higher strikeout rate against righties (32%) than he does against lefties (20%), so I don’t mind when he is facing a right-handed heavy lineup. The question here is whether or not he’s worth the price against a Pirates’ offense that doesn’t strikeout very often.
Quick Breakdown: Hill gets the green light in tournaments, but I will be leaning on the other three aces in my cash game lineups.
| Trevor Williams | |||||||||
 | FanDuel | DraftKings | FantasyDraft | ||||||
| Salary: | $6,400 | Salary: | $5,700 | Salary: | $11,200 | ||||
| Salary Rank: | 18 of 30 | Salary Rank: | 26 of 30 | Salary Rank: | 22 of 30 | ||||
| Stats | Starts | SIERA | ERA | K% | BB% | GB% | HC% | SC% | |
|---|---|---|---|---|---|---|---|---|---|
| 2016 | 1 | 4.28 | 7.82 | 18.0% | 8.2% | 45.5% | 31.1% | 17.8% | |
| 2017 | 19 | 4.61 | 4.71 | 17.5% | 7.5% | 49.0% | 29.3% | 24.3% | |
| L30 | 6 | 4.73 | 5.03 | 18.8% | 10.4% | 55.7% | 25.0% | 22.0% | |
The two rules that I have lived by this season in MLB DFS are as follows:
1. Don’t play pitchers in Coors Field.
2. Don’t play pitchers against the Dodgers.
There have been very few instances where following these rules has been to my detriment. Over the long run, avoiding both is your best bet. The Dodgers are one of the best offenses in baseball and they strikeout at a very low rate. Even when it looks like a pitcher is having a good outing against them (Gerrit Cole on Monday night), it can change in an instant. Williams doesn’t have the strikeout upside that I’m looking for in a pitcher and he’s listed as a sizable underdog at home.
Quick Breakdown: If you like to play below-average pitchers against elite offenses, be my guest.
Batter Grind Down
LA Dodgers
The Dodgers are an offense that should get overlooked in this slate. We will get to them eventually, but the Twins, Yankees, and Cubs are all going to be popular offenses to target. I’d like to say that we should load up on the Dodgers at low ownership, but I like the three offenses that I just mentioned a lot more. The Dodgers are playing in a pitcher-friendly ballpark against a ground-ball pitcher that induces a lot of soft and medium contact. Rather than stacking this offense, I will be looking to Chris Taylor, Corey Seager, and Justin Turner as one-off targets.
Projected Lineup (Splits vs. RH Pitching)
| # | Player | Bats | wOBA | xwOBA | ISO | HC% | BB% | K% | GB% | FD Pos. | FD Sal. | DK Pos. | DK Sal. | FDRFT Pos. | FDRFT Sal. |
|---|---|---|---|---|---|---|---|---|---|---|---|---|---|---|---|
| 1 | Chris Taylor | RIGHT | 0.397 | 0.350 | 0.248 | 36.8% | 9.9% | 26.2% | 40.4% | OF | $3,800 | 2B/OF | $4,600 | 2B | $9,000 |
| 2 | Corey Seager | LEFT | 0.371 | 0.395 | 0.191 | 47.6% | 14.0% | 21.3% | 41.5% | SS | $3,700 | SS | $4,400 | SS | $8,700 |
| 3 | Justin Turner | RIGHT | 0.369 | 0.382 | 0.146 | 34.9% | 10.9% | 10.1% | 29.9% | 3B | $3,800 | 3B | $4,400 | 3B | $8,700 |
| 4 | Curtis Granderson | LEFT | 0.354 | 0.348 | 0.270 | 34.8% | 14.7% | 22.1% | 29.0% | OF | $3,600 | OF | $4,900 | CF | $9,600 |
| 5 | Yasmani Grandal | SWITCH | 0.343 | 0.296 | 0.234 | 36.7% | 6.7% | 26.3% | 40.5% | C | $3,200 | C | $3,900 | C | $7,600 |
| 6 | Yasiel Puig | RIGHT | 0.369 | 0.354 | 0.257 | 36.1% | 9.6% | 19.9% | 46.3% | OF | $2,900 | OF | $3,700 | RF | $7,200 |
| 7 | Adrian Gonzalez | LEFT | 0.283 | 0.307 | 0.104 | 33.9% | 6.7% | 16.0% | 34.8% | 1B | $2,400 | 1B | $3,200 | 1B | $6,300 |
| 8 | Logan Forsythe | RIGHT | 0.266 | 0.293 | 0.041 | 29.8% | 14.1% | 26.7% | 47.9% | 2B | $2,900 | 2B/3B | $3,600 | 2B | $7,200 |
| 9 | Rich Hill | LEFT | 0.084 | 0.124 | 0.000 | 16.7% | 0.0% | 35.0% | 77.8% | P | $8,800 | P | $10,400 | P | $20,000 |
Elite Plays – Corey Seager
Secondary Plays – Chris Taylor, Justin Turner, Yasmani Grandal, Yasiel Puig (GPP)
Stackability – YELLOW
Pittsburgh
The Pirates are a below-average offense against left-handed pitching this season and they draw one of the worst matchups in the slate. In addition to his elite strikeout rate, Rich Hill has held both left and right-handed hitters under a .310 xwOBA and under a 32% hard contact rate over the last two seasons. The Pirates are an easy fade as a whole, but Andrew McCutchen deserves a look as a deep tournament flier. He currently boasts a .433 xwOBA and a .446 ISO against left-handed pitching.
Projected Lineup (Splits vs. LH Pitching)
| # | Player | Bats | wOBA | xwOBA | ISO | HC% | BB% | K% | GB% | FD Pos. | FD Sal. | DK Pos. | DK Sal. | FDRFT Pos. | FDRFT Sal. |
|---|---|---|---|---|---|---|---|---|---|---|---|---|---|---|---|
| 1 | Starling Marte | RIGHT | 0.196 | 0.247 | 0.043 | 25.7% | 6.0% | 24.0% | 47.1% | OF | $3,600 | OF | $4,400 | CF | $8,400 |
| 2 | Josh Harrison | RIGHT | 0.356 | 0.303 | 0.163 | 29.6% | 8.0% | 15.0% | 41.8% | 2B | $3,400 | 2B/3B | $3,800 | 2B | $7,500 |
| 3 | Andrew McCutchen | RIGHT | 0.495 | 0.433 | 0.446 | 45.5% | 17.9% | 13.4% | 31.2% | OF | $3,400 | OF | $3,900 | RF | $7,800 |
| 4 | David Freese | RIGHT | 0.390 | 0.388 | 0.154 | 39.7% | 17.5% | 21.6% | 56.9% | 3B | $2,800 | 3B | $3,200 | 3B | $6,300 |
| 5 | Jose Osuna | RIGHT | 0.343 | 0.297 | 0.198 | 30.0% | 6.9% | 12.6% | 51.4% | OF | $2,700 | 1B/OF | $3,500 | IF/OF | $6,900 |
| 6 | Sean Rodriguez | RIGHT | 0.466 | 0.402 | 0.292 | 50.0% | 21.9% | 25.0% | 18.8% | OF | $2,600 | 3B/OF | $2,100 | 2B | $4,000 |
| 7 | Jordy Mercer | RIGHT | 0.282 | 0.297 | 0.158 | 39.0% | 10.3% | 17.8% | 51.3% | SS | $2,100 | SS | $2,700 | SS | $5,200 |
| 8 | Chris Stewart | RIGHT | 0.136 | 0.212 | 0.091 | 26.3% | 4.3% | 13.0% | 63.2% | C | $2,000 | C | $2,000 | C | $4,000 |
| 9 | Trevor Williams | RIGHT | 0.000 | 0.101 | 0.000 | 0.0% | 0.0% | 33.3% | 50.0% | P | $6,400 | P | $5,700 | P | $11,200 |
Elite Plays – None
Secondary Plays – Andrew McCutchen (GPP)
Stackability – RED
Miami at Philadelphia – 7:05 PM ET
| Miami | Philadelphia | ||||||||||||||
 | Justin Nicolino |  | Mark Leiter Jr. | ||||||||||||
| LEFT | RIGHT | ||||||||||||||
| Vegas Moneyline | Vegas Over/Under | ||||||||||||||
| MIA-121 | 10.0 | ||||||||||||||
| Stats | wOBA | xwOBA | HC% | BB% | K% | GB% | Stats | wOBA | xwOBA | HC% | BB% | K% | GB% | ||
|---|---|---|---|---|---|---|---|---|---|---|---|---|---|---|---|
| SP vs. Left (2016-17) | 0.349 | 0.335 | 25.7% | 1.6% | 11.0% | 55.7% | SP vs. Left (2016-17) | 0.342 | 0.346 | 27.8% | 7.8% | 20.6% | 40.3% | ||
| SP vs. Right (2016-17) | 0.348 | 0.367 | 34.7% | 8.3% | 11.0% | 43.3% | SP vs. Right (2016-17) | 0.310 | 0.332 | 29.1% | 11.5% | 20.5% | 53.2% | ||
Pitcher Grind Down
| Justin Nicolino | |||||||||
 | FanDuel | DraftKings | FantasyDraft | ||||||
| Salary: | $5,500 | Salary: | $6,200 | Salary: | $12,400 | ||||
| Salary Rank: | 30 of 30 | Salary Rank: | 21 of 30 | Salary Rank: | 17 of 30 | ||||
| Stats | Starts | SIERA | ERA | K% | BB% | GB% | HC% | SC% | |
|---|---|---|---|---|---|---|---|---|---|
| 2016 | 13 | 5.11 | 4.99 | 10.7% | 5.8% | 46.6% | 32.9% | 15.4% | |
| 2017 | 7 | 5.39 | 4.11 | 11.8% | 8.3% | 46.8% | 30.7% | 12.3% | |
| L30 | 2 | 6.21 | 1.74 | 6.5% | 8.7% | 43.6% | 38.5% | 15.4% | |
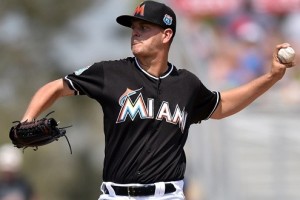
There were a lot of runs scored in the two games played in this ballpark yesterday. While we don’t have another double-header on our hands, we do have two hittable pitchers. In seven starts this season, Nicolino has a 5.39 SIERA with a strikeout rate of only 12%. He doesn’t have a high enough ground ball rate to stay out of trouble in this home run-friendly ballpark. Even though we generally like to pick on the Phillies, this is a rare opportunity to target their hitters in DFS.
Quick Breakdown: Any pitcher with a strikeout rate of 12% is an auto-fade, especially in this ballpark.
| Mark Leiter Jr. | |||||||||
 | FanDuel | DraftKings | FantasyDraft | ||||||
| Salary: | $6,200 | Salary: | $7,100 | Salary: | $14,000 | ||||
| Salary Rank: | 22 of 30 | Salary Rank: | 13 of 30 | Salary Rank: | 10 of 30 | ||||
| Stats | Starts | SIERA | ERA | K% | BB% | GB% | HC% | SC% | |
|---|---|---|---|---|---|---|---|---|---|
| 2017 | 4 | 4.42 | 4.38 | 20.5% | 9.8% | 47.0% | 28.5% | 21.2% | |
| L30 | 1 | 3.06 | 4.70 | 26.9% | 4.5% | 42.9% | 37.2% | 18.6% | |
Leiter has flashed some upside in his rookie season, but his best outings have all come as a reliever. He hasn’t had nearly as much success starting the game as he has had coming out of the bullpen. Vegas doesn’t seem too impressed, as the Marlins are small favorites in a game that features a total of 10.0 runs. The Marlins aren’t the best offense in baseball, but they are always dangerous when Giancarlo Stanton is swinging the bat well.
Quick Breakdown: As an underdog at home in a game that features a high total, Leiter is an easy fade in all formats.
Batter Grind Down
Miami
The Marlins are one of the sneakier stacks in the slate. As I mentioned in the previous game, most of the attention will be on the Twins, Yankees, and Cubs tonight. Meanwhile, we can take the Marlins at low ownership in a home run-friendly ballpark. The sample size is small (four starts and some relief work), but Mark Leiter Jr. has allowed a .346 xwOBA to left-handed hitters and a .332 xwOBA to right-handed hitters in his rookie season. Giancarlo Stanton is one of the top overall plays in the slate and the one through five stack is viable in tournaments.
Projected Lineup (Splits vs. RH Pitching)
| # | Player | Bats | wOBA | xwOBA | ISO | HC% | BB% | K% | GB% | FD Pos. | FD Sal. | DK Pos. | DK Sal. | FDRFT Pos. | FDRFT Sal. |
|---|---|---|---|---|---|---|---|---|---|---|---|---|---|---|---|
| 1 | Dee Gordon | LEFT | 0.310 | 0.260 | 0.072 | 18.6% | 5.0% | 13.5% | 55.6% | 2B | $3,200 | 2B | $4,300 | 2B | $8,400 |
| 2 | Giancarlo Stanton | RIGHT | 0.412 | 0.403 | 0.345 | 38.6% | 11.0% | 25.1% | 41.8% | OF | $5,100 | OF | $5,700 | RF | $11,200 |
| 3 | Christian Yelich | LEFT | 0.340 | 0.357 | 0.146 | 38.2% | 12.9% | 20.4% | 56.0% | OF | $3,200 | OF | $4,400 | CF | $8,700 |
| 4 | Marcell Ozuna | RIGHT | 0.392 | 0.372 | 0.264 | 42.1% | 9.0% | 21.7% | 44.6% | OF | $3,800 | OF | $4,600 | LF | $8,800 |
| 5 | J.T. Realmuto | RIGHT | 0.326 | 0.330 | 0.155 | 31.8% | 5.7% | 17.5% | 50.8% | C | $2,800 | C | $3,700 | C | $7,200 |
| 6 | Derek Dietrich | LEFT | 0.304 | 0.309 | 0.166 | 34.8% | 7.7% | 19.2% | 33.8% | 3B | $3,100 | 3B | $3,500 | 3B | $6,900 |
| 7 | Tomas Telis | SWITCH | 0.337 | 0.320 | 0.139 | 39.4% | 2.6% | 7.9% | 48.5% | 1B | $2,100 | 1B | $3,000 | C | $6,000 |
| 8 | Miguel Rojas | RIGHT | 0.291 | 0.309 | 0.027 | 18.0% | 8.1% | 9.8% | 48.0% | SS | $2,200 | SS | $2,500 | 2B | $4,800 |
| 9 | Justin Nicolino | LEFT | 0.000 | 0.113 | 0.000 | 0.0% | 0.0% | 0.0% | 66.7% | P | $5,500 | P | $6,200 | P | $12,400 |
Elite Plays – Giancarlo Stanton
Secondary Plays – Dee Gordon, Christian Yelich, Marcell Ozuna, J.T. Realmuto
Stackability – YELLOW / GREEN
Philadelphia
Before you close out of your browser, hear me out. The Phillies stack is in play for me tonight on DraftKings. Before you ask, no, I’m not off my medication. In fact, I’m not on any medication to be off of. Anyway, let me explain. Luis Severino and Corey Kluber are the top two pitching options in the slate. Due to their hefty salaries, nobody is going to play them both in the same lineup. If you want to create a unique tournament team, you can stack five Phillies with that pitching duo and still have over $3,000 to spend on your remaining three position players. Just to be clear, the Phillies are facing a low-strikeout lefty in a home run-friendly ballpark.
Projected Lineup (Splits vs. LH Pitching)
| # | Player | Bats | wOBA | xwOBA | ISO | HC% | BB% | K% | GB% | FD Pos. | FD Sal. | DK Pos. | DK Sal. | FDRFT Pos. | FDRFT Sal. |
|---|---|---|---|---|---|---|---|---|---|---|---|---|---|---|---|
| 1 | Cesar Hernandez | SWITCH | 0.309 | 0.317 | 0.161 | 24.8% | 6.3% | 13.4% | 58.9% | 2B | $2,900 | 2B | $3,300 | 2B | $6,600 |
| 2 | Freddy Galvis | SWITCH | 0.285 | 0.255 | 0.119 | 22.4% | 2.6% | 11.5% | 38.6% | SS | $3,300 | SS | $3,700 | SS | $7,200 |
| 3 | Rhys Hoskins | RIGHT | 0.506 | 0.525 | 0.643 | 53.9% | 25.0% | 5.0% | 23.1% | OF | $3,100 | 1B | $3,800 | 1B | $7,600 |
| 4 | Maikel Franco | RIGHT | 0.293 | 0.306 | 0.198 | 33.0% | 8.5% | 13.2% | 49.0% | 3B | $2,500 | 3B | $3,000 | 3B | $6,000 |
| 5 | Nick Williams | LEFT | 0.356 | 0.293 | 0.200 | 21.4% | 6.7% | 26.7% | 64.3% | OF | $3,000 | OF | $3,500 | LF | $6,900 |
| 6 | Tommy Joseph | RIGHT | 0.289 | 0.313 | 0.231 | 27.5% | 10.7% | 23.8% | 43.8% | 1B | $2,100 | 1B | $2,500 | 1B | $4,800 |
| 7 | Jorge Alfaro | RIGHT | 0.438 | 0.349 | 0.000 | 0.0% | 0.0% | 16.7% | 40.0% | C | $2,100 | C | $2,900 | C | $5,700 |
| 8 | Cameron Perkins | RIGHT | 0.250 | 0.248 | 0.056 | 23.3% | 7.1% | 19.0% | 50.0% | OF | $2,200 | OF | $2,300 | CF | $4,400 |
| 9 | Mark Leiter Jr. | RIGHT | 0.219 | 0.049 | 0.000 | 0.0% | 0.0% | 50.0% | 100.0% | P | $6,200 | P | $7,100 | P | $14,000 |
Elite Plays – None
Secondary Plays – Cesar Hernandez, Freddy Galvis, Rhys Hoskins, Maikel Franco, Nick Williams, Tommy Joseph, Jorge Alfaro
Stackability – YELLOW
Arizona at NY Mets – 7:10 PM ET
| Arizona | NY Mets | ||||||||||||||
 | Zack Godley |  | Chris Flexen | ||||||||||||
| RIGHT | RIGHT | ||||||||||||||
| Vegas Moneyline | Vegas Over/Under | ||||||||||||||
| ARI-150 | 9.0 | ||||||||||||||
| Stats | wOBA | xwOBA | HC% | BB% | K% | GB% | Stats | wOBA | xwOBA | HC% | BB% | K% | GB% | ||
|---|---|---|---|---|---|---|---|---|---|---|---|---|---|---|---|
| SP vs. Left (2016-17) | 0.317 | 0.305 | 25.9% | 9.7% | 24.0% | 58.0% | SP vs. Left (2016-17) | 0.381 | 0.392 | 27.3% | 16.7% | 12.5% | 28.1% | ||
| SP vs. Right (2016-17) | 0.308 | 0.308 | 34.7% | 6.1% | 21.8% | 51.4% | SP vs. Right (2016-17) | 0.455 | 0.351 | 34.2% | 13.8% | 13.8% | 48.8% | ||
Pitcher Grind Down
| Zack Godley | |||||||||
 | FanDuel | DraftKings | FantasyDraft | ||||||
| Salary: | $8,800 | Salary: | $9,700 | Salary: | $18,800 | ||||
| Salary Rank: | 4 of 30 | Salary Rank: | 6 of 30 | Salary Rank: | 5 of 30 | ||||
| Stats | Starts | SIERA | ERA | K% | BB% | GB% | HC% | SC% | |
|---|---|---|---|---|---|---|---|---|---|
| 2016 | 9 | 4.16 | 6.39 | 17.9% | 7.5% | 53.8% | 32.1% | 17.9% | |
| 2017 | 18 | 3.59 | 3.13 | 26.6% | 8.0% | 54.9% | 29.5% | 19.8% | |
| L30 | 6 | 3.53 | 3.22 | 29.6% | 9.2% | 50.6% | 28.3% | 18.5% | |
Dollar for dollar, Godley is my favorite pitching option in the slate tonight. That goes for both cash games and tournaments. The natural inclination is to spend up at pitcher in cash games, so I don’t expect his ownership to be too outrageous. He has been solid all season, posting a 3.59 SIERA with a strikeout rate of 27% and a walk rate of 55%. He keeps hard contact under control and he has a great offense to provide him run support. While the Mets have decent numbers against right-handed pitching on the season, this isn’t the same lineup as earlier in the year. Not only that, but the Mets have already mailed their season in. At this point, there is no chance of that mail being labeled “return to sender.”
Quick Breakdown: Godley has been my go-to pitcher often this season and that continues tonight against the Mets.
| Chris Flexen | |||||||||
 | FanDuel | DraftKings | FantasyDraft | ||||||
| Salary: | $5,600 | Salary: | $5,200 | Salary: | $10,200 | ||||
| Salary Rank: | 29 of 30 | Salary Rank: | 30 of 30 | Salary Rank: | 26 of 30 | ||||
| Stats | Starts | SIERA | ERA | K% | BB% | GB% | HC% | SC% | |
|---|---|---|---|---|---|---|---|---|---|
| 2017 | 5 | 6.48 | 6.55 | 13.2% | 15.1% | 39.7% | 31.1% | 28.4% | |
| L30 | 5 | 6.48 | 6.55 | 13.2% | 15.1% | 39.7% | 31.1% | 28.4% | |
Flexen is quickly finding out that the major leagues are a tad bit tougher than Double-A. When the Mets called him up to the big leagues, he skipped right over Triple-A ball. His first five starts have gone the way most of us expected. He currently owns a 6.48 SIERA with a strikeout rate of 13% and a walk rate of 15%. A major league career could certainly be in his future, but he’s not fit for the job just yet. As long as the Mets keep throwing him out there, I will keep throwing out stacks against him.
Quick Breakdown: Flexen isn’t ready for the big leagues. It’s a hard balance between giving him experience and shattering his confidence.
Batter Grind Down
Arizona
The Diamondbacks are similar to the Marlins in that they should be under 10% owned tonight, even though they have the potential to be the highest scoring offense in the slate. They are facing a rookie pitcher that has a higher walk rate than strikeout rate. In his first five starts, Chris Flexen has allowed a .392 xwOBA to left-handed hitters and a .351 xwOBA to right-handed hitters. This is not only a great matchup for Arizona, but they are playing on the road, which guarantees ninth inning at-bats.
Projected Lineup (Splits vs. RH Pitching)
| # | Player | Bats | wOBA | xwOBA | ISO | HC% | BB% | K% | GB% | FD Pos. | FD Sal. | DK Pos. | DK Sal. | FDRFT Pos. | FDRFT Sal. |
|---|---|---|---|---|---|---|---|---|---|---|---|---|---|---|---|
| 1 | David Peralta | LEFT | 0.365 | 0.319 | 0.180 | 35.6% | 7.1% | 14.7% | 53.0% | OF | $3,400 | OF | $4,100 | RF | $8,000 |
| 2 | A.J. Pollock | RIGHT | 0.328 | 0.311 | 0.153 | 38.9% | 6.8% | 20.8% | 44.6% | OF | $3,400 | OF | $4,600 | CF | $9,000 |
| 3 | Jake Lamb | LEFT | 0.404 | 0.381 | 0.285 | 37.0% | 14.2% | 21.5% | 39.4% | 3B | $3,700 | 3B | $4,900 | 3B | $9,600 |
| 4 | Paul Goldschmidt | RIGHT | 0.430 | 0.399 | 0.291 | 43.3% | 14.4% | 23.1% | 45.7% | 1B | $4,000 | 1B | $5,500 | 1B | $10,800 |
| 5 | J.D. Martinez | RIGHT | 0.357 | 0.375 | 0.281 | 41.9% | 11.5% | 26.4% | 42.5% | OF | $3,900 | OF | $5,100 | RF | $9,900 |
| 6 | Daniel Descalso | LEFT | 0.335 | 0.322 | 0.171 | 41.2% | 11.8% | 22.7% | 37.3% | 2B | $2,300 | 2B/OF | $3,100 | 2B | $6,000 |
| 7 | Chris Iannetta | RIGHT | 0.318 | 0.299 | 0.252 | 39.2% | 10.3% | 36.8% | 35.4% | C | $2,300 | C | $3,300 | C | $6,400 |
| 8 | Ketel Marte | SWITCH | 0.328 | 0.317 | 0.169 | 24.6% | 8.6% | 20.4% | 36.5% | SS | $2,600 | SS | $3,000 | SS | $6,000 |
| 9 | Zack Godley | RIGHT | 0.063 | 0.078 | 0.000 | 7.7% | 3.4% | 51.7% | 55.6% | P | $8,800 | P | $9,700 | P | $18,800 |
Elite Plays – David Peralta, Jake Lamb, Paul Goldschmidt, J.D. Martinez
Secondary Plays – A.J. Pollock, Daniel Descalso
Stackability – YELLOW / GREEN
NY Mets
The Mets used to be an offense that we were scared to target pitchers against, but their current lineup only has one batter with an xwOBA over .340 against right-handed pitching this season. Zack Godley has an above-average strikeout rate and an above-average ground ball rate. He has also held both left and right-handed hitters under a .310 xwOBA in the last two seasons. With so many Godley shares in my lineups tonight, I will naturally be fading the Mets as a whole.
Projected Lineup (Splits vs. RH Pitching)
| # | Player | Bats | wOBA | xwOBA | ISO | HC% | BB% | K% | GB% | FD Pos. | FD Sal. | DK Pos. | DK Sal. | FDRFT Pos. | FDRFT Sal. |
|---|---|---|---|---|---|---|---|---|---|---|---|---|---|---|---|
| 1 | Brandon Nimmo | LEFT | 0.310 | 0.338 | 0.029 | 39.1% | 15.0% | 27.5% | 34.8% | OF | $2,300 | OF | $2,600 | LF | $5,100 |
| 2 | Asdrubal Cabrera | SWITCH | 0.299 | 0.336 | 0.151 | 36.3% | 9.6% | 15.7% | 42.3% | 3B | $2,400 | 2B/SS | $3,000 | SS | $6,000 |
| 3 | Michael Conforto | LEFT | 0.412 | 0.389 | 0.288 | 39.9% | 14.6% | 22.0% | 37.4% | OF | $4,000 | OF | $4,200 | LF | $8,000 |
| 4 | Yoenis Cespedes | RIGHT | 0.355 | 0.334 | 0.220 | 40.7% | 6.3% | 17.6% | 37.1% | OF | $3,700 | OF | $4,000 | LF | $7,800 |
| 5 | Wilmer Flores | RIGHT | 0.339 | 0.329 | 0.195 | 34.9% | 7.0% | 14.6% | 36.7% | 2B | $3,100 | 1B/3B | $3,300 | 3B | $6,400 |
| 6 | Dominic Smith | LEFT | 0.269 | 0.298 | 0.231 | 27.3% | 3.7% | 14.8% | 59.1% | 1B | $2,300 | 1B | $2,700 | 1B | $5,400 |
| 7 | Amed Rosario | RIGHT | 0.263 | 0.220 | 0.163 | 25.0% | 0.0% | 34.0% | 53.1% | SS | $2,300 | SS | $2,800 | SS | $5,400 |
| 8 | Travis d’Arnaud | RIGHT | 0.248 | 0.286 | 0.150 | 34.2% | 3.9% | 16.7% | 40.4% | C | $2,400 | C | $2,800 | C | $5,400 |
| 9 | Chris Flexen | RIGHT | 0.205 | 0.121 | 0.167 | 50.0% | 0.0% | 66.7% | 50.0% | P | $5,600 | P | $5,200 | P | $10,200 |