MLB Grind Down: Wednesday, July 27th
The RotoGrinders MLB Grind Down will give you an in-depth analysis into the upcoming MLB schedule. This article will break down the numbers for every single game and give you analysis on which trends you can exploit. While matchups are a major factor in daily fantasy baseball, there are plenty of other factors to consider such as injuries, weather, and salaries.
The analysis should point you in the right direction, but it is still up to you to decipher the information and make your own selections. No sport has more variance than baseball. The best choice is not always the right choice but following the trends will win you money over time.
Note: As always, if you want to try a new DFS site, be sure to click through a RotoGrinders link and use our DraftKings promo code and FanDuel promo code to receive the best perks in the industry.
Stackability Rating System:
GREEN – One of the top stacks of the day, viable in cash games and GPPs
YELLOW – A viable stack option in most formats, specifically GPPs
ORANGE – There are better stacks out there, but playable in large GPPs
RED – Not a recommended stack for cash games or GPPs
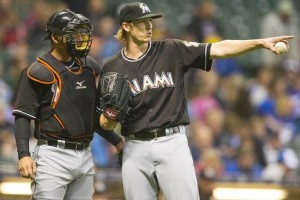
Philadelphia at Miami – 12:10 PM ET
| Philadelphia | Miami |
 | |  | |
| RIGHT | LEFT |
| Vegas Moneyline | Vegas Over/Under |
| MIA -180 | 7.5 |
| Stats | wOBA | HR All. | K% | BB% | Stats | wOBA | HR All. | K% | BB% |
| SP vs. Left | 0.304 | 4 | 7.0% | 5.8% | SP vs. Left | 0.327 | 1 | 17.5% | 9.1% |
| SP vs. Right | 0.328 | 2 | 15.9% | 3.4% | SP vs. Right | 0.303 | 16 | 23.4% | 8.7% |
Pitcher Grind Down
| Zach Eflin |
 | FanDuel | DraftKings |
| Salary: | $6,300 | Salary: | $7,200 |
| FPPG: | 26.0 | FPPG: | 14.3 |
| Pitcher Rating: | 33.0 | Pitcher Rank: | 29 |
| Statistics | Starts | PitchPS | SIERA | ERA | K% | BB% | SS% | GB% | FB% | HH% |
| L30 Days | 5 | 93.6 | 4.97 | 2.45 | 11.5% | 3.1% | 6.4% | 39.1% | 37.3% | 27.0% |
| 2016 | 7 | 90.4 | 5.17 | 4.14 | 11.5% | 4.6% | 6.3% | 37.9% | 39.3% | 30.1% |
We have a nice split-slate on tap today. There are six early games and nine late games, so if you feel like getting nothing done at work today, join both the early and the main slates. Eflin will take the mound for the Phillies in what will be his eighth career major league start. The first seven haven’t exactly gone as planned, as he owns a 5.17 SIERA with a strikeout rate of only 11.5%. Until he can show more upside, he can be avoided in DFS.
| Adam Conley |
 | FanDuel | DraftKings |
| Salary: | $8,600 | Salary: | $9,000 |
| FPPG: | 29.5 | FPPG: | 15.3 |
| Pitcher Rating: | 73.4 | Pitcher Rank: | 11 |
| Statistics | Starts | PitchPS | SIERA | ERA | K% | BB% | SS% | GB% | FB% | HH% |
| L30 Days | 5 | 95.2 | 3.80 | 2.76 | 26.1% | 7.6% | 10.9% | 33.8% | 50.0% | 35.5% |
| 2016 | 19 | 93.0 | 4.30 | 3.61 | 22.9% | 9.6% | 9.9% | 38.2% | 41.7% | 29.7% |
| 2015 | 11 | 100.2 | 3.98 | 3.76 | 21.0% | 7.5% | 10.1% | 40.6% | 40.6% | 21.7% |
Conley is an interesting GPP play in the early slate of games. figures to be the chalk and looks like the go-to SP2. Conley should fly under the radar despite a 22.9% strikeout rate and arguably the best matchup on the board. The Phillies are currently ranked 26th or worse in team wOBA (.278), team ISO, (.114), and team strikeout rate (23.5%) against left-handed pitching this season.
Batter Grind Down
Philadelphia
As mentioned above, the Phillies have not fared well against left-handed pitching this season. They are ranked 26th or worse in all six of the offensive statistics listed below. They come into this game with the third lowest run projection of the 30 teams in action today. and aren’t the worst plays on the board, but there are better options at their respective positions.
- Phillies Offense (2016)
Team wOBA vs. LHP — 0.278 (30 of 30)
Team ISO vs. LHP — 0.114 (29 of 30)
Team K% vs. LHP — 23.5% (26 of 30)
Pitches Per PA vs. LHP — 3.71 (30 of 30)
Runs Per Game — 3.57 (29 of 30)
Projected Run Total — 3.29 (28 of 30)
Projected Lineup
| # | Player | Bats | wOBA vs. LHP | ISO vs. LHP | wOBA L14 | FD Position | FD Salary | DK Position | DK Salary |
| 1 | | SWITCH | 0.321 | 0.065 | 0.286 | 2B | $3,200 | 2B | $2,900 |
| 2 | | LEFT | 0.295 | 0.069 | 0.284 | OF | $4,100 | OF | $3,600 |
| 3 | | RIGHT | 0.341 | 0.224 | 0.209 | 3B | $3,300 | 3B | $3,100 |
| 4 | | RIGHT | 0.427 | 0.313 | 0.430 | 1B | $2,700 | 1B | $3,600 |
| 5 | | RIGHT | 0.408 | 0.283 | 0.285 | C | $3,100 | C | $3,200 |
| 6 | | RIGHT | 0.210 | 0.095 | 0.362 | OF | $2,700 | OF | $2,500 |
| 7 | | RIGHT | 0.266 | 0.065 | | SS | $2,000 | 2B/SS | $2,300 |
| 8 | | SWITCH | 0.254 | 0.067 | 0.000 | OF | $2,000 | OF | $2,400 |
| 9 | | RIGHT | 0.000 | 0.000 | 0.176 | P | $6,300 | P | $7,200 |
| | Team Averages | — | 0.280 | 0.131 | 0.254 | — | — | — | — |
Elite Plays – NONE
Secondary Plays – ,
Stackability – ORANGE
Miami
The Marlins draw a favorable matchup against the rookie , who hasn’t shown a lot of strikeout upside in the majors. Miami should be able to make contact today, the question is whether or not it will be hard contact. The sample size is small, but Eflin has allowed a .304 wOBA to left-handed hitters and a .328 wOBA to right-handed hitters this season.
- Marlins Offense (2016)
Team wOBA vs. RHP — 0.319 (11 of 30)
Team ISO vs. RHP — 0.135 (28 of 30)
Team K% vs. RHP — 19.1% (6 of 30)
Pitches Per PA vs. RHP — 3.83 (22 of 30)
Runs Per Game — 4.17 (21 of 30)
Projected Run Total — 4.21 (14 of 30)
Projected Lineup
| # | Player | Bats | wOBA vs. RHP | ISO vs. RHP | wOBA L14 | FD Position | FD Salary | DK Position | DK Salary |
| 1 | | RIGHT | 0.315 | 0.122 | 0.241 | C | $2,900 | C | $3,700 |
| 2 | | RIGHT | 0.303 | 0.089 | 0.316 | 3B | $3,100 | 3B | $3,200 |
| 3 | | LEFT | 0.376 | 0.165 | 0.426 | OF | $3,800 | OF | $5,200 |
| 4 | | RIGHT | 0.352 | 0.255 | 0.350 | OF | $3,500 | OF | $3,600 |
| 5 | | RIGHT | 0.306 | 0.140 | 0.227 | OF | $2,900 | OF | $3,300 |
| 6 | | LEFT | 0.363 | 0.178 | 0.147 | 2B | $2,700 | 2B | $2,800 |
| 7 | | RIGHT | 0.294 | 0.075 | 0.340 | SS | $2,000 | 2B/SS | $2,600 |
| 8 | | RIGHT | 0.274 | 0.086 | 0.312 | SS | $2,000 | SS | $2,700 |
| 9 | | LEFT | 0.100 | 0.000 | 0.000 | P | $8,600 | P | $9,000 |
| | Team Averages | — | 0.298 | 0.123 | 0.262 | — | — | — | — |
Elite Plays –
Secondary Plays – ,
Stackability – ORANGE / YELLOW
Washington at Cleveland – 12:10 PM ET
| Washington | Cleveland |
 | |  | |
| RIGHT | RIGHT |
| Vegas Moneyline | Vegas Over/Under |
| CLE -110 | 7.0 |
| Stats | wOBA | HR All. | K% | BB% | Stats | wOBA | HR All. | K% | BB% |
| SP vs. Left | 0.251 | 12 | 31.4% | 7.5% | SP vs. Left | 0.278 | 15 | 27.5% | 7.3% |
| SP vs. Right | 0.291 | 15 | 29.4% | 4.6% | SP vs. Right | 0.281 | 15 | 28.1% | 5.3% |
Pitcher Grind Down
| Stephen Strasburg |
 | FanDuel | DraftKings |
| Salary: | $10,900 | Salary: | $10,600 |
| FPPG: | 47.1 | FPPG: | 24.7 |
| Pitcher Rating: | 84.7 | Pitcher Rank: | 4 |
| Statistics | Starts | PitchPS | SIERA | ERA | K% | BB% | SS% | GB% | FB% | HH% |
| L30 Days | 4 | 106.3 | 3.64 | 2.60 | 28.9% | 9.6% | 9.7% | 37.5% | 42.2% | 25.0% |
| 2016 | 18 | 104.0 | 3.08 | 2.83 | 31.2% | 7.2% | 11.1% | 42.5% | 37.2% | 25.5% |
| 2015 | 23 | 88.8 | 2.76 | 3.46 | 29.6% | 5.0% | 11.2% | 42.2% | 34.3% | 28.9% |
Strasburg was rocked by the Dodgers in his last start (mainly by ), but he still managed to strikeout ten batters. He has an incredibly high floor thanks to his ability to rack up k’s against his opponents. While Strasburg can dominate any lineup in any ballpark, I’m not a huge fan of paying up for him today. He draws a difficult matchup against the Indians and he has to face them on the road in an American League ballpark. I’ll gladly take extra shares of Mad-Bum and fade Strasburg today.
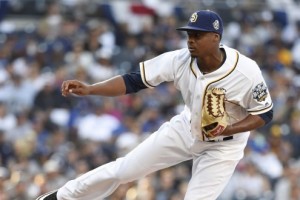
| Carlos Carrasco |
 | FanDuel | DraftKings |
| Salary: | $10,100 | Salary: | $9,200 |
| FPPG: | 37.0 | FPPG: | 20.7 |
| Pitcher Rating: | 85.2 | Pitcher Rank: | 3 |
| Statistics | Starts | PitchPS | SIERA | ERA | K% | BB% | SS% | GB% | FB% | HH% |
| L30 Days | 6 | 96.3 | 3.56 | 1.16 | 26.5% | 7.5% | 11.8% | 50.0% | 39.6% | 28.1% |
| 2016 | 14 | 90.9 | 3.66 | 2.31 | 24.0% | 6.8% | 11.7% | 50.7% | 32.8% | 34.2% |
| 2015 | 30 | 92.6 | 2.74 | 3.63 | 29.6% | 5.9% | 14.0% | 51.2% | 29.8% | 27.5% |
Carrasco has been dominant this season, posting a 3.66 SIERA (2.31 ERA) with a strikeout rate of 24% and a walk rate of 6.8%. He induces a lot of ground balls and he gets a lot of strikeouts – two things that I love seeing from a pitcher in DFS. He draws a mediocre matchup today against the Nationals, who are ranked right around the major league average in team wOBA (.314) and team ISO (.168) against right-handed pitching. The main concern here is run support.
Batter Grind Down
Washington
This should be a fun game to watch, but not one that I will be heavily targeting in DFS. If it plays out as expected, we could end up seeing a low-scoring pitcher’s duel. The Nationals have the eighth lowest implied team total on the board. They draw a tough matchup against , who has held both left and right-handed hitters under a .285 wOBA in the last two seasons.
- Nationals Offense (2016)
Team wOBA vs. RHP — 0.314 (16 of 30)
Team ISO vs. RHP — 0.168 (13 of 30)
Team K% vs. RHP — 19.8% (9 of 30)
Pitches Per PA vs. RHP — 3.87 (15 of 30)
Runs Per Game — 4.66 (10 of 30)
Projected Run Total — 3.44 (26 of 30)
Projected Lineup
| # | Player | Bats | wOBA vs. RHP | ISO vs. RHP | wOBA L14 | FD Position | FD Salary | DK Position | DK Salary |
| 1 | | RIGHT | 0.264 | 0.157 | 0.298 | SS | $2,900 | 2B | $3,200 |
| 2 | | LEFT | 0.437 | 0.306 | 0.219 | OF | $3,700 | OF | $4,700 |
| 3 | | LEFT | 0.377 | 0.222 | 0.550 | 2B | $3,800 | 2B | $5,100 |
| 4 | | RIGHT | 0.316 | 0.149 | 0.416 | C | $3,200 | C | $3,900 |
| 5 | | RIGHT | 0.289 | 0.131 | 0.287 | OF | $3,400 | OF | $3,300 |
| 6 | | RIGHT | 0.313 | 0.136 | 0.326 | 3B | $3,300 | 3B | $3,200 |
| 7 | | RIGHT | 0.288 | 0.165 | | 1B | $3,000 | 1B | $3,300 |
| 8 | | SWITCH | 0.305 | 0.173 | 0.177 | SS | $2,800 | SS | $3,000 |
| 9 | | LEFT | 0.299 | 0.080 | 0.230 | OF | $3,000 | OF | $3,300 |
| | Team Averages | — | 0.321 | 0.169 | 0.313 | — | — | — | — |
Elite Plays – NONE
Secondary Plays – ,
Stackability – ORANGE
Cleveland
The Indians have been a top five offense against right-handed pitching this season, but targeting batters against isn’t a profitable strategy over the long run. In the last two seasons, Strasburg has held both left and right-handed hitters under a .295 wOBA. There are enough games in the early slate that we don’t have to look to either of these teams for hitters.
- Indians Offense (2016)
Team wOBA vs. RHP — 0.332 (6 of 30)
Team ISO vs. RHP — 0.193 (4 of 30)
Team K% vs. RHP — 20.3% (13 of 30)
Pitches Per PA vs. RHP — 3.92 (7 of 30)
Runs Per Game — 4.93 (5 of 30)
Projected Run Total — 3.56 (25 of 30)
Projected Lineup
| # | Player | Bats | wOBA vs. RHP | ISO vs. RHP | wOBA L14 | FD Position | FD Salary | DK Position | DK Salary |
| 1 | | SWITCH | 0.352 | 0.232 | 0.335 | 1B | $3,300 | 1B | $4,000 |
| 2 | | LEFT | 0.384 | 0.195 | 0.424 | 2B | $3,200 | 2B | $4,200 |
| 3 | | SWITCH | 0.349 | 0.159 | 0.329 | SS | $3,400 | SS | $4,100 |
| 4 | | RIGHT | 0.307 | 0.189 | 0.400 | 1B | $2,900 | 1B | $3,900 |
| 5 | | SWITCH | 0.306 | 0.127 | 0.239 | P | $4,000 | 3B/OF | $3,200 |
| 6 | | LEFT | 0.319 | 0.150 | 0.359 | OF | $3,000 | OF | $3,100 |
| 7 | | RIGHT | 0.321 | 0.160 | 0.221 | OF | $2,700 | OF | $3,500 |
| 8 | | LEFT | 0.429 | 0.311 | 0.507 | OF | $3,400 | OF | $3,700 |
| 9 | | RIGHT | 0.268 | 0.116 | 0.319 | C | $2,000 | C | $2,100 |
| | Team Averages | — | 0.337 | 0.182 | 0.348 | — | — | — | — |
Elite Plays – NONE
Secondary Plays –
Stackability – RED
San Diego at Toronto – 12:37 PM ET
| San Diego | Toronto |
 | |  | |
| RIGHT | RIGHT |
| Vegas Moneyline | Vegas Over/Under |
| TOR -220 | 10.5 |
| Stats | wOBA | HR All. | K% | BB% | Stats | wOBA | HR All. | K% | BB% |
| SP vs. Left | 0.396 | 8 | 14.0% | 6.1% | SP vs. Left | 0.312 | 22 | 13.7% | 8.8% |
| SP vs. Right | 0.399 | 3 | 19.3% | 9.4% | SP vs. Right | 0.322 | 26 | 16.5% | 6.3% |
Pitcher Grind Down
| Luis Perdomo |
 | FanDuel | DraftKings |
| Salary: | $6,200 | Salary: | $4,400 |
| FPPG: | 11.4 | FPPG: | 4.2 |
| Pitcher Rating: | 42.0 | Pitcher Rank: | 25 |
| Statistics | Starts | PitchPS | SIERA | ERA | K% | BB% | SS% | GB% | FB% | HH% |
| L30 Days | 4 | 86.5 | 3.74 | 3.97 | 14.3% | 3.8% | 8.1% | 59.5% | 19.0% | 34.9% |
| 2016 | 8 | 154.4 | 4.01 | 7.36 | 16.8% | 7.8% | 9.9% | 57.3% | 20.6% | 33.6% |
Perdomo has looked better in his last four starts, posting a 3.74 SIERA and a 3.97 ERA. The issue that I have with him is the strikeout upside. In eight starts this season, he has struck out less than 17% of the batters that he has faced. He does induce a lot of ground balls, but his fly balls do get hit hard. He currently has a 33.6% hard hit contact rate on the season. As a heavy underdog on the road, he can be avoided today against the Blue Jays.
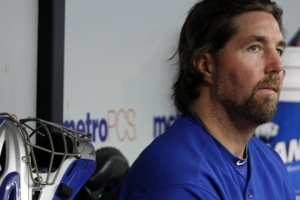
| R.A. Dickey |
 | FanDuel | DraftKings |
| Salary: | $7,400 | Salary: | $6,200 |
| FPPG: | 24.8 | FPPG: | 12.0 |
| Pitcher Rating: | 51.8 | Pitcher Rank: | 19 |
| Statistics | Starts | PitchPS | SIERA | ERA | K% | BB% | SS% | GB% | FB% | HH% |
| L30 Days | 5 | 93.2 | 4.30 | 4.18 | 21.2% | 7.6% | 11.8% | 35.1% | 42.6% | 35.1% |
| 2016 | 20 | 97.1 | 4.78 | 4.11 | 17.0% | 8.4% | 9.7% | 43.9% | 35.3% | 31.2% |
| 2015 | 33 | 98.9 | 4.76 | 3.91 | 14.3% | 6.9% | 9.1% | 41.9% | 37.2% | 23.9% |
Dickey has a great chance to pick up a cheap win in the early slate. Even though he doesn’t have the highest strikeout rate, he draws one of the top matchups on the board. The Padres are ranked 29th in both team wBOA (.288) and team strikeout rate (24.8%) against right-handed pitching this season. I would never call Dickey an elite or a must play, but he is certainly worth a look in tournaments and as an SP2.
Batter Grind Down
San Diego
The Padres may have one of the lowest team totals in the early slate, but they are facing a hittable pitcher in a hitter-friendly ballpark. There are certainly worse matchups on the board, especially when you consider how many home runs the Padres have hit since the start of July. There are a few batters that you can look at here, but all of them are best suited as GPP plays.
- Padres Offense (2016)
Team wOBA vs. RHP — 0.288 (29 of 30)
Team ISO vs. RHP — 0.154 (20 of 30)
Team K% vs. RHP — 24.8% (29 of 30)
Pitches Per PA vs. RHP — 3.88 (12 of 30)
Runs Per Game — 4.41 (18 of 30)
Projected Run Total — 4.11 (20 of 30)
Projected Lineup
| # | Player | Bats | wOBA vs. RHP | ISO vs. RHP | wOBA L14 | FD Position | FD Salary | DK Position | DK Salary |
| 1 | | LEFT | 0.312 | 0.113 | 0.276 | OF | $2,300 | OF | $3,400 |
| 2 | | RIGHT | 0.331 | 0.203 | 0.242 | 1B | $3,700 | 1B | $3,900 |
| 3 | | RIGHT | 0.308 | 0.178 | 0.477 | OF | $3,400 | OF | $3,900 |
| 4 | | SWITCH | 0.341 | 0.178 | 0.337 | 3B | $3,300 | 2B/3B | $3,300 |
| 5 | | LEFT | 0.371 | 0.239 | 0.341 | OF | $2,800 | OF | $2,900 |
| 6 | | LEFT | 0.406 | 0.390 | 0.538 | 2B | $2,200 | 2B | $3,400 |
| 7 | | RIGHT | 0.262 | 0.101 | 0.306 | SS | $2,300 | SS | $2,400 |
| 8 | | LEFT | 0.335 | 0.196 | 0.251 | 3B | $2,000 | 1B/3B | $2,700 |
| 9 | | RIGHT | 0.281 | 0.160 | 0.134 | C | $2,400 | C | $2,400 |
| | Team Averages | — | 0.327 | 0.195 | 0.322 | — | — | — | — |
Elite Plays – NONE
Secondary Plays – , ,
Stackability – ORANGE / ORANGE
Toronto
The Blue Jays have the highest run projection of all 30 teams in action today. Their matchup against appears favorable on paper, but I will warn you that he does induce a ground ball rate close to 60%. That’s not enough of a reason to fade the Jays or anything like that, but it’s worth noting. The sample size is small, but Perdomo has allowed a .395+ wOBA to both left and right-handed hitters this season.
- Blue Jays Offense (2016)
Team wOBA vs. RHP — 0.332 (6 of 30)
Team ISO vs. RHP — 0.191 (5 of 30)
Team K% vs. RHP — 21.9% (19 of 30)
Pitches Per PA vs. RHP — 4.05 (1 of 30)
Runs Per Game — 4.91 (6 of 30)
Projected Run Total — 5.89 (1 of 30)
Projected Lineup
| # | Player | Bats | wOBA vs. RHP | ISO vs. RHP | wOBA L14 | FD Position | FD Salary | DK Position | DK Salary |
| 1 | | RIGHT | 0.383 | 0.278 | 0.392 | OF | $4,900 | OF | $4,500 |
| 2 | | RIGHT | 0.398 | 0.268 | 0.353 | 3B | $4,700 | 3B | $5,400 |
| 3 | | RIGHT | 0.387 | 0.282 | 0.364 | 1B | $4,700 | 1B | $4,600 |
| 4 | | RIGHT | 0.301 | 0.155 | 0.176 | OF | $3,100 | OF | $3,500 |
| 5 | | RIGHT | 0.304 | 0.130 | 0.241 | OF | $2,700 | OF | $3,400 |
| 6 | | RIGHT | 0.373 | 0.190 | 0.418 | 2B | $2,900 | 2B | $4,300 |
| 7 | | LEFT | 0.292 | 0.099 | 0.119 | OF | $3,000 | OF | $3,400 |
| 8 | | RIGHT | 0.323 | 0.131 | 0.225 | SS | $2,400 | 2B/3B | $3,200 |
| 9 | | LEFT | 0.200 | 0.021 | 0.312 | C | $2,400 | C | $2,600 |
| | Team Averages | — | 0.329 | 0.173 | 0.289 | — | — | — | — |
Elite Plays – , ,
Secondary Plays – , ,
Stackability – GREEN
Detroit at Boston – 1:35 PM ET
| Detroit | Boston |
 | |  | |
| RIGHT | LEFT |
| Vegas Moneyline | Vegas Over/Under |
| BOS -110 | 10.5 |
| Stats | wOBA | HR All. | K% | BB% | Stats | wOBA | HR All. | K% | BB% |
| SP vs. Left | 0.257 | 0 | 16.9% | 10.2% | SP vs. Left | 0.363 | 8 | 18.2% | 5.0% |
| SP vs. Right | 0.266 | 6 | 27.8% | 6.3% | SP vs. Right | 0.315 | 15 | 17.3% | 8.2% |
Pitcher Grind Down
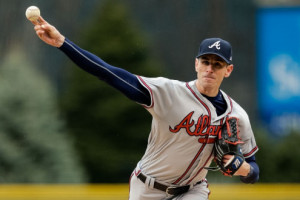
| Michael Fulmer |
 | FanDuel | DraftKings |
| Salary: | $8,300 | Salary: | $7,100 |
| FPPG: | 36.5 | FPPG: | 19.3 |
| Pitcher Rating: | 56.2 | Pitcher Rank: | 17 |
| Statistics | Starts | PitchPS | SIERA | ERA | K% | BB% | SS% | GB% | FB% | HH% |
| L30 Days | 4 | 89.0 | 3.72 | 1.42 | 20.4% | 5.1% | 12.1% | 50.7% | 24.6% | 31.0% |
| 2016 | 14 | 94.6 | 3.99 | 2.13 | 22.5% | 8.2% | 11.4% | 49.3% | 31.0% | 31.3% |
Fulmer is having an incredible rookie season so far, posting a 2.13 ERA with a strikeout rate of 22.5%. His peripheral stats suggest some regression moving forward, but his SIERA is still under 4.00 on the year. He draws a tough matchup today against the Red Sox, who are ranked first in team wOBA (.358) against right-handed pitching and first in runs scored per game this season. Targeting pitchers against the Sox in Fenway isn’t a great strategy.
| Eduardo Rodriguez |
 | FanDuel | DraftKings |
| Salary: | $6,500 | Salary: | $5,200 |
| FPPG: | 18.3 | FPPG: | 7.7 |
| Pitcher Rating: | 38.8 | Pitcher Rank: | 27 |
| Statistics | Starts | PitchPS | SIERA | ERA | K% | BB% | SS% | GB% | FB% | HH% |
| L30 Days | 3 | 91.3 | 5.24 | 7.47 | 14.3% | 7.1% | 8.0% | 32.7% | 45.5% | 32.7% |
| 2016 | 7 | 91.1 | 5.58 | 7.18 | 13.5% | 8.6% | 7.4% | 31.5% | 48.0% | 32.3% |
| 2015 | 21 | 95.7 | 4.16 | 3.85 | 18.8% | 7.1% | 7.8% | 43.0% | 33.4% | 31.4% |
Rodriguez has been one of the most hittable pitchers in baseball this season. In seven starts, he has a 5.58 SIERA (7.18 ERA) with a strikeout rate of 13.5% and a walk rate of 8.6%. He has been an extreme fly-ball pitcher with a hard hit contact rate of 32.3%. When you aren’t striking hitters out, giving up a lot of hard hit fly balls is eventually going to turn into runs. He grades out as one of the worst pitching options on the board.
Batter Grind Down
Detroit
The Tigers put up nine runs in Fenway last night and will look for another big outing today against . Over the last two seasons, Rodriguez has allowed a .363 wOBA to left-handed hitters and a .315 wOBA to right-handed hitters. I still prefer the right-handed batters in the Tigers’ lineup though, as Rodriguez has struggled with all types of batters this season.
- Tigers Offense (2016)
Team wOBA vs. LHP — 0.317 (18 of 30)
Team ISO vs. LHP — 0.159 (19 of 30)
Team K% vs. LHP — 21.6% (16 of 30)
Pitches Per PA vs. LHP — 3.87 (14 of 30)
Runs Per Game — 4.63 (11 of 30)
Projected Run Total — 5.19 (3 of 30)
Projected Lineup
| # | Player | Bats | wOBA vs. LHP | ISO vs. LHP | wOBA L14 | FD Position | FD Salary | DK Position | DK Salary |
| 1 | | RIGHT | 0.358 | 0.180 | 0.396 | 2B | $3,900 | 2B | $5,000 |
| 2 | | RIGHT | 0.357 | 0.142 | 0.359 | SS | $2,900 | SS | $3,700 |
| 3 | | RIGHT | 0.353 | 0.158 | 0.409 | 1B | $4,200 | 1B | $4,300 |
| 4 | | SWITCH | 0.360 | 0.152 | 0.153 | C | $3,700 | 1B | $3,500 |
| 5 | | RIGHT | 0.360 | 0.222 | 0.304 | 3B | $4,000 | 3B | $4,200 |
| 6 | | RIGHT | 0.270 | 0.132 | 0.325 | OF | $3,000 | OF | $4,200 |
| 7 | | RIGHT | 0.264 | 0.079 | 0.164 | 2B | $2,400 | 3B/OF | $2,800 |
| 8 | | RIGHT | 0.359 | 0.228 | 0.080 | C | $2,100 | C | $2,900 |
| 9 | | LEFT | 0.208 | 0.043 | 0.371 | OF | $2,100 | OF | $2,900 |
| | Team Averages | — | 0.321 | 0.148 | 0.285 | — | — | — | — |
Elite Plays – , ,
Secondary Plays – , , ,
Stackability – GREEN
Boston
The Red Sox draw the tougher matchup in this game, but they are actually the favorites here. They have the second highest implied team total on the board, as they square off against . He has been tough on both left and right-handed hitters this season, but facing the Red Sox in Fenway is a different animal altogether. Loading up on Red Sox at home never seems to be a bad idea.
- Red Sox Offense (2016)
Team wOBA vs. RHP — 0.358 (1 of 30)
Team ISO vs. RHP — 0.194 (3 of 30)
Team K% vs. RHP — 17.9% (3 of 30)
Pitches Per PA vs. RHP — 3.91 (10 of 30)
Runs Per Game — 5.70 (1 of 30)
Projected Run Total — 5.31 (2 of 30)
Projected Lineup
| # | Player | Bats | wOBA vs. RHP | ISO vs. RHP | wOBA L14 | FD Position | FD Salary | DK Position | DK Salary |
| 1 | | RIGHT | 0.362 | 0.207 | 0.367 | OF | $4,000 | OF | $5,300 |
| 2 | | RIGHT | 0.352 | 0.143 | 0.403 | 2B | $3,600 | 2B | $4,200 |
| 3 | | RIGHT | 0.337 | 0.116 | 0.361 | SS | $3,300 | SS | $4,400 |
| 4 | | LEFT | 0.434 | 0.345 | 0.377 | 1B | $4,300 | 1B | $5,500 |
| 5 | | LEFT | 0.381 | 0.278 | 0.404 | OF | $3,400 | OF | $4,900 |
| 6 | | RIGHT | 0.310 | 0.137 | 0.112 | 3B | $3,000 | 2B/3B | $3,300 |
| 7 | | LEFT | 0.340 | 0.195 | 0.329 | 3B | $3,500 | 1B/3B | $4,100 |
| 8 | | SWITCH | 0.304 | 0.093 | 0.377 | C | $2,900 | C | $2,900 |
| 9 | | LEFT | 0.320 | 0.120 | 0.363 | OF | $2,700 | OF | $3,400 |
| | Team Averages | — | 0.349 | 0.182 | 0.344 | — | — | — | — |
Elite Plays – , , ,
Secondary Plays – , ,
Stackability – GREEN
Tampa Bay at LA Dodgers – 3:10 PM ET
| Tampa Bay | LA Dodgers |
 | Matt Moore |  | |
| LEFT | RIGHT |
| Vegas Moneyline | Vegas Over/Under |
| LAD -180 | 7.5 |
| Stats | wOBA | HR All. | K% | BB% | Stats | wOBA | HR All. | K% | BB% |
| SP vs. Left | 0.309 | 7 | 17.5% | 6.6% | SP vs. Left | 0.308 | 3 | 33.8% | 5.9% |
| SP vs. Right | 0.339 | 22 | 19.2% | 7.6% | SP vs. Right | 0.314 | 7 | 33.3% | 4.8% |
Pitcher Grind Down
| Matt Moore |
 | FanDuel | DraftKings |
| Salary: | $8,000 | Salary: | $7,500 |
| FPPG: | 28.9 | FPPG: | 14.7 |
| Pitcher Rating: | 44.7 | Pitcher Rank: | 24 |
| Statistics | Starts | PitchPS | SIERA | ERA | K% | BB% | SS% | GB% | FB% | HH% |
| L30 Days | 6 | 105.8 | 5.15 | 3.10 | 15.7% | 6.6% | 9.0% | 31.2% | 52.8% | 27.3% |
| 2016 | 20 | 101.4 | 4.38 | 4.31 | 19.9% | 6.9% | 10.1% | 37.1% | 43.9% | 32.1% |
| 2015 | 12 | 88.0 | 4.67 | 5.43 | 16.6% | 8.3% | 9.9% | 39.2% | 38.7% | 31.7% |
Moore’s numbers continue to trend in the wrong direction. In his last six starts, he has a 5.15 SIERA with a below-average strikeout rate of 15.7%. He was once considered an elite strikeout pitcher. He draws a decent matchup today against the Dodgers in Los Angeles, but there are enough red flags to avoid him in all league formats. He comes into the game as a sizable underdog.
| Brandon McCarthy |
 | FanDuel | DraftKings |
| Salary: | $8,000 | Salary: | $10,800 |
| FPPG: | 39.3 | FPPG: | 23.2 |
| Pitcher Rating: | 80.2 | Pitcher Rank: | 7 |
| Statistics | Starts | PitchPS | SIERA | ERA | K% | BB% | SS% | GB% | FB% | HH% |
| L30 Days | 4 | 77.8 | 3.16 | 1.61 | 32.1% | 8.6% | 9.0% | 42.6% | 42.6% | 27.1% |
| 2016 | 4 | 77.8 | 3.16 | 1.61 | 32.1% | 8.6% | 9.0% | 42.6% | 42.6% | 27.1% |
| 2015 | 4 | 91.8 | 2.61 | 5.87 | 30.9% | 4.3% | 11.7% | 38.3% | 40.0% | 47.5% |
McCarthy has been terrific in his first four starts of the season, posting a 3.16 SIERA with a strikeout rate of 32.1%. The biggest concern has been his pitch count, averaging only 77.8 pitches per start. The good news is that he threw 85 pitches in his last outing and he only came out of the game because his calf cramped up. We could see him throw around 90 pitches tonight, which does give him a higher ceiling and floor compared to his first few starts. The Rays are a favorable matchup, as they are ranked 24th in team wOBA (.304) and 28th in team strikeout rate (24.2%) against right-handed pitching this season.
Batter Grind Down
Tampa Bay
The Rays are typically an easy team to fade when they are facing a right-handed pitcher. They come into today’s game with the third lowest implied team total on the board. They draw a difficult matchup against and they have to face him in a pitcher-friendly National League ballpark.
- Rays Offense (2016)
Team wOBA vs. RHP — 0.304 (24 of 30)
Team ISO vs. RHP — 0.177 (8 of 30)
Team K% vs. RHP — 24.2% (28 of 30)
Pitches Per PA vs. RHP — 3.87 (13 of 30)
Runs Per Game — 3.98 (25 of 30)
Projected Run Total — 3.29 (28 of 30)
Projected Lineup
| # | Player | Bats | wOBA vs. RHP | ISO vs. RHP | wOBA L14 | FD Position | FD Salary | DK Position | DK Salary |
| 1 | | RIGHT | 0.325 | 0.121 | 0.283 | 2B | $3,500 | 2B | $3,400 |
| 2 | | LEFT | 0.335 | 0.201 | 0.343 | SS | $2,900 | SS | $3,600 |
| 3 | | RIGHT | 0.327 | 0.190 | 0.392 | 3B | $3,500 | 3B | $3,900 |
| 4 | | LEFT | 0.315 | 0.181 | 0.266 | 1B | $2,900 | 1B | $3,100 |
| 5 | | RIGHT | 0.334 | 0.201 | 0.286 | OF | $3,200 | 1B/2B | $3,100 |
| 6 | | LEFT | 0.355 | 0.270 | 0.354 | OF | $3,000 | OF | $3,400 |
| 7 | | LEFT | 0.316 | 0.177 | 0.229 | OF | $2,400 | OF | $2,900 |
| 8 | | RIGHT | 0.289 | 0.222 | 0.246 | C | $2,500 | C | $2,100 |
| 9 | Matt Moore | LEFT | 0.000 | 0.000 | | P | $8,000 | P | $7,500 |
| | Team Averages | — | 0.288 | 0.174 | 0.300 | — | — | — | — |
Elite Plays – NONE
Secondary Plays – NONE
Stackability – RED
LA Dodgers
The Dodgers have a mediocre run projection today, as they square off against Matt Moore. Even though Dodgers Stadium isn’t the best hitter’s park, Moore has shown that he can give up runs no matter where he is pitching. Over the last two seasons, Moore has allowed a .339 wOBA and 22 home runs to right-handed hitters.
- Dodgers Offense (2016)
Team wOBA vs. LHP — 0.283 (28 of 30)
Team ISO vs. LHP — 0.132 (26 of 30)
Team K% vs. LHP — 20.9% (12 of 30)
Pitches Per PA vs. LHP — 3.83 (18 of 30)
Runs Per Game — 4.30 (19 of 30)
Projected Run Total — 4.21 (14 of 30)
Projected Lineup
| # | Player | Bats | wOBA vs. LHP | ISO vs. LHP | wOBA L14 | FD Position | FD Salary | DK Position | DK Salary |
| 1 | | RIGHT | 0.321 | 0.096 | 0.469 | 2B | $3,100 | 2B/OF | $4,700 |
| 2 | | LEFT | 0.334 | 0.190 | 0.422 | SS | $3,500 | SS | $4,000 |
| 3 | | RIGHT | 0.301 | 0.151 | 0.532 | 3B | $3,600 | 3B | $4,800 |
| 4 | | LEFT | 0.324 | 0.125 | 0.291 | 1B | $3,000 | 1B | $3,700 |
| 5 | Scott | RIGHT | 0.355 | 0.160 | 0.362 | OF | $2,400 | 1B/OF | $3,200 |
| 6 | | RIGHT | 0.337 | 0.189 | 0.261 | OF | $2,400 | OF | $3,200 |
| 7 | | SWITCH | 0.347 | 0.092 | 0.317 | C | $3,000 | C | $3,800 |
| 8 | | RIGHT | 0.302 | 0.159 | 0.384 | SS | $2,300 | 2B/SS | $3,200 |
| 9 | | RIGHT | 0.000 | 0.000 | 0.000 | P | $8,000 | P | $10,800 |
| | Team Averages | — | 0.291 | 0.129 | 0.338 | — | — | — | — |
Elite Plays –
Secondary Plays – , Scott ,
Stackability – YELLOW
Want to discuss strategy for today’s games? Head over to the RotoGrinders Forums
Jump to Page 1 2 3
