MLB Grind Down: Saturday, July 29th

Jump to Page 1 2 3
The RotoGrinders MLB Grind Down will give you an in-depth analysis into the upcoming MLB schedule. This article will break down the numbers for every single game and give you analysis on which trends you can exploit. While matchups are a major factor in daily fantasy baseball, there are plenty of other factors to consider such as injuries, weather, and salaries.
The analysis should point you in the right direction, but it is still up to you to decipher the information and make your own selections. No sport has more variance than baseball. The best choice is not always the right choice but following the trends will win you money over time.
Note: As always, if you want to try a new DFS site, be sure to click through a RotoGrinders link and use our DraftKings promo code, FanDuel promo code, and FantasyDraft promo code to receive the best perks in the industry.
Stackability Rating System:
GREEN – A viable full stack in cash games and GPPs.
YELLOW – A viable mini-stack in cash games and full stack in GPPs.
ORANGE – A viable stack in large field GPPs.
RED – Not a recommended stack for cash games or GPPs.
Tampa Bay at NY Yankees – 1:05 PM ET
| Tampa Bay | NY Yankees | ||||||||||||||
 | Blake Snell |  | Caleb Smith | ||||||||||||
| LEFT | LEFT | ||||||||||||||
| Vegas Moneyline | Vegas Over/Under | ||||||||||||||
| NYY-150 | 9.0 | ||||||||||||||
| Stats | wOBA | xwOBA | HC% | BB% | K% | GB% | Stats | wOBA | xwOBA | HC% | BB% | K% | GB% | ||
|---|---|---|---|---|---|---|---|---|---|---|---|---|---|---|---|
| SP vs. Left (2016-17) | 0.293 | 0.295 | 32.4% | 13.6% | 27.2% | 54.2% | SP vs. Left (2016-17) | 0.392 | 0.256 | 11.1% | 0.0% | 30.8% | 44.4% | ||
| SP vs. Right (2016-17) | 0.337 | 0.333 | 32.7% | 13.0% | 21.4% | 34.7% | SP vs. Right (2016-17) | 0.268 | 0.363 | 23.1% | 11.1% | 16.7% | 38.5% | ||
Pitcher Grind Down
| Blake Snell | |||||||||
 | FanDuel | DraftKings | FantasyDraft | ||||||
| Salary: | $6,300 | Salary: | $7,200 | Salary: | |||||
| Salary Rank: | 24 of 30 | Salary Rank: | 15 of 30 | Salary Rank: | of 30 | ||||
| Stats | Starts | SIERA | ERA | K% | BB% | GB% | HC% | SC% | |
|---|---|---|---|---|---|---|---|---|---|
| 2016 | 19 | 4.53 | 3.54 | 24.4% | 12.7% | 36.5% | 31.4% | 22.2% | |
| 2017 | 12 | 5.37 | 4.86 | 19.7% | 13.6% | 40.0% | 34.4% | 21.0% | |
| L30 | 4 | 5.11 | 5.14 | 23.3% | 14.4% | 35.8% | 32.1% | 25.0% | |
Seth was a late scratch today, so I’m getting the rare weekend start. If you are tired of hearing me ramble, I apologize. Anyway, seeing how I am a late fill in, this is going to be a slimmed down version. We have five early games on the schedule, so let’s hop right into them.
There was a lot of chatter about Snell’s improved command when he was called back up from the minors, but we’ve seen more of the same from him. In his last five starts, he has a SIERA over 5.00 with a walk rate of 14%. You can’t get away with walking batters against the Yankees, especially in this ballpark.
Quick Breakdown: As an underdog on the road, Snell is an easy fade in all formats.
| Caleb Smith | |||||||||
 | FanDuel | DraftKings | FantasyDraft | ||||||
| Salary: | $5,500 | Salary: | $4,900 | Salary: | |||||
| Salary Rank: | 29 of 30 | Salary Rank: | 29 of 30 | Salary Rank: | of 30 | ||||
| Stats | Starts | SIERA | ERA | K% | BB% | GB% | HC% | SC% | |
|---|---|---|---|---|---|---|---|---|---|
| 2017 | 1 | 3.79 | 8.10 | 22.6% | 6.5% | 40.9% | 18.2% | 13.6% | |
| L30 | 1 | 3.82 | 8.10 | 22.6% | 6.5% | 40.9% | 18.2% | 13.6% | |
Smith is making his second career major league start today. He has pitched well in the minors and looked pretty good in his first start in the big leagues. He is still a wildcard at this point though, and pitcher is one position where we want to see consistency. The upside is there against a strikeout-prone Rays’ offense, but so is the downside.
Quick Breakdown: Smith is too risky to trust in a cash game setting, but he’s worth a look as an SP2 in tournaments.
Batter Grind Down
Tampa Bay
The Rays see a favorable ballpark shift playing in Yankee Stadium, but are hoping to bounce back after striking out 14 times against Masahiro Tanaka last night (hopefully everyone listened to my advice on him BTW). Today they face a rookie lefty that is only making his second career major league start. Evan Longoria has always hit southpaws well and Trevor Plouffe is still the bare minimum on FanDuel ($2,000).
Projected Lineup (Splits vs. LH Pitching)
| # | Player | Bats | wOBA | xwOBA | ISO | HC% | BB% | K% | GB% | FD Pos. | FD Sal. | DK Pos. | DK Sal. | FDRFT Pos. | FDRFT Sal. |
|---|---|---|---|---|---|---|---|---|---|---|---|---|---|---|---|
| 1 | Peter Bourjos | RIGHT | 0.331 | 0.283 | 0.193 | 40.5% | 8.1% | 24.2% | 45.2% | OF | $2,300 | OF | $3,000 | N/A | N/A |
| 2 | Steve Souza | RIGHT | 0.329 | 0.266 | 0.093 | 26.9% | 13.4% | 26.8% | 47.0% | OF | $4,000 | OF | $5,200 | N/A | N/A |
| 3 | Evan Longoria | RIGHT | 0.281 | 0.320 | 0.171 | 41.3% | 12.9% | 22.6% | 52.5% | 3B | $3,500 | 3B | $4,400 | N/A | N/A |
| 4 | Lucas Duda | LEFT | 0.327 | 0.301 | 0.268 | 50.0% | 6.7% | 36.7% | 44.1% | 1B | $3,300 | 1B | $3,700 | N/A | N/A |
| 5 | Trevor Plouffe | RIGHT | 0.303 | 0.352 | 0.058 | 39.6% | 8.0% | 21.3% | 47.2% | 2B | $2,000 | 3B | $3,300 | N/A | N/A |
| 6 | Corey Dickerson | LEFT | 0.378 | 0.288 | 0.209 | 30.9% | 4.2% | 25.4% | 49.4% | OF | $3,000 | OF | $4,600 | N/A | N/A |
| 7 | Tim Beckham | RIGHT | 0.307 | 0.317 | 0.110 | 37.5% | 8.8% | 28.6% | 53.6% | SS | $2,600 | SS | $3,500 | N/A | N/A |
| 8 | Adeiny Hechavarria | RIGHT | 0.307 | 0.301 | 0.160 | 33.3% | 3.6% | 10.7% | 50.0% | SS | $2,300 | SS | $2,800 | N/A | N/A |
| 9 | Jesus Sucre | RIGHT | 0.215 | 0.252 | 0.103 | 29.2% | 6.3% | 18.8% | 29.2% | C | $2,400 | C | $3,000 | N/A | N/A |
Elite Plays – Trevor Plouffe (FD)
Secondary Plays – Peter Bourjos, Evan Longoria, Trevor Plouffe (DK & FDRFT)
Stackability – ORANGE / YELLOW
NY Yankees
The Yankees are one of the top offenses to target in the early slate. They are facing a pitcher that struggles with his command, which will lead to a lot of baserunners. With all of the power in this lineup, a lot of baserunners can lead to some big innings. Give an edge to the right-handed hitters, as Blake Snell has allowed a .333 xwOBA to batters from that side of the plate.
Projected Lineup (Splits vs. LH Pitching)
| # | Player | Bats | wOBA | xwOBA | ISO | HC% | BB% | K% | GB% | FD Pos. | FD Sal. | DK Pos. | DK Sal. | FDRFT Pos. | FDRFT Sal. |
|---|---|---|---|---|---|---|---|---|---|---|---|---|---|---|---|
| 1 | Brett Gardner | LEFT | 0.278 | 0.285 | 0.128 | 20.0% | 13.2% | 20.9% | 47.4% | OF | $4,000 | OF | $4,600 | N/A | N/A |
| 2 | Clint Frazier | RIGHT | 0.410 | 0.245 | 0.333 | 42.9% | 0.0% | 33.3% | 35.7% | OF | $2,700 | OF | $4,100 | N/A | N/A |
| 3 | Aaron Judge | RIGHT | 0.440 | 0.483 | 0.347 | 43.5% | 24.0% | 27.1% | 32.6% | OF | $4,800 | OF | $5,700 | N/A | N/A |
| 4 | Gary Sanchez | RIGHT | 0.309 | 0.396 | 0.193 | 38.1% | 12.3% | 23.1% | 40.5% | C | $3,600 | C | $4,700 | N/A | N/A |
| 5 | Matt Holliday | RIGHT | 0.340 | 0.340 | 0.175 | 45.0% | 16.9% | 31.2% | 47.5% | OF | $2,600 | 1B | $3,800 | N/A | N/A |
| 6 | Didi Gregorius | LEFT | 0.261 | 0.265 | 0.053 | 14.5% | 3.7% | 17.3% | 39.3% | SS | $3,900 | SS | $4,600 | N/A | N/A |
| 7 | Garrett Cooper | RIGHT | 0.349 | 0.311 | 0.286 | 50.0% | 0.0% | 42.9% | 12.5% | 1B | $2,200 | 1B | $3,100 | N/A | N/A |
| 8 | Todd Frazier | RIGHT | 0.341 | 0.387 | 0.282 | 40.0% | 15.1% | 19.8% | 20.0% | 3B | $3,300 | 3B | $4,100 | N/A | N/A |
| 9 | Ronald Torreyes | RIGHT | 0.333 | 0.261 | 0.026 | 19.4% | 4.8% | 9.5% | 61.1% | 2B | $2,400 | 3B/SS | $3,400 | N/A | N/A |
Elite Plays – Aaron Judge, Gary Sanchez, Matt Holliday
Secondary Plays – Brett Gardner, Clint Frazier, Todd Frazier
Stackability – GREEN
LA Angels at Toronto – 1:07 PM ET
| LA Angels | Toronto | ||||||||||||||
 | Yusmeiro Petit |  | Francisco Liriano | ||||||||||||
| RIGHT | LEFT | ||||||||||||||
| Vegas Moneyline | Vegas Over/Under | ||||||||||||||
| TOR-120 | 9.5 | ||||||||||||||
| Stats | wOBA | xwOBA | HC% | BB% | K% | GB% | Stats | wOBA | xwOBA | HC% | BB% | K% | GB% | ||
|---|---|---|---|---|---|---|---|---|---|---|---|---|---|---|---|
| SP vs. Left (2016-17) | 0.346 | 0.335 | 37.7% | 9.2% | 15.5% | 45.0% | SP vs. Left (2016-17) | 0.312 | 0.291 | 29.9% | 7.2% | 23.8% | 58.0% | ||
| SP vs. Right (2016-17) | 0.256 | 0.241 | 27.0% | 3.0% | 26.9% | 33.2% | SP vs. Right (2016-17) | 0.355 | 0.337 | 34.5% | 12.9% | 21.5% | 46.6% | ||
Pitcher Grind Down
| Yusmeiro Petit | |||||||||
 | FanDuel | DraftKings | FantasyDraft | ||||||
| Salary: | $5,500 | Salary: | $4,300 | Salary: | |||||
| Salary Rank: | 29 of 30 | Salary Rank: | 30 of 30 | Salary Rank: | of 30 | ||||
| Stats | Starts | SIERA | ERA | K% | BB% | GB% | HC% | SC% | |
|---|---|---|---|---|---|---|---|---|---|
| 2016 | 1 | 4.03 | 4.50 | 18.5% | 5.7% | 41.5% | 29.4% | 18.4% | |
| 2017 | 0 | 3.34 | 2.85 | 26.4% | 5.7% | 34.3% | 35.2% | 20.4% | |
| L30 | 0 | 4.85 | 5.00 | 13.5% | 2.7% | 32.3% | 45.2% | 29.0% | |
Petit is drawing his first start of the season, after making 36 appearances out of the bullpen. He likely won’t pitch deep into this game, which immediately takes him out of consideration. Even if he did see a full complement of pitches, he would be an easy fade. Petit has a below-average strikeout rate in his career and is facing a talented Blue Jays’ offense on the road.
Quick Breakdown: Avoid Petit in all formats.
| Francisco Liriano | |||||||||
 | FanDuel | DraftKings | FantasyDraft | ||||||
| Salary: | $6,600 | Salary: | $7,700 | Salary: | |||||
| Salary Rank: | 19 of 30 | Salary Rank: | 9 of 30 | Salary Rank: | of 30 | ||||
| Stats | Starts | SIERA | ERA | K% | BB% | GB% | HC% | SC% | |
|---|---|---|---|---|---|---|---|---|---|
| 2016 | 29 | 4.38 | 4.69 | 23.0% | 11.6% | 52.0% | 34.8% | 19.4% | |
| 2017 | 17 | 5.08 | 5.99 | 19.9% | 12.0% | 43.1% | 31.2% | 16.5% | |
| L30 | 6 | 5.47 | 6.41 | 15.1% | 10.1% | 41.6% | 25.8% | 25.8% | |
Liriano is coming off of one of his better starts this season, but is still one of the most volatile pitchers in baseball. On the season, his SIERA is above 5.00 and he has a walk rate of 12%. He is giving up more hard contact this season and the strikeout rate is down. While he is cheap and favored, he’s an easy fade against the Angels in a hitter-friendly ballpark. The Angels are a patient offense that doesn’t strikeout often.
Quick Breakdown: Liriano is a deep GPP play at best. I plan to avoid him in all formats.
Batter Grind Down
LA Angels
The Angels aren’t the most potent offense around, but they draw a favorable matchup against Francisco Liriano and they get to face him in the hitter-friendly Rogers Centre. Liriano has a high walk rate and he has allowed a .337 xwOBA with a 35% hard contact rate to right-handed hitters.
Projected Lineup (Splits vs. LH Pitching)
| # | Player | Bats | wOBA | xwOBA | ISO | HC% | BB% | K% | GB% | FD Pos. | FD Sal. | DK Pos. | DK Sal. | FDRFT Pos. | FDRFT Sal. |
|---|---|---|---|---|---|---|---|---|---|---|---|---|---|---|---|
| 1 | Yunel Escobar | RIGHT | 0.350 | 0.340 | 0.065 | 33.8% | 7.0% | 13.0% | 60.0% | 3B | $2,500 | 3B | $2,900 | N/A | N/A |
| 2 | Mike Trout | RIGHT | 0.399 | 0.382 | 0.237 | 27.6% | 20.4% | 18.4% | 41.4% | OF | $4,800 | OF | $5,600 | N/A | N/A |
| 3 | Albert Pujols | RIGHT | 0.284 | 0.317 | 0.120 | 36.0% | 7.1% | 17.2% | 40.0% | 1B | $2,700 | 1B | $3,200 | N/A | N/A |
| 4 | C.J. Cron | RIGHT | 0.412 | 0.398 | 0.351 | 40.7% | 7.5% | 25.0% | 25.9% | 1B | $2,300 | 1B | $3,100 | N/A | N/A |
| 5 | Andrelton Simmons | RIGHT | 0.324 | 0.311 | 0.138 | 26.7% | 11.1% | 13.1% | 50.7% | SS | $3,200 | SS | $3,800 | N/A | N/A |
| 6 | Kole Calhoun | LEFT | 0.296 | 0.331 | 0.162 | 29.1% | 9.6% | 19.1% | 44.3% | OF | $2,900 | OF | $3,100 | N/A | N/A |
| 7 | Martin Maldonado | RIGHT | 0.336 | 0.306 | 0.135 | 35.2% | 8.1% | 24.4% | 57.7% | C | $2,000 | C | $2,900 | N/A | N/A |
| 8 | Shane Robinson | RIGHT | 0.163 | 0.232 | 0.000 | 9.1% | 6.7% | 20.0% | 54.5% | OF | $2,000 | OF | $2,100 | N/A | N/A |
| 9 | Cliff Pennington | SWITCH | 0.283 | 0.276 | 0.038 | 31.6% | 0.0% | 26.9% | 47.4% | SS | $2,300 | 2B/3B | $2,100 | N/A | N/A |
Elite Plays – Mike Trout, C.J. Cron
Secondary Plays – Yunel Escobar, Albert Pujols
Stackability – YELLOW
Toronto
The Blue Jays draw a favorable matchup against Yusmeiro Petit, but they likely won’t face him for more than a few innings. Trying to figure out which batters benefit most from Petit’s splits may prove futile because they may only face him one time each. With that said, a Blue Jays’ stack is viable in the early slate and the one through five hitters are in play for cash games.
Projected Lineup (Splits vs. RH Pitching)
| # | Player | Bats | wOBA | xwOBA | ISO | HC% | BB% | K% | GB% | FD Pos. | FD Sal. | DK Pos. | DK Sal. | FDRFT Pos. | FDRFT Sal. |
|---|---|---|---|---|---|---|---|---|---|---|---|---|---|---|---|
| 1 | Jose Bautista | RIGHT | 0.334 | 0.338 | 0.191 | 33.8% | 13.1% | 22.6% | 33.8% | OF | $3,300 | OF | $4,100 | N/A | N/A |
| 2 | Russell Martin | RIGHT | 0.344 | 0.335 | 0.169 | 30.8% | 14.5% | 22.4% | 51.5% | C | $2,600 | C | $3,500 | N/A | N/A |
| 3 | Josh Donaldson | RIGHT | 0.346 | 0.341 | 0.195 | 31.6% | 14.5% | 25.9% | 43.9% | 3B | $3,700 | 3B | $4,700 | N/A | N/A |
| 4 | Justin Smoak | SWITCH | 0.375 | 0.398 | 0.292 | 39.7% | 10.7% | 22.1% | 33.0% | 1B | $3,900 | 1B | $5,400 | N/A | N/A |
| 5 | Kendrys Morales | SWITCH | 0.301 | 0.358 | 0.186 | 37.6% | 6.8% | 22.2% | 47.3% | 1B | $3,300 | 1B | $3,900 | N/A | N/A |
| 6 | Steve Pearce | RIGHT | 0.329 | 0.307 | 0.142 | 32.3% | 5.4% | 21.7% | 45.2% | OF | $2,800 | OF | $3,600 | N/A | N/A |
| 7 | Darwin Barney | RIGHT | 0.224 | 0.239 | 0.087 | 17.1% | 2.8% | 15.7% | 50.0% | SS | $2,000 | 2B/3B | $2,000 | N/A | N/A |
| 8 | Kevin Pillar | RIGHT | 0.273 | 0.311 | 0.130 | 27.6% | 5.2% | 15.4% | 45.1% | OF | $2,300 | OF | $3,100 | N/A | N/A |
| 9 | Ryan Goins | LEFT | 0.265 | 0.286 | 0.130 | 28.1% | 7.8% | 17.6% | 44.3% | 2B | $2,200 | 2B/SS | $2,500 | N/A | N/A |
Elite Plays – Jose Bautista, Russell Martin, Josh Donaldson,
Secondary Plays – Justin Smoak, Kendrys Morales
Stackability – YELLOW / GREEN
San Francisco at LA Dodgers – 4:05 PM ET
| San Francisco | LA Dodgers | ||||||||||||||
 | Ty Blach |  | Rich Hill | ||||||||||||
| LEFT | LEFT | ||||||||||||||
| Vegas Moneyline | Vegas Over/Under | ||||||||||||||
| LAD-280 | 9.0 | ||||||||||||||
| Stats | wOBA | xwOBA | HC% | BB% | K% | GB% | Stats | wOBA | xwOBA | HC% | BB% | K% | GB% | ||
|---|---|---|---|---|---|---|---|---|---|---|---|---|---|---|---|
| SP vs. Left (2016-17) | 0.250 | 0.302 | 32.1% | 7.2% | 11.5% | 54.6% | SP vs. Left (2016-17) | 0.288 | 0.289 | 23.2% | 7.4% | 19.8% | 50.9% | ||
| SP vs. Right (2016-17) | 0.331 | 0.307 | 30.0% | 4.9% | 12.8% | 44.9% | SP vs. Right (2016-17) | 0.255 | 0.266 | 29.8% | 9.0% | 31.7% | 40.0% | ||
Pitcher Grind Down
| Ty Blach | |||||||||
 | FanDuel | DraftKings | FantasyDraft | ||||||
| Salary: | $7,200 | Salary: | $5,400 | Salary: | $10,800 | ||||
| Salary Rank: | 16 of 30 | Salary Rank: | 26 of 30 | Salary Rank: | 24 of 30 | ||||
| Stats | Starts | SIERA | ERA | K% | BB% | GB% | HC% | SC% | |
|---|---|---|---|---|---|---|---|---|---|
| 2016 | 2 | 4.46 | 1.06 | 16.1% | 8.1% | 57.8% | 29.8% | 25.5% | |
| 2017 | 16 | 5.05 | 4.50 | 11.9% | 5.2% | 46.2% | 30.7% | 20.1% | |
| L30 | 4 | 4.55 | 3.42 | 16.4% | 5.5% | 43.4% | 30.2% | 22.1% | |
Blach has some of the tools that we are looking for in a pitcher, but he is missing the main one – a high strikeout rate. A high ground ball rate and an ability to induce soft and medium contact is nice, but when you aren’t striking anyone out, you aren’t going to rack up enough fantasy points. Blach is an easy fade against the Dodgers, who are one of the best offenses in baseball against left-handed pitching.
Quick Breakdown: Avoid Blach in all formats.
| Rich Hill | |||||||||
 | FanDuel | DraftKings | FantasyDraft | ||||||
| Salary: | $9,400 | Salary: | $12,400 | Salary: | $24,000 | ||||
| Salary Rank: | 4 of 30 | Salary Rank: | 3 of 30 | Salary Rank: | 3 of 30 | ||||
| Stats | Starts | SIERA | ERA | K% | BB% | GB% | HC% | SC% | |
|---|---|---|---|---|---|---|---|---|---|
| 2016 | 20 | 3.29 | 2.12 | 29.4% | 7.5% | 45.3% | 28.3% | 22.3% | |
| 2017 | 14 | 3.89 | 3.48 | 28.6% | 10.2% | 38.7% | 27.9% | 24.6% | |
| L30 | 5 | 2.54 | 1.95 | 35.2% | 4.0% | 40.3% | 31.5% | 23.3% | |
Hill is finally starting to pitch well again. I can’t remember the exact quote, but he said something about baseball being a lot more fun when you don’t suck. I imagine that’s true, especially for a pitcher. In his last five starts, he has a 2.54 SIERA with a strikeout rate of 35%. He is the top pitcher in the early slate, narrowly beating out Jacob deGrom. Hill gets to take on a Giants’ offense that has struggled with southpaws all season.
Quick Breakdown: Don’t overthink this one. Eat the chalk and play Hill in all formats.
Batter Grind Down
San Francisco
The Giants draw the worst matchup in the early slate. They have to face Rich Hill, who has an elite strikeout rate and an ability to induce a lot of soft contact. Over the last two seasons, Hill has held both left and right-handed hitters under a .290 xwOBA.
Projected Lineup (Splits vs. LH Pitching)
| # | Player | Bats | wOBA | xwOBA | ISO | HC% | BB% | K% | GB% | FD Pos. | FD Sal. | DK Pos. | DK Sal. | FDRFT Pos. | FDRFT Sal. |
|---|---|---|---|---|---|---|---|---|---|---|---|---|---|---|---|
| 1 | Denard Span | LEFT | 0.260 | 0.248 | 0.048 | 14.8% | 5.9% | 13.2% | 55.6% | OF | $3,400 | OF | $3,400 | CF | $6,600 |
| 2 | Joe Panik | LEFT | 0.291 | 0.279 | 0.072 | 23.2% | 8.3% | 14.8% | 49.4% | 2B | $2,800 | 2B | $3,000 | 2B | $6,000 |
| 3 | Hunter Pence | RIGHT | 0.308 | 0.352 | 0.159 | 38.7% | 8.2% | 14.4% | 46.7% | OF | $2,700 | OF | $2,900 | RF | $5,700 |
| 4 | Buster Posey | RIGHT | 0.450 | 0.380 | 0.264 | 34.6% | 13.3% | 9.5% | 34.6% | C | $3,300 | 1B/C | $3,600 | C | $7,200 |
| 5 | Brandon Crawford | LEFT | 0.296 | 0.303 | 0.150 | 29.9% | 6.8% | 17.0% | 40.3% | SS | $2,800 | SS | $3,000 | SS | $6,000 |
| 6 | Jae-gyun Hwang | RIGHT | 0.384 | 0.536 | 0.250 | 36.4% | 0.0% | 8.3% | 45.5% | 1B | $2,000 | 3B | $2,000 | 3B | $3,900 |
| 7 | Brandon Belt | LEFT | 0.296 | 0.310 | 0.167 | 32.9% | 11.0% | 25.7% | 36.5% | 1B | $3,300 | 1B/OF | $3,300 | IF/OF | $6,400 |
| 8 | Gorkys Hernandez | RIGHT | 0.264 | 0.289 | 0.051 | 29.0% | 11.4% | 18.2% | 37.3% | OF | $2,600 | OF | $2,700 | CF | $5,200 |
| 9 | Ty Blach | LEFT | 0.162 | 0.262 | 0.083 | 9.1% | 0.0% | 21.4% | 40.0% | P | $7,200 | P | $5,400 | P | $10,800 |
Elite Plays – None
Secondary Plays – None
Stackability – RED
LA Dodgers
The Dodgers draw a favorable matchup against Ty Blach, who has one of the lowest strikeout rates of any starter in baseball. They should be able to put the ball in play often, it’s just a question of whether or not they can make good contact. Blach’s biggest strength is his ability to induce soft and medium contact. I still like the Dodgers’ stack here, but they aren’t my favorite offense in the early slate.
Projected Lineup (Splits vs. LH Pitching)
| # | Player | Bats | wOBA | xwOBA | ISO | HC% | BB% | K% | GB% | FD Pos. | FD Sal. | DK Pos. | DK Sal. | FDRFT Pos. | FDRFT Sal. |
|---|---|---|---|---|---|---|---|---|---|---|---|---|---|---|---|
| 1 | Chris Taylor | RIGHT | 0.443 | 0.350 | 0.234 | 28.6% | 10.5% | 24.4% | 42.9% | OF | $4,100 | 2B/OF | $4,800 | 2B | $9,200 |
| 2 | Corey Seager | LEFT | 0.391 | 0.388 | 0.231 | 48.1% | 10.5% | 25.8% | 40.3% | SS | $3,600 | SS | $5,300 | SS | $10,200 |
| 3 | Justin Turner | RIGHT | 0.533 | 0.481 | 0.376 | 47.1% | 10.7% | 8.9% | 31.8% | 3B | $3,500 | 3B | $4,300 | 3B | $8,400 |
| 4 | Cody Bellinger | LEFT | 0.366 | 0.359 | 0.322 | 43.3% | 8.1% | 24.2% | 31.3% | 1B | $3,800 | 1B/OF | $5,500 | IF/OF | $10,800 |
| 5 | Logan Forsythe | RIGHT | 0.426 | 0.405 | 0.197 | 36.0% | 16.9% | 24.7% | 40.0% | 2B | $3,100 | 2B/3B | $3,200 | 2B | $6,400 |
| 6 | Austin Barnes | RIGHT | 0.389 | 0.396 | 0.297 | 34.0% | 12.2% | 18.9% | 40.0% | C | $2,500 | C | $3,400 | C | $6,600 |
| 7 | Enrique Hernandez | RIGHT | 0.424 | 0.406 | 0.409 | 41.7% | 14.7% | 19.3% | 38.9% | OF | $2,300 | OF/SS | $3,600 | IF/OF | $7,200 |
| 8 | Yasiel Puig | RIGHT | 0.226 | 0.289 | 0.064 | 25.0% | 12.2% | 12.2% | 64.7% | OF | $2,800 | OF | $3,800 | RF | $7,500 |
| 9 | Rich Hill | LEFT | 0.110 | 0.133 | 0.000 | 0.0% | 0.0% | 37.5% | 60.0% | P | $9,400 | P | $12,400 | P | $24,000 |
Elite Plays – Chris Taylor, Justin Turner
Secondary Plays – Corey Seager, Cody Bellinger, Logan Forsythe, Austin Barnes
Stackability – YELLOW / GREEN
NY Mets at Seattle – 4:10 PM ET
| NY Mets | Seattle | ||||||||||||||
 | Jacob deGrom |  | Yovani Gallardo | ||||||||||||
| RIGHT | RIGHT | ||||||||||||||
| Vegas Moneyline | Vegas Over/Under | ||||||||||||||
| NYM-115 | 9.0 | ||||||||||||||
| Stats | wOBA | xwOBA | HC% | BB% | K% | GB% | Stats | wOBA | xwOBA | HC% | BB% | K% | GB% | ||
|---|---|---|---|---|---|---|---|---|---|---|---|---|---|---|---|
| SP vs. Left (2016-17) | 0.286 | 0.300 | 31.7% | 7.6% | 22.9% | 43.4% | SP vs. Left (2016-17) | 0.335 | 0.332 | 30.9% | 12.5% | 18.7% | 40.0% | ||
| SP vs. Right (2016-17) | 0.298 | 0.289 | 32.9% | 6.1% | 28.3% | 47.4% | SP vs. Right (2016-17) | 0.353 | 0.344 | 30.0% | 9.4% | 14.9% | 47.8% | ||
Pitcher Grind Down
| Jacob deGrom | |||||||||
 | FanDuel | DraftKings | FantasyDraft | ||||||
| Salary: | $11,200 | Salary: | $12,900 | Salary: | $25,200 | ||||
| Salary Rank: | 2 of 30 | Salary Rank: | 2 of 30 | Salary Rank: | 2 of 30 | ||||
| Stats | Starts | SIERA | ERA | K% | BB% | GB% | HC% | SC% | |
|---|---|---|---|---|---|---|---|---|---|
| 2016 | 24 | 3.66 | 3.04 | 23.7% | 6.0% | 45.6% | 31.3% | 19.0% | |
| 2017 | 20 | 3.60 | 3.30 | 27.9% | 7.7% | 45.1% | 33.5% | 20.3% | |
| L30 | 5 | 3.20 | 2.21 | 28.3% | 3.6% | 40.9% | 29.8% | 18.1% | |
DeGrom is arguably the most talented pitcher in the early slate, but he draws a difficult matchup against the Mariners on the road. The first thing that stands out here is the Vegas line. The Mets are barely favored and the over/under is set at 9.0 runs. Vegas is right more often than not, which gives me pause when it comes to deGrom. He still has massive strikeout upside, but I’d rather go with Rich Hill at home.
Quick Breakdown: DeGrom is still viable in tournaments, but he seems overpriced in this matchup.
| Yovani Gallardo | |||||||||
 | FanDuel | DraftKings | FantasyDraft | ||||||
| Salary: | $5,800 | Salary: | $6,700 | Salary: | $13,200 | ||||
| Salary Rank: | 28 of 30 | Salary Rank: | 17 of 30 | Salary Rank: | 15 of 30 | ||||
| Stats | Starts | SIERA | ERA | K% | BB% | GB% | HC% | SC% | |
|---|---|---|---|---|---|---|---|---|---|
| 2016 | 23 | 5.34 | 5.42 | 16.2% | 11.6% | 43.2% | 27.5% | 18.5% | |
| 2017 | 15 | 4.99 | 5.58 | 17.3% | 9.9% | 45.8% | 34.1% | 19.8% | |
| L30 | 1 | 4.73 | 2.70 | 22.2% | 13.0% | 45.7% | 34.3% | 34.3% | |
Gallardo is not a pitcher that we need to spend a lot of time on. We know what we are going to get from him. He doesn’t strike many batters out and his main goal is to pitch five or more innings in hopes that his team can pick up the win. I know the Mets are in free-fall mode, but I try to avoid bad pitchers whenever possible. We can find better options in cash games and tournaments.
Quick Breakdown: Avoid Gallardo in all formats.
Batter Grind Down
NY Mets
The Mets have given up on their season and it will be interesting to see what they do over the next couple of months. We could see them rest their veterans in order to make room for some prospects. As for their matchup today, they are in an excellent spot against Yovani Gallardo, who has allowed a .332+ xwOBA to both left and right-handed hitters.
Projected Lineup (Splits vs. RH Pitching)
| # | Player | Bats | wOBA | xwOBA | ISO | HC% | BB% | K% | GB% | FD Pos. | FD Sal. | DK Pos. | DK Sal. | FDRFT Pos. | FDRFT Sal. |
|---|---|---|---|---|---|---|---|---|---|---|---|---|---|---|---|
| 1 | Michael Conforto | LEFT | 0.428 | 0.398 | 0.312 | 42.1% | 14.8% | 22.0% | 35.5% | OF | $4,000 | OF | $4,900 | LF | $9,600 |
| 2 | Neil Walker | SWITCH | 0.360 | 0.368 | 0.226 | 34.7% | 9.4% | 13.6% | 35.4% | 2B | $3,000 | 2B | $3,500 | 2B | $6,900 |
| 3 | Yoenis Cespedes | RIGHT | 0.319 | 0.327 | 0.144 | 40.5% | 6.6% | 15.9% | 37.9% | OF | $3,700 | OF | $4,700 | LF | $9,300 |
| 4 | Jay Bruce | LEFT | 0.382 | 0.371 | 0.287 | 42.9% | 9.6% | 22.3% | 33.8% | OF | $3,600 | OF | $4,500 | RF | $8,700 |
| 5 | Asdrubal Cabrera | SWITCH | 0.310 | 0.356 | 0.164 | 35.8% | 11.6% | 14.7% | 45.0% | 3B | $3,200 | 2B/SS | $4,000 | SS | $7,600 |
| 6 | Wilmer Flores | RIGHT | 0.324 | 0.319 | 0.173 | 34.1% | 5.4% | 13.7% | 36.3% | 2B | $2,800 | 1B/3B | $4,000 | 3B | $7,800 |
| 7 | Curtis Granderson | LEFT | 0.330 | 0.331 | 0.238 | 32.5% | 13.6% | 21.9% | 31.4% | OF | $2,400 | OF | $3,400 | CF | $6,600 |
| 8 | Jose Reyes | SWITCH | 0.275 | 0.288 | 0.151 | 28.4% | 6.7% | 12.4% | 37.8% | SS | $2,800 | 3B/SS | $3,800 | SS | $7,500 |
| 9 | Travis d’Arnaud | RIGHT | 0.258 | 0.289 | 0.166 | 33.9% | 5.2% | 16.1% | 38.8% | C | $2,600 | C | $3,200 | C | $6,400 |
Elite Plays – Michael Conforto, Jay Bruce
Secondary Plays – Neil Walker, Asdrubal Cabrera
Stackability – YELLOW
Seattle
The Mariners draw one of the worst possible matchups, yet their implied run total seems high. Once again, maybe Vegas knows something that we don’t. Even though it’s an interesting spot to target Seattle’s offense, I’m not sure that I can pull the trigger. In the last two seasons, Jacob deGrom has held both left and right-handed hitters under a .300 xwOBA.
Projected Lineup (Splits vs. RH Pitching)
| # | Player | Bats | wOBA | xwOBA | ISO | HC% | BB% | K% | GB% | FD Pos. | FD Sal. | DK Pos. | DK Sal. | FDRFT Pos. | FDRFT Sal. |
|---|---|---|---|---|---|---|---|---|---|---|---|---|---|---|---|
| 1 | Jean Segura | RIGHT | 0.357 | 0.289 | 0.131 | 26.4% | 3.2% | 17.3% | 57.5% | SS | $3,000 | SS | $3,300 | SS | $6,600 |
| 2 | Ben Gamel | LEFT | 0.355 | 0.311 | 0.130 | 26.5% | 9.3% | 23.8% | 38.8% | OF | $2,700 | OF | $3,500 | RF | $6,900 |
| 3 | Robinson Cano | LEFT | 0.360 | 0.388 | 0.240 | 38.3% | 9.6% | 10.7% | 53.9% | 2B | $2,800 | 2B | $3,800 | 2B | $7,600 |
| 4 | Nelson Cruz | RIGHT | 0.364 | 0.365 | 0.243 | 37.9% | 7.3% | 21.1% | 43.2% | OF | $3,200 | OF | $3,500 | RF | $6,800 |
| 5 | Kyle Seager | LEFT | 0.322 | 0.375 | 0.182 | 38.5% | 8.4% | 15.8% | 32.1% | 3B | $3,400 | 3B | $3,400 | 3B | $6,800 |
| 6 | Danny Valencia | RIGHT | 0.300 | 0.272 | 0.136 | 24.7% | 6.1% | 26.4% | 50.0% | 1B | $3,000 | 1B | $2,700 | 3B | $5,400 |
| 7 | Mitch Haniger | RIGHT | 0.360 | 0.318 | 0.185 | 36.0% | 11.4% | 23.8% | 42.9% | OF | $2,400 | OF | $2,800 | LF | $5,400 |
| 8 | Jarrod Dyson | LEFT | 0.315 | 0.286 | 0.142 | 18.2% | 7.7% | 16.2% | 42.7% | OF | $2,300 | OF | $2,700 | CF | $5,400 |
| 9 | Mike Zunino | RIGHT | 0.310 | 0.307 | 0.233 | 38.6% | 6.7% | 39.2% | 28.7% | C | $2,400 | C | $3,200 | C | $6,400 |
Elite Plays – None
Secondary Plays – Jean Segura, Robinson Cano, Nelson Cruz, Kyle Seager
Stackability – ORANGE / YELLOW
Houston at Detroit – 6:10 PM ET
| Houston | Detroit | ||||||||||||||
 | Collin McHugh |  | Matt Boyd | ||||||||||||
| RIGHT | LEFT | ||||||||||||||
| Vegas Moneyline | Vegas Over/Under | ||||||||||||||
| HOU-106 | 10.5 | ||||||||||||||
| Stats | wOBA | xwOBA | HC% | BB% | K% | GB% | Stats | wOBA | xwOBA | HC% | BB% | K% | GB% | ||
|---|---|---|---|---|---|---|---|---|---|---|---|---|---|---|---|
| SP vs. Left (2016-17) | 0.349 | 0.297 | 27.5% | 7.8% | 22.9% | 43.2% | SP vs. Left (2016-17) | 0.285 | 0.298 | 22.8% | 7.3% | 15.5% | 55.4% | ||
| SP vs. Right (2016-17) | 0.331 | 0.294 | 32.8% | 6.0% | 21.5% | 38.5% | SP vs. Right (2016-17) | 0.352 | 0.330 | 36.1% | 8.1% | 18.6% | 37.1% | ||
Pitcher Grind Down
| Collin McHugh | |||||||||
 | FanDuel | DraftKings | FantasyDraft | ||||||
| Salary: | $7,200 | Salary: | $7,500 | Salary: | $15,000 | ||||
| Salary Rank: | 16 of 30 | Salary Rank: | 11 of 30 | Salary Rank: | 10 of 30 | ||||
| Stats | Starts | SIERA | ERA | K% | BB% | GB% | HC% | SC% | |
|---|---|---|---|---|---|---|---|---|---|
| 2016 | 33 | 4.02 | 4.34 | 22.2% | 6.8% | 41.3% | 30.2% | 20.0% | |
| 2017 | 1 | 5.91 | 7.71 | 19.1% | 9.5% | 14.3% | 35.7% | 14.3% | |
| L30 | 1 | 5.95 | 7.71 | 19.1% | 9.5% | 14.3% | 35.7% | 14.3% | |
This game is in no man’s land. It isn’t included in the early-only slate and it isn’t included in the main slate. The only way to take players from this game is to play the all-day slate. McHugh is making his second start of the season. He has bounced in and out of the rotation over the last few years, but comes into this game as an underdog with the over/under set at 10.5 runs.
Quick Breakdown: McHugh doesn’t have enough strikeout upside to warrant consideration.
| Matt Boyd | |||||||||
 | FanDuel | DraftKings | FantasyDraft | ||||||
| Salary: | $6,400 | Salary: | $5,200 | Salary: | $10,200 | ||||
| Salary Rank: | 23 of 30 | Salary Rank: | 28 of 30 | Salary Rank: | 26 of 30 | ||||
| Stats | Starts | SIERA | ERA | K% | BB% | GB% | HC% | SC% | |
|---|---|---|---|---|---|---|---|---|---|
| 2016 | 18 | 4.38 | 4.53 | 19.9% | 7.0% | 38.1% | 30.0% | 19.2% | |
| 2017 | 13 | 5.19 | 5.48 | 15.6% | 9.1% | 43.2% | 38.7% | 19.6% | |
| L30 | 2 | 4.37 | 4.50 | 22.0% | 8.0% | 39.4% | 20.6% | 35.3% | |
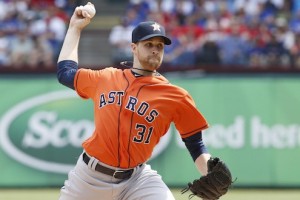
Boyd has been one of the easiest pitchers in baseball to avoid this season. He currently owns a 5.16 SIERA with a strikeout rate of 16% and a hard contact rate of 39%. It’s not a great combination when you are a fly-ball pitcher and you can’t strike anyone out or induce soft contact. He is an easy fade tonight against the Astros, who are one of the best offenses in baseball against southpaws.
Quick Breakdown: Avoid the Boyd.
Batter Grind Down
Houston
If you are playing in the all-day slate, you might want to consider stacking the Astros. They draw one of the top matchups on the schedule. Since the start of last season, Matt Boyd has allowed a .330 xwOBA with a 36% hard contact rate to right-handed hitters. Load up on the righties in this lineup and don’t be afraid to stack them in cash games and tournaments.
Projected Lineup (Splits vs. LH Pitching)
| # | Player | Bats | wOBA | xwOBA | ISO | HC% | BB% | K% | GB% | FD Pos. | FD Sal. | DK Pos. | DK Sal. | FDRFT Pos. | FDRFT Sal. |
|---|---|---|---|---|---|---|---|---|---|---|---|---|---|---|---|
| 1 | Jose Altuve | RIGHT | 0.428 | 0.338 | 0.231 | 24.7% | 10.7% | 10.7% | 48.1% | 2B | $4,500 | 2B | $5,700 | 2B | $11,100 |
| 2 | Josh Reddick | LEFT | 0.306 | 0.313 | 0.036 | 17.8% | 6.6% | 18.0% | 34.1% | OF | $3,400 | OF | $4,600 | RF | $9,000 |
| 3 | Yuli Gurriel | RIGHT | 0.281 | 0.296 | 0.153 | 35.3% | 4.7% | 14.2% | 51.8% | 1B | $3,500 | 1B | $4,600 | 1B | $9,000 |
| 4 | Evan Gattis | RIGHT | 0.288 | 0.357 | 0.210 | 30.8% | 7.4% | 16.2% | 40.4% | C | $2,700 | C | $4,100 | C | $8,100 |
| 5 | Carlos Beltran | SWITCH | 0.230 | 0.250 | 0.101 | 32.1% | 4.7% | 28.2% | 33.9% | OF | $3,300 | OF | $4,100 | RF | $8,000 |
| 6 | Marwin Gonzalez | SWITCH | 0.359 | 0.267 | 0.243 | 23.2% | 9.5% | 21.4% | 51.8% | SS | $3,700 | 3B/OF | $4,500 | 1B | $8,800 |
| 7 | Brian McCann | LEFT | 0.349 | 0.355 | 0.254 | 22.8% | 10.5% | 13.2% | 50.9% | C | $2,800 | C | $3,800 | C | $7,600 |
| 8 | Alex Bregman | RIGHT | 0.382 | 0.362 | 0.184 | 24.3% | 12.7% | 13.7% | 24.7% | 3B | $3,100 | 3B | $4,200 | 3B | $8,100 |
| 9 | Jake Marisnick | RIGHT | 0.326 | 0.274 | 0.179 | 19.6% | 8.0% | 29.3% | 27.9% | OF | $2,300 | OF | $3,600 | CF | $7,200 |
Elite Plays – Jose Altuve, Evan Gattis
Secondary Plays – Josh Reddick, Yuli Gurriel, Carlos Beltran, Marwin Gonzalez
Stackability – YELLOW / GREEN
Detroit
It’s a close race between the Tigers and Blue Jays when it comes to the most frustrating offense in fantasy baseball. These two seem to let us down far more often than other teams. Detroit draws another favorable matchup tonight, as they square off against Collin McHugh, who has had reverse splits throughout his career. A Tigers’ stack isn’t out of the question, but don’t say I didn’t warn you.
Projected Lineup (Splits vs. RH Pitching)
| # | Player | Bats | wOBA | xwOBA | ISO | HC% | BB% | K% | GB% | FD Pos. | FD Sal. | DK Pos. | DK Sal. | FDRFT Pos. | FDRFT Sal. |
|---|---|---|---|---|---|---|---|---|---|---|---|---|---|---|---|
| 1 | Ian Kinsler | RIGHT | 0.308 | 0.314 | 0.119 | 34.4% | 10.1% | 12.2% | 33.0% | 2B | $3,500 | 2B | $3,700 | 2B | $7,200 |
| 2 | Alex Avila | LEFT | 0.391 | 0.430 | 0.226 | 54.0% | 16.7% | 30.3% | 36.3% | C | $2,200 | 1B/C | $3,100 | C | $6,000 |
| 3 | Justin Upton | RIGHT | 0.356 | 0.353 | 0.228 | 43.1% | 12.0% | 27.3% | 36.5% | OF | $3,700 | OF | $3,900 | LF | $7,800 |
| 4 | Miguel Cabrera | RIGHT | 0.311 | 0.390 | 0.179 | 46.4% | 10.4% | 20.1% | 41.1% | 1B | $3,600 | 1B | $3,400 | 1B | $6,600 |
| 5 | Nick Castellanos | RIGHT | 0.300 | 0.337 | 0.150 | 46.2% | 7.6% | 25.6% | 40.9% | 3B | $2,800 | 3B | $3,500 | 3B | $6,900 |
| 6 | Victor Martinez | SWITCH | 0.305 | 0.368 | 0.139 | 42.9% | 9.2% | 13.5% | 40.1% | C | $3,000 | 1B | $3,200 | 1B | $6,400 |
| 7 | Mikie Mahtook | RIGHT | 0.339 | 0.311 | 0.138 | 35.6% | 5.0% | 21.8% | 48.6% | OF | $3,000 | OF | $3,200 | CF | $6,300 |
| 8 | Alex Presley | LEFT | 0.362 | 0.341 | 0.107 | 39.4% | 8.5% | 16.0% | 49.3% | OF | $2,900 | OF | $3,100 | LF | $6,000 |
| 9 | Jose Iglesias | RIGHT | 0.277 | 0.247 | 0.101 | 29.3% | 4.3% | 14.2% | 54.2% | SS | $2,500 | SS | $3,200 | SS | $6,400 |