MLB Grind Down: Thursday, July 26th

Jump to Page 1 2 3
The RotoGrinders MLB Grind Down will give you an in-depth analysis into the upcoming MLB schedule. This article will break down the numbers for every single game and give you analysis on which trends you can exploit. While matchups are a major factor in daily fantasy baseball, there are plenty of other factors to consider such as injuries, weather, and salaries.
The analysis should point you in the right direction, but it is still up to you to decipher the information and make your own selections. No sport has more variance than baseball. The best choice is not always the right choice but following the trends will win you money over time.
Note: As always, if you want to try a new DFS site, be sure to click through a RotoGrinders link and use our DraftKings promo code, FanDuel promo code, and FantasyDraft promo code to receive the best perks in the industry.

Stackability Rating System:
GREEN – A viable full stack in cash games and GPPs.
YELLOW – A viable mini-stack in cash games and full stack in GPPs.
ORANGE – A viable stack in large field GPPs.
RED – Not a recommended stack for cash games or GPPs.
Implied Run Totals
Ballpark Ratings
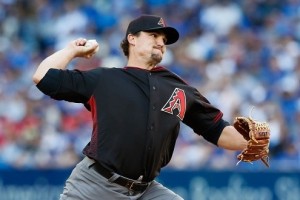
Arizona at Chicago Cubs – 2:20 PM ET
| Arizona | Chicago Cubs | ||||||||||||||
 | Zack Godley |  | Tyler Chatwood | ||||||||||||
| RIGHT | RIGHT | ||||||||||||||
| Vegas Moneyline | Vegas Over/Under | ||||||||||||||
| CHC-110 | |||||||||||||||
| Stats | wOBA | xwOBA | HC% | aEV | K% | GB% | Stats | wOBA | xwOBA | HC% | aEV | K% | GB% | ||
|---|---|---|---|---|---|---|---|---|---|---|---|---|---|---|---|
| SP vs. Left (2016-17) | 0.340 | 0.352 | 34.4% | 87.1 | 21.2% | 59.4% | SP vs. Left (2016-17) | 0.390 | 0.400 | 34.4% | 88.4 | 15.9% | 50.0% | ||
| SP vs. Right (2016-17) | 0.333 | 0.360 | 39.1% | 89.3 | 24.6% | 43.1% | SP vs. Right (2016-17) | 0.284 | 0.335 | 23.2% | 84.6 | 22.4% | 61.7% | ||
Pitcher Grind Down
| Zack Godley | |||||||||||
 | FanDuel | DraftKings | FantasyDraft | ||||||||
| Salary: | $8,700 | Salary: | $8,200 | Salary: | |||||||
| Salary Rank: | 4 of 22 | Salary Rank: | 7 of 22 | Salary Rank: | |||||||
| Stats | Starts | SIERA | ERA | K% | BB% | GB% | HC% | SC% | aFV | SwS% | |
|---|---|---|---|---|---|---|---|---|---|---|---|
| 2017 | 25 | 3.67 | 3.37 | 26.3% | 8.5% | 55.3% | 32.2% | 18.6% | 91.9 | 13.3% | |
| 2018 | 20 | 4.34 | 4.65 | 22.9% | 11.5% | 51.1% | 36.8% | 21.5% | 90.0 | 11.8% | |
| L14 | 2 | 3.88 | 3.27 | 26.5% | 10.2% | 48.3% | 38.7% | 16.1% | 90.1 | 18.0% | |
We have two early games on the schedule this fine Thursday. For our purposes here on the Grind Down, we’ll cover the strategy for this early-only slate and then head over and look at the main slate. Godley’s command has been an issue this season, but the rest of his numbers are still appealing. In 20 starts, he has a strikeout rate of 23% and a ground ball rate of 51%. Over his last two starts, his swinging strike rate was 18%, so perhaps he has found something recently. We don’t have a total for this game at the time of writing this, but the wind looks like it’ll be blowing out to right field at 10 MPH. Those aren’t exactly the best pitching conditions, but they could certainly be worse.
Quick Breakdown: Godley is viable thanks to a lack of pitching options in the early slate.
| Tyler Chatwood | |||||||||||
 | FanDuel | DraftKings | FantasyDraft | ||||||||
| Salary: | $5,800 | Salary: | $6,300 | Salary: | |||||||
| Salary Rank: | 20 of 22 | Salary Rank: | 15 of 22 | Salary Rank: | |||||||
| Stats | Starts | SIERA | ERA | K% | BB% | GB% | HC% | SC% | aFV | SwS% | |
|---|---|---|---|---|---|---|---|---|---|---|---|
| 2017 | 25 | 4.78 | 4.69 | 19.0% | 12.2% | 58.1% | 29.1% | 22.1% | 94.7 | 9.9% | |
| 2018 | 18 | 6.02 | 4.84 | 18.8% | 19.0% | 54.5% | 30.0% | 18.2% | 93.1 | 8.1% | |
| L14 | 2 | 7.58 | 3.48 | 8.7% | 19.6% | 50.0% | 32.3% | 16.1% | 93.2 | 6.3% | |
Chatwood’s season has been a grind. He’s never had the best control, but to sustain a 19% walk rate throughout the course of the season and not lose your job in the starting rotation is impressive. He does have an ability to generate ground balls, but with a low strikeout rate, he’s constantly putting himself at the mercy of BABIP. There aren’t a lot of positives here outside of a matchup against the Diamondbacks, whose projected lineup has an average strikeout rate of 28% against right-handed pitching this season.
Quick Breakdown: Of the four pitchers in the early slate, I’d rank Chatwood third.
Batter Grind Down
Arizona
The Diamondbacks draw a favorable matchup against Tyler Chatwood and they get to face him in Wrigley with the wind blowing out to right field. In terms of fantasy appeal, I’d rank their offense as my second favorite behind the Angels. With Chatwood’s high walk rate, the Diamondbacks should put plenty of runners in scoring position. In terms of splits, he has allowed a .352 xwOBA to lefties and a .360 xwOBA to righties this season. The only downside is that Chatwood is a high ground ball pitcher and this Diamondbacks’ lineup is loaded with high ground ball hitters.
Projected Lineup (Splits vs. RH Pitching)
| # | Player | Bats | xwOBA | aEV | ISO | HC% | BB% | K% | GB% | FD Pos. | FD Sal. | DK Pos. | DK Sal. | FDRFT Pos. | FDRFT Sal. |
|---|---|---|---|---|---|---|---|---|---|---|---|---|---|---|---|
| 1 | Jon Jay | LEFT | 0.326 | 84.3 | 0.107 | 37.8% | 4.7% | 14.8% | 56.2% | OF | $3,000 | OF | $3,900 | N/A | N/A |
| 2 | Paul Goldschmidt | RIGHT | 0.365 | 90.8 | 0.217 | 46.8% | 12.5% | 29.5% | 41.0% | 1B | $4,200 | 1B | $4,900 | N/A | N/A |
| 3 | David Peralta | LEFT | 0.370 | 92.2 | 0.244 | 48.2% | 8.1% | 18.8% | 48.5% | OF | $3,500 | OF | $5,200 | N/A | N/A |
| 4 | A.J. Pollock | RIGHT | 0.399 | 89.7 | 0.263 | 44.2% | 7.4% | 20.3% | 40.4% | OF | $4,000 | OF | $5,400 | N/A | N/A |
| 5 | Jake Lamb | LEFT | 0.348 | 88.7 | 0.149 | 45.5% | 11.3% | 24.9% | 50.9% | 3B | $3,000 | 3B | $4,200 | N/A | N/A |
| 6 | Ketel Marte | SWITCH | 0.304 | 88.0 | 0.129 | 30.1% | 7.8% | 15.2% | 53.7% | 2B | $3,000 | 2B/SS | $4,000 | N/A | N/A |
| 7 | Daniel Descalso | LEFT | 0.359 | 88.7 | 0.210 | 41.2% | 16.5% | 23.9% | 28.7% | 2B | $2,700 | 2B/3B | $4,100 | N/A | N/A |
| 8 | Alex Avila | LEFT | 0.337 | 92.1 | 0.139 | 54.9% | 13.4% | 42.9% | 37.3% | C | $2,000 | C | $3,200 | N/A | N/A |
| 9 | Zack Godley | RIGHT | 0.098 | 56.6 | 0.000 | 0.0% | 5.0% | 60.0% | 33.3% | P | $8,700 | P | $8,200 | N/A | N/A |
| Team Averages | 0.323 | 85.7 | 0.162 | 38.7% | 9.6% | 27.8% | 43.3% |
Elite Plays – Paul Goldschmidt, A.J. Pollock
Secondary Plays – Jon Jay, David Peralta, Jake Lamb, Daniel Descalso
Stackability – YELLOW
Chicago Cubs
The Cubs are playing at home with the wind blowing out to right field. They know how to take advantage of this wind better than anyone. With that said, Zack Godley owns above-average strikeout and ground ball rates, so he has the skill set needed to pitch well in these conditions. Most notably, Godley’s ground ball rate is 59% when facing a left-handed hitter, compared to only 43% against righties. Even though this looks like a good spot on paper, the Cubs are my third favorite offense to target in this two-game early slate.
Projected Lineup (Splits vs. RH Pitching)
| # | Player | Bats | xwOBA | aEV | ISO | HC% | BB% | K% | GB% | FD Pos. | FD Sal. | DK Pos. | DK Sal. | FDRFT Pos. | FDRFT Sal. |
|---|---|---|---|---|---|---|---|---|---|---|---|---|---|---|---|
| 1 | Anthony Rizzo | LEFT | 0.392 | 90.9 | 0.190 | 35.3% | 12.3% | 9.6% | 38.4% | 1B | $3,800 | 1B | $5,000 | N/A | N/A |
| 2 | Albert Almora | RIGHT | 0.271 | 86.7 | 0.109 | 30.3% | 5.5% | 19.4% | 50.6% | OF | $2,300 | OF | $3,600 | N/A | N/A |
| 3 | Jason Heyward | LEFT | 0.364 | 89.3 | 0.153 | 33.3% | 9.3% | 9.7% | 42.2% | OF | $3,200 | OF | $4,500 | N/A | N/A |
| 4 | Javier Baez | RIGHT | 0.341 | 90.4 | 0.261 | 38.7% | 3.1% | 28.4% | 43.5% | 2B | $4,000 | 2B/SS | $5,200 | N/A | N/A |
| 5 | Ian Happ | SWITCH | 0.371 | 90.8 | 0.228 | 43.4% | 19.0% | 34.1% | 34.3% | OF | $2,900 | OF | $4,700 | N/A | N/A |
| 6 | Kyle Schwarber | LEFT | 0.388 | 90.1 | 0.294 | 43.1% | 16.6% | 25.6% | 41.4% | OF | $3,400 | OF | $4,400 | N/A | N/A |
| 7 | Willson Contreras | RIGHT | 0.314 | 87.6 | 0.156 | 31.9% | 8.0% | 20.1% | 49.7% | C | $3,000 | C | $4,100 | N/A | N/A |
| 8 | Addison Russell | RIGHT | 0.300 | 86.6 | 0.100 | 32.6% | 8.9% | 21.3% | 40.9% | SS | $3,100 | SS | $3,600 | N/A | N/A |
| 9 | Tyler Chatwood | RIGHT | 0.145 | 73.3 | 0.000 | 5.6% | 0.0% | 21.7% | 71.4% | P | $5,800 | P | $6,300 | N/A | N/A |
| Team Averages | 0.321 | 87.3 | 0.166 | 32.7% | 9.2% | 21.1% | 45.8% |
Elite Plays – None
Secondary Plays – Anthony Rizzo, Jason Heyward, Javier Baez, Ian Happ
Stackability – YELLOW
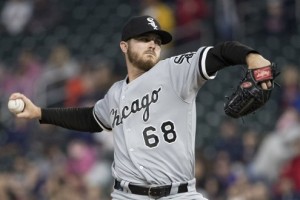
Chicago White Sox at LA Angels – 4:07 PM ET
| Chicago White Sox | LA Angels | ||||||||||||||
 | Dylan Covey |  | Nick Tropeano | ||||||||||||
| RIGHT | RIGHT | ||||||||||||||
| Vegas Moneyline | Vegas Over/Under | ||||||||||||||
| LAA-185 | 9.0 | ||||||||||||||
| Stats | wOBA | xwOBA | HC% | aEV | K% | GB% | Stats | wOBA | xwOBA | HC% | aEV | K% | GB% | ||
|---|---|---|---|---|---|---|---|---|---|---|---|---|---|---|---|
| SP vs. Left (2016-17) | 0.331 | 0.338 | 38.5% | 89.4 | 19.5% | 54.2% | SP vs. Left (2016-17) | 0.355 | 0.367 | 41.4% | 88.8 | 17.8% | 39.1% | ||
| SP vs. Right (2016-17) | 0.296 | 0.347 | 32.0% | 89.4 | 13.6% | 60.8% | SP vs. Right (2016-17) | 0.311 | 0.343 | 42.4% | 90.1 | 21.9% | 31.8% | ||
Pitcher Grind Down
| Dylan Covey | |||||||||||
 | FanDuel | DraftKings | FantasyDraft | ||||||||
| Salary: | $6,500 | Salary: | $6,800 | Salary: | |||||||
| Salary Rank: | 16 of 22 | Salary Rank: | 13 of 22 | Salary Rank: | |||||||
| Stats | Starts | SIERA | ERA | K% | BB% | GB% | HC% | SC% | aFV | SwS% | |
|---|---|---|---|---|---|---|---|---|---|---|---|
| 2017 | 12 | 5.64 | 7.71 | 13.3% | 11.0% | 48.5% | 36.5% | 18.0% | 92.6 | 6.2% | |
| 2018 | 12 | 4.55 | 4.95 | 16.9% | 9.9% | 57.4% | 35.4% | 18.0% | 94.0 | 7.3% | |
| L14 | 2 | 3.87 | 2.70 | 18.2% | 7.3% | 56.1% | 26.8% | 17.1% | 94.6 | 8.8% | |
If you’ve been able to figure Covey out this season, you have probably won a lot of money on the slates that he has pitched. He opened the year with a nice stretch of starts and we all started to believe that he wasn’t a bad pitcher. He followed those up with an atrocious run of starts where he was one of the most hittable pitchers in baseball. Out of nowhere, he pitched a gem against the Mariners his last time out, nearly completing the complete game shutout. I have no idea what to expect from Covey today, but he’s not going to be featured in any of my lineups.
Quick Breakdown: Avoid Covey in all formats.
| Nick Tropeano | |||||||||||
 | FanDuel | DraftKings | FantasyDraft | ||||||||
| Salary: | $7,100 | Salary: | $7,400 | Salary: | |||||||
| Salary Rank: | 12 of 22 | Salary Rank: | 10 of 22 | Salary Rank: | |||||||
| Stats | Starts | SIERA | ERA | K% | BB% | GB% | HC% | SC% | aFV | SwS% | |
|---|---|---|---|---|---|---|---|---|---|---|---|
| 2018 | 11 | 4.72 | 4.58 | 19.9% | 9.8% | 35.5% | 41.9% | 14.0% | 90.3 | 11.7% | |
| L14 | 1 | 5.55 | 1.80 | 22.7% | 18.2% | 38.5% | 15.4% | 15.4% | 91.1 | 13.3% | |
Tropeano isn’t a pitcher that I want to trust, but we don’t have many options here in this early slate. One has a massive walk rate and one has been more inconsistent than anyone this season. Even though Tropeano isn’t the most skilled pitcher around, at least we know what we can expect from him. In 11 starts this season, he has a 20% strikeout rate with a swinging strike rate of 11.7%. The reasoning behind the pick is more about the matchup and the ballpark. The White Sox projected lineup has an average k-rate of 24% against right-handed pitching.
Quick Breakdown: In a full slate, I wouldn’t play Tropeano, but he’s certainly viable in this two-game slate.
Batter Grind Down
Chicago White Sox
The White Sox are playing on the road in a pitcher-friendly ballpark and have the lowest implied run total of the four early teams in action today. With that said, they are going to be low owned in tournaments and it’s not like we typically avoid hitters against Nick Tropeano. On the season, he has allowed a .367 xwOBA to lefties and a .343 xwOBA to righties. Jose Abreu has been swinging a hot bat recently and has much better numbers when facing a fly-ball pitcher. Yoan Moncada brings speed and power to the mix batting leadoff. Both are elite tournament options.
Projected Lineup (Splits vs. RH Pitching)
| # | Player | Bats | xwOBA | aEV | ISO | HC% | BB% | K% | GB% | FD Pos. | FD Sal. | DK Pos. | DK Sal. | FDRFT Pos. | FDRFT Sal. |
|---|---|---|---|---|---|---|---|---|---|---|---|---|---|---|---|
| 1 | Yoan Moncada | SWITCH | 0.356 | 92.8 | 0.207 | 40.2% | 9.6% | 34.1% | 29.8% | 2B | $3,300 | 2B | $4,300 | N/A | N/A |
| 2 | Yolmer Sanchez | SWITCH | 0.315 | 85.6 | 0.174 | 28.5% | 5.2% | 17.4% | 47.1% | 3B | $2,600 | 3B | $3,600 | N/A | N/A |
| 3 | Jose Abreu | RIGHT | 0.357 | 90.9 | 0.172 | 33.5% | 5.8% | 17.8% | 44.6% | 1B | $3,400 | 1B | $3,800 | N/A | N/A |
| 4 | Avisail Garcia | RIGHT | 0.387 | 92.9 | 0.272 | 42.1% | 1.7% | 23.3% | 43.2% | OF | $2,800 | OF | $4,300 | N/A | N/A |
| 5 | Daniel Palka | LEFT | 0.312 | 93.0 | 0.241 | 38.3% | 5.1% | 36.5% | 40.9% | OF | $2,700 | OF | $4,000 | N/A | N/A |
| 6 | Omar Narvaez | LEFT | 0.345 | 86.2 | 0.154 | 26.4% | 9.0% | 17.4% | 40.0% | C | $2,100 | C | $3,300 | N/A | N/A |
| 7 | Leury Garcia | SWITCH | 0.286 | 86.1 | 0.097 | 27.3% | 3.5% | 25.4% | 53.1% | OF | $2,300 | OF | $3,700 | N/A | N/A |
| 8 | Nick Delmonico | LEFT | 0.334 | 87.9 | 0.078 | 24.4% | 10.3% | 17.9% | 40.2% | OF | $2,200 | OF | $3,400 | N/A | N/A |
| 9 | Tim Anderson | RIGHT | 0.281 | 85.5 | 0.161 | 26.1% | 6.6% | 25.7% | 48.6% | SS | $2,900 | SS | $3,900 | N/A | N/A |
| Team Averages | 0.330 | 89.0 | 0.173 | 31.9% | 6.3% | 23.9% | 43.1% |
Elite Plays – Yoan Moncada (GPP), Jose Abreu (GPP)
Secondary Plays – Yoan Moncada (Cash), Jose Abreu (Cash), Avisail Garcia
Stackability – ORANGE / YELLOW
LA Angels
The Angels get to face the Dr. Jekyll and Mr Hyde of pitchers tonight. Nobody ever knows which version of Dylan Covey is going to show up. When he’s on, he’s been an above-average pitcher. When he’s off, he’s been shelled on a regular basis. I’m going to trust the larger sample size here and will be siding with the Angels’ offense in this matchup. I always like when a pitcher throws primarily one type of pitch, as it allows us to dive into the splits in PlateIQ. Covey has thrown a sinker on 64% of his pitches this season. Here are the first five batters in the Angels’ lineup and how they have fared against sinkers this season — Kole Calhoun (.336 wOBA), Shohei Ohtani (.374 wOBA), Mike Trout (.430 wOBA), Justin Upton (.375 wOBA), and Albert Pujols (.394 wOBA).
Projected Lineup (Splits vs. RH Pitching)
| # | Player | Bats | xwOBA | aEV | ISO | HC% | BB% | K% | GB% | FD Pos. | FD Sal. | DK Pos. | DK Sal. | FDRFT Pos. | FDRFT Sal. |
|---|---|---|---|---|---|---|---|---|---|---|---|---|---|---|---|
| 1 | Kole Calhoun | LEFT | 0.315 | 88.3 | 0.174 | 37.4% | 5.8% | 24.7% | 49.7% | OF | $3,000 | OF | $3,800 | N/A | N/A |
| 2 | Shohei Ohtani | LEFT | 0.416 | 92.5 | 0.296 | 44.9% | 10.7% | 24.6% | 43.6% | OF | $3,100 | OF | $4,600 | N/A | N/A |
| 3 | Mike Trout | RIGHT | 0.441 | 92.0 | 0.301 | 47.0% | 20.3% | 19.7% | 34.5% | OF | $5,200 | OF | $6,000 | N/A | N/A |
| 4 | Justin Upton | RIGHT | 0.395 | 91.6 | 0.230 | 45.7% | 12.2% | 26.2% | 43.7% | OF | $3,400 | OF | $4,800 | N/A | N/A |
| 5 | Albert Pujols | RIGHT | 0.375 | 90.4 | 0.184 | 42.6% | 4.5% | 12.9% | 37.9% | 1B | $2,600 | 1B | $4,100 | N/A | N/A |
| 6 | Andrelton Simmons | RIGHT | 0.356 | 87.3 | 0.117 | 36.5% | 5.8% | 4.3% | 47.8% | SS | $2,800 | SS | $3,900 | N/A | N/A |
| 7 | Ian Kinsler | RIGHT | 0.327 | 85.7 | 0.194 | 32.6% | 7.8% | 9.7% | 38.5% | 2B | $3,400 | 2B | $3,900 | N/A | N/A |
| 8 | Martin Maldonado | RIGHT | 0.269 | 83.7 | 0.123 | 28.5% | 4.5% | 24.8% | 39.7% | C | $2,100 | C | $2,700 | N/A | N/A |
| 9 | David Fletcher | RIGHT | 0.254 | 80.8 | 0.043 | 18.0% | 2.1% | 14.9% | 25.6% | 3B | $3,000 | 3B | $3,300 | N/A | N/A |
| Team Averages | 0.350 | 88.0 | 0.185 | 37.0% | 8.2% | 18.0% | 40.1% |
Elite Plays – Kole Calhoun, Shohei Ohtani, Mike Trout, Justin Upton
Secondary Plays – Albert Pujols, Andrelton Simmons
Stackability – YELLOW / GREEN
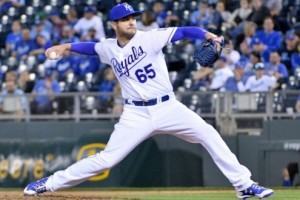
Kansas City at NY Yankees – 7:05 PM ET
| Kansas City | NY Yankees | ||||||||||||||
 | Jakob Junis |  | Sonny Gray | ||||||||||||
| RIGHT | RIGHT | ||||||||||||||
| Vegas Moneyline | Vegas Over/Under | ||||||||||||||
| NYY-280 | 9.5 | ||||||||||||||
| Stats | wOBA | xwOBA | HC% | aEV | K% | GB% | Stats | wOBA | xwOBA | HC% | aEV | K% | GB% | ||
|---|---|---|---|---|---|---|---|---|---|---|---|---|---|---|---|
| SP vs. Left (2016-17) | 0.345 | 0.338 | 41.4% | 89.3 | 18.4% | 39.7% | SP vs. Left (2016-17) | 0.338 | 0.369 | 40.0% | 89.2 | 20.4% | 44.4% | ||
| SP vs. Right (2016-17) | 0.340 | 0.357 | 42.1% | 89.0 | 24.2% | 40.7% | SP vs. Right (2016-17) | 0.341 | 0.311 | 29.4% | 89.1 | 21.8% | 50.0% | ||
Pitcher Grind Down
| Jakob Junis | |||||||||||
 | FanDuel | DraftKings | FantasyDraft | ||||||||
| Salary: | $6,100 | Salary: | $5,500 | Salary: | $11,200 | ||||||
| Salary Rank: | 19 of 22 | Salary Rank: | 20 of 22 | Salary Rank: | 16 of 22 | ||||||
| Stats | Starts | SIERA | ERA | K% | BB% | GB% | HC% | SC% | aFV | SwS% | |
|---|---|---|---|---|---|---|---|---|---|---|---|
| 2017 | 16 | 4.49 | 4.30 | 19.0% | 5.9% | 40.1% | 36.7% | 16.9% | 91.2 | 8.9% | |
| 2018 | 18 | 4.12 | 5.03 | 21.4% | 6.6% | 40.3% | 41.7% | 15.9% | 91.1 | 9.3% | |
| L14 | 1 | 2.99 | 2.25 | 35.3% | 11.8% | 66.7% | 33.3% | 22.2% | 92.1 | 9.1% | |
We kick off tonight’s nine-game slate with the Royals and Yankees in a game that could feature plenty of fireworks. Junis is a fly-ball pitcher that has allowed a 42% hard contact rate this season. It’s no surprise that he has allowed 24 home runs in only 18 starts. While anything can happen in baseball, I’ll side with the Yankees at home in one of the most home run-friendly ballparks in baseball.
Quick Breakdown: Avoid Junis in all formats.
| Sonny Gray | |||||||||||
 | FanDuel | DraftKings | FantasyDraft | ||||||||
| Salary: | $7,800 | Salary: | $8,200 | Salary: | $16,100 | ||||||
| Salary Rank: | 9 of 22 | Salary Rank: | 7 of 22 | Salary Rank: | 6 of 22 | ||||||
| Stats | Starts | SIERA | ERA | K% | BB% | GB% | HC% | SC% | aFV | SwS% | |
|---|---|---|---|---|---|---|---|---|---|---|---|
| 2017 | 27 | 4.08 | 3.55 | 22.6% | 8.4% | 52.8% | 28.0% | 16.8% | 93.0 | 11.9% | |
| 2018 | 19 | 4.36 | 5.34 | 21.2% | 9.8% | 47.6% | 34.1% | 16.9% | 93.3 | 10.2% | |
| L14 | 2 | 3.28 | 1.59 | 31.1% | 8.9% | 46.2% | 19.2% | 38.5% | 93.6 | 10.9% | |
Gray is a pitcher that I target more often than most. If you are a regular reader of the Grind Down, then you know that I’m infatuated with pitchers that have above-average ground ball and strikeout rates. Gray’s k-rate is down a little bit as a whole, but it has been trending upward over the last month of play. He’s cheap across the industry and he gets to face a Royals’ offense that has a higher strikeout rate against righties than most DFS players think. The only downside is that Gray has been terrible in this ballpark. In nine starts, he has an ERA close to 8.00 while only averaging seven fantasy points. He’s still one of the top pitchers on the board, but his splits at home keep me from hitting the lock button.
Quick Breakdown: Gray is an elite play in all formats.
Batter Grind Down
Kansas City
The Royals see a significant ballpark boost playing in New York. Despite the bizarre high totals that we continue to see in games being played in Kansas City, Yankee Stadium is a much better ballpark for offensive production. Additionally, the Royals will be low owned across the industry, so there are some positives. A matchup against Sonny Gray isn’t ideal, but he has allowed a .369 xwOBA to left-handed hitters. With the short porch in right field, it’s hard not to have some interest in the likes of Mike Moustakas and Lucas Duda, who both boast a .375+ xwOBA and a 43%+ hard contact rate against right-handed pitching this season.
Projected Lineup (Splits vs. RH Pitching)
| # | Player | Bats | xwOBA | aEV | ISO | HC% | BB% | K% | GB% | FD Pos. | FD Sal. | DK Pos. | DK Sal. | FDRFT Pos. | FDRFT Sal. |
|---|---|---|---|---|---|---|---|---|---|---|---|---|---|---|---|
| 1 | Whit Merrifield | RIGHT | 0.333 | 86.4 | 0.082 | 39.3% | 9.8% | 18.3% | 37.1% | 2B | $3,800 | 2B/OF | $3,900 | IF/OF | $7,700 |
| 2 | Rosell Herrera | SWITCH | 0.252 | 86.2 | 0.087 | 38.8% | 4.1% | 28.8% | 51.0% | OF | $2,500 | OF | $3,100 | 2B | $5,500 |
| 3 | Mike Moustakas | LEFT | 0.388 | 90.7 | 0.243 | 47.1% | 9.4% | 14.8% | 29.5% | 3B | $3,600 | 3B | $4,300 | 3B | $8,500 |
| 4 | Salvador Perez | RIGHT | 0.351 | 90.9 | 0.175 | 45.9% | 2.5% | 19.4% | 35.0% | C | $3,200 | C | $4,100 | C | $8,200 |
| 5 | Lucas Duda | LEFT | 0.378 | 89.9 | 0.192 | 43.4% | 8.1% | 24.8% | 25.5% | 1B | $2,900 | 1B | $3,800 | 1B | $7,600 |
| 6 | Jorge Bonifacio | RIGHT | 0.307 | 87.9 | 0.170 | 37.5% | 11.1% | 27.8% | 29.0% | OF | $3,000 | OF | $3,700 | RF | $7,500 |
| 7 | Alex Gordon | LEFT | 0.380 | 88.0 | 0.137 | 38.6% | 7.5% | 20.3% | 47.5% | OF | $2,200 | OF | $3,100 | LF | $5,500 |
| 8 | Brian Goodwin | LEFT | 0.320 | 89.9 | 0.167 | 35.1% | 11.6% | 34.8% | 45.9% | OF | $2,100 | OF | $3,500 | LF | $6,500 |
| 9 | Alcides Escobar | RIGHT | 0.271 | 83.6 | 0.053 | 33.5% | 4.9% | 11.6% | 45.5% | SS | $2,200 | SS | $2,800 | SS | $5,700 |
| Team Averages | 0.331 | 88.2 | 0.145 | 39.9% | 7.7% | 22.3% | 38.4% |
Elite Plays – Mike Moustakas (GPP), Lucas Duda (GPP)
Secondary Plays – Mike Moustakas (Cash), Lucas Duda (Cash)
Stackability – ORANGE
NY Yankees
The Yankees have the highest implied run total on the board and it’s not particularly close. They lead the majors in home runs, they are playing at home in a home run-friendly ballpark, and they are facing a pitcher that has more home runs allowed (24) than starts (18) this season. See what I’m getting at here? This is a great spot for a Yankees’ stack and I honestly can’t remember saying that for quite some time. Jakob Junis isn’t particularly effective against lefties or righties, so we can load up on batters from both sides of the plate.
Projected Lineup (Splits vs. RH Pitching)
| # | Player | Bats | xwOBA | aEV | ISO | HC% | BB% | K% | GB% | FD Pos. | FD Sal. | DK Pos. | DK Sal. | FDRFT Pos. | FDRFT Sal. |
|---|---|---|---|---|---|---|---|---|---|---|---|---|---|---|---|
| 1 | Brett Gardner | LEFT | 0.309 | 87.2 | 0.166 | 29.6% | 12.0% | 14.4% | 51.0% | OF | $3,200 | OF | $4,800 | LF | $9,200 |
| 2 | Aaron Judge | RIGHT | 0.403 | 96.2 | 0.272 | 49.1% | 12.6% | 30.7% | 45.1% | OF | $4,400 | OF | $5,600 | RF | $10,000 |
| 3 | Didi Gregorius | LEFT | 0.349 | 88.6 | 0.253 | 39.1% | 8.7% | 11.9% | 34.8% | SS | $3,500 | SS | $5,000 | SS | $9,900 |
| 4 | Giancarlo Stanton | RIGHT | 0.306 | 91.8 | 0.184 | 33.9% | 7.9% | 33.2% | 52.8% | OF | $4,200 | OF | $4,900 | RF | $9,200 |
| 5 | Aaron Hicks | SWITCH | 0.350 | 88.6 | 0.189 | 38.5% | 13.7% | 19.2% | 45.1% | OF | $3,300 | OF | $4,100 | CF | $8,200 |
| 6 | Gleyber Torres | RIGHT | 0.385 | 88.3 | 0.242 | 38.7% | 6.0% | 26.2% | 30.0% | 2B | $3,500 | 2B | $4,200 | 2B | $8,400 |
| 7 | Greg Bird | LEFT | 0.327 | 88.9 | 0.267 | 39.5% | 8.5% | 27.7% | 37.0% | 1B | $3,100 | 1B | $4,200 | 1B | $8,100 |
| 8 | Miguel Andujar | RIGHT | 0.347 | 89.6 | 0.182 | 36.1% | 4.0% | 17.3% | 50.0% | 3B | $3,400 | 3B | $4,100 | 3B | $8,100 |
| 9 | Austin Romine | RIGHT | 0.358 | 89.7 | 0.230 | 37.3% | 11.0% | 22.0% | 42.4% | C | $2,200 | C | $3,200 | C | $6,700 |
| Team Averages | 0.348 | 89.9 | 0.221 | 38.0% | 9.4% | 22.5% | 43.1% |
Elite Plays – Aaron Judge, Didi Gregorius, Giancarlo Stanton, Aaron Hicks
Secondary Plays – Brett Gardner, Gleyber Torres, Greg Bird
Stackability – GREEN
NY Mets at Pittsburgh – 7:05 PM ET
| NY Mets | Pittsburgh | ||||||||||||||
 | Steven Matz |  | Nick Kingham | ||||||||||||
| LEFT | RIGHT | ||||||||||||||
| Vegas Moneyline | Vegas Over/Under | ||||||||||||||
| PIT-155 | 8.5 | ||||||||||||||
| Stats | wOBA | xwOBA | HC% | aEV | K% | GB% | Stats | wOBA | xwOBA | HC% | aEV | K% | GB% | ||
|---|---|---|---|---|---|---|---|---|---|---|---|---|---|---|---|
| SP vs. Left (2016-17) | 0.308 | 0.290 | 11.6% | 83.3 | 17.8% | 68.7% | SP vs. Left (2016-17) | 0.348 | 0.357 | 31.5% | 88.1 | 15.5% | 40.4% | ||
| SP vs. Right (2016-17) | 0.330 | 0.332 | 38.0% | 88.7 | 21.2% | 44.6% | SP vs. Right (2016-17) | 0.260 | 0.288 | 37.2% | 90.4 | 29.5% | 44.2% | ||
Pitcher Grind Down
| Steven Matz | |||||||||||
 | FanDuel | DraftKings | FantasyDraft | ||||||||
| Salary: | $7,600 | Salary: | $6,300 | Salary: | $12,700 | ||||||
| Salary Rank: | 10 of 22 | Salary Rank: | 15 of 22 | Salary Rank: | 12 of 22 | ||||||
| Stats | Starts | SIERA | ERA | K% | BB% | GB% | HC% | SC% | aFV | SwS% | |
|---|---|---|---|---|---|---|---|---|---|---|---|
| 2017 | 13 | 4.71 | 6.08 | 16.1% | 6.4% | 47.1% | 32.9% | 21.9% | 93.1 | 7.1% | |
| 2018 | 19 | 4.35 | 3.65 | 20.4% | 8.8% | 50.2% | 31.9% | 17.1% | 93.2 | 8.3% | |
| L14 | 2 | 5.12 | 6.35 | 13.0% | 5.6% | 39.5% | 31.8% | 15.9% | 93.9 | 9.4% | |
Matz is one of the few highly-touted Mets’ pitchers that never quite lived up to expectations, although he’s still way ahead of Matt Harvey in that department. In 19 starts this season, Matz has a 4.35 SIERA with a strikeout rate of 20%. He checks into tonight’s game against the Pirates as a sizable underdog. Not only is run support an issue for Mets’ starters, but Matz has one of the worst strikeout matchups of the slate. The projected lineup for Pittsburgh has an average xwOBA of .334 with a k-rate of only 17% against left-handed pitching.
Quick Breakdown: Avoid Matz in all formats.
| Nick Kingham | |||||||||||
 | FanDuel | DraftKings | FantasyDraft | ||||||||
| Salary: | $8,500 | Salary: | $9,400 | Salary: | $17,600 | ||||||
| Salary Rank: | 5 of 22 | Salary Rank: | 4 of 22 | Salary Rank: | 5 of 22 | ||||||
| Stats | Starts | SIERA | ERA | K% | BB% | GB% | HC% | SC% | aFV | SwS% | |
|---|---|---|---|---|---|---|---|---|---|---|---|
| 2018 | 10 | 3.87 | 4.11 | 22.7% | 5.9% | 42.2% | 34.1% | 17.4% | 92.4 | 11.1% | |
| L14 | 2 | 3.45 | 3.55 | 24.5% | 6.1% | 55.9% | 20.6% | 26.5% | 92.3 | 7.5% | |
Kingham has pitched well in his first ten major league starts. He owns a 3.87 SIERA with a strikeout rate of 23% and a walk rate of 6%. There have been a couple of poor outings mixed in, but that’s to be expected from a rookie pitcher. I don’t want to rely too heavily on home/road splits, but he has averaged 22 fantasy points (DK scoring) at home and only 11 fantasy points on the road. He’s affordable across the industry and draws an exploitable matchup against the Mets, whose projected lineup has an average strikeout rate of 23% against right-handed pitching.
Quick Breakdown: Kingham is viable in all formats, although I prefer using him in tournaments.
Batter Grind Down
NY Mets
The Mets are sizable underdogs on the road, they are playing in a pitcher-friendly ballpark, and they are facing a talented young righty in Nick Kingham. While they will be low owned, that shouldn’t ever be your sole reasoning behind a pick. I will likely be avoiding this offense completely, but Kingham has allowed a .357 xwOBA to lefties this season if you want to give Brandon Nimmo, Asdrubal Cabrera, or Michael Conforto a look in tournaments.
Projected Lineup (Splits vs. RH Pitching)
| # | Player | Bats | xwOBA | aEV | ISO | HC% | BB% | K% | GB% | FD Pos. | FD Sal. | DK Pos. | DK Sal. | FDRFT Pos. | FDRFT Sal. |
|---|---|---|---|---|---|---|---|---|---|---|---|---|---|---|---|
| 1 | Brandon Nimmo | LEFT | 0.368 | 90.2 | 0.251 | 36.7% | 12.6% | 27.4% | 36.2% | OF | $3,200 | OF | $4,500 | LF | $9,100 |
| 2 | Asdrubal Cabrera | SWITCH | 0.370 | 90.0 | 0.238 | 43.9% | 8.0% | 20.4% | 40.5% | 2B | $3,100 | 2B | $4,100 | SS | $8,100 |
| 3 | Wilmer Flores | RIGHT | 0.321 | 86.6 | 0.215 | 35.3% | 7.5% | 9.3% | 37.6% | 1B | $2,700 | 1B/3B | $3,200 | 3B | $6,500 |
| 4 | Michael Conforto | LEFT | 0.357 | 87.8 | 0.157 | 36.0% | 17.3% | 20.9% | 37.9% | OF | $3,300 | OF | $4,200 | LF | $8,200 |
| 5 | Jose Bautista | RIGHT | 0.363 | 91.0 | 0.186 | 44.9% | 16.2% | 26.5% | 30.8% | OF | $2,800 | 3B/OF | $3,700 | IF/OF | $7,700 |
| 6 | Devin Mesoraco | RIGHT | 0.328 | 87.3 | 0.191 | 34.5% | 5.9% | 18.4% | 31.9% | C | $2,500 | C | $3,000 | C | $5,800 |
| 7 | Amed Rosario | RIGHT | 0.284 | 87.1 | 0.128 | 28.0% | 5.5% | 19.8% | 48.3% | SS | $2,700 | SS | $3,400 | SS | $6,300 |
| 8 | Matt den Dekker | LEFT | 0.165 | 83.8 | 0.000 | 22.2% | 11.1% | 38.9% | 22.2% | OF | $2,000 | OF | $3,000 | RF | $5,600 |
| 9 | Steven Matz | LEFT | 0.231 | 74.0 | 0.048 | 11.1% | 0.0% | 21.7% | 43.8% | P | $7,600 | P | $6,300 | P | $12,700 |
| Team Averages | 0.310 | 86.4 | 0.157 | 32.5% | 9.3% | 22.6% | 36.6% |
Elite Plays – None
Secondary Plays – Brandon Nimmo (GPP), Asdrubal Cabrera (GPP), Michael Conforto (GPP)
Stackability – ORANGE
Pittsburgh
The Pirates have quietly hit left-handed pitching well this season and have quietly won nine of their last ten games. Their matchup against Steven Matz is fairly predictable. He has been tough on lefties throughout his career, but has allowed a .332 xwOBA and a 38% hard contact rate to righties this season. He’s also the worst pitcher of the slate when it comes to holding runners. I have interest in any Pirates’ hitter that bats from the right side and has some speed. That list includes Josh Harrison and Starling Marte, who I don’t hesitate to list as elite plays.
Projected Lineup (Splits vs. LH Pitching)
| # | Player | Bats | xwOBA | aEV | ISO | HC% | BB% | K% | GB% | FD Pos. | FD Sal. | DK Pos. | DK Sal. | FDRFT Pos. | FDRFT Sal. |
|---|---|---|---|---|---|---|---|---|---|---|---|---|---|---|---|
| 1 | Josh Harrison | RIGHT | 0.332 | 86.9 | 0.103 | 38.8% | 4.8% | 14.5% | 34.7% | 2B | $2,800 | 2B | $3,300 | 2B | $6,600 |
| 2 | Starling Marte | RIGHT | 0.356 | 89.1 | 0.231 | 32.2% | 8.1% | 23.3% | 55.2% | OF | $3,900 | OF | $4,800 | CF | $8,600 |
| 3 | Gregory Polanco | LEFT | 0.300 | 84.3 | 0.219 | 33.3% | 10.7% | 25.0% | 30.0% | OF | $3,800 | OF | $4,500 | RF | $9,300 |
| 4 | Elias Diaz | RIGHT | 0.430 | 90.6 | 0.259 | 42.9% | 3.6% | 8.9% | 40.8% | C | $2,500 | C | $3,500 | C | $6,600 |
| 5 | David Freese | RIGHT | 0.352 | 90.9 | 0.027 | 37.9% | 9.4% | 22.4% | 56.9% | 3B | $2,200 | 1B/3B | $3,400 | 3B | $6,900 |
| 6 | Josh Bell | SWITCH | 0.328 | 89.9 | 0.139 | 27.9% | 14.7% | 21.1% | 39.3% | 1B | $3,200 | 1B | $4,200 | 1B | $8,400 |
| 7 | Jordan Luplow | RIGHT | 0.372 | 89.9 | 0.333 | 12.5% | 0.0% | 11.1% | 12.5% | OF | $2,200 | OF | $3,600 | LF | $7,300 |
| 8 | Jordy Mercer | RIGHT | 0.355 | 89.9 | 0.147 | 34.4% | 6.0% | 14.5% | 34.4% | SS | $2,300 | SS | $3,500 | SS | $6,700 |
| 9 | Nick Kingham | RIGHT | 0.179 | 70.9 | 0.000 | 20.0% | 0.0% | 14.3% | 100.0% | P | $8,500 | P | $9,400 | P | $17,600 |
| Team Averages | 0.334 | 86.9 | 0.162 | 31.1% | 6.4% | 17.2% | 44.9% |
Elite Plays – Josh Harrison, Starling Marte
Secondary Plays – Elias Diaz, David Freese, Jordan Luplow
Stackability – YELLOW
Tampa Bay at Baltimore – 7:05 PM ET
| Tampa Bay | Baltimore | ||||||||||||||
 | Hunter Wood |  | Alex Cobb | ||||||||||||
| RIGHT | RIGHT | ||||||||||||||
| Vegas Moneyline | Vegas Over/Under | ||||||||||||||
| BAL-100 | 9.0 | ||||||||||||||
| Stats | wOBA | xwOBA | HC% | aEV | K% | GB% | Stats | wOBA | xwOBA | HC% | aEV | K% | GB% | ||
|---|---|---|---|---|---|---|---|---|---|---|---|---|---|---|---|
| SP vs. Left (2016-17) | 0.341 | 0.247 | 35.3% | 80.9 | 27.6% | 43.8% | SP vs. Left (2016-17) | 0.372 | 0.366 | 34.4% | 88.1 | 18.5% | 40.9% | ||
| SP vs. Right (2016-17) | 0.248 | 0.314 | 40.9% | 84.6 | 14.3% | 50.0% | SP vs. Right (2016-17) | 0.376 | 0.359 | 32.8% | 90.1 | 12.0% | 56.2% | ||
Pitcher Grind Down
| Hunter Wood | |||||||||||
 | FanDuel | DraftKings | FantasyDraft | ||||||||
| Salary: | $5,500 | Salary: | $4,000 | Salary: | $8,000 | ||||||
| Salary Rank: | 21 of 22 | Salary Rank: | 22 of 22 | Salary Rank: | 18 of 22 | ||||||
| Stats | Starts | SIERA | ERA | K% | BB% | GB% | HC% | SC% | aFV | SwS% | |
|---|---|---|---|---|---|---|---|---|---|---|---|
| 2017 | 0 | 13.42 | 0.00 | 0.0% | 0.0% | 0.0% | 0.0% | 100.0% | 90.0 | 0.0% | |
| 2018 | 1 | 4.19 | 2.70 | 21.1% | 10.5% | 47.4% | 38.5% | 25.6% | 93.9 | 13.4% | |
| L14 | 1 | 3.79 | 2.57 | 29.0% | 12.9% | 29.4% | 33.3% | 38.9% | 95.1 | 17.9% | |
Wood will technically draw the start for the Rays, but this will be another bullpen start. It’s a bit frustrating too, as I really want to target as many pitchers as possible against the Orioles. They don’t have much in terms of talent and their offense has been reeling over the last month of play. With a limited floor and a limited ceiling, I can’t justify targeting Wood in a nine-game slate.
Quick Breakdown: Avoid Wood in all formats.
| Alex Cobb | |||||||||||
 | FanDuel | DraftKings | FantasyDraft | ||||||||
| Salary: | $6,000 | Salary: | $4,900 | Salary: | $9,500 | ||||||
| Salary Rank: | 17 of 21 | Salary Rank: | 19 of 21 | Salary Rank: | 15 of 21 | ||||||
| Stats | Starts | SIERA | ERA | K% | BB% | GB% | HC% | SC% | aFV | SwS% | |
|---|---|---|---|---|---|---|---|---|---|---|---|
| 2017 | 29 | 4.48 | 3.66 | 17.3% | 5.9% | 47.8% | 36.9% | 14.9% | 91.7 | 6.7% | |
| 2018 | 18 | 4.62 | 6.17 | 15.2% | 6.3% | 49.3% | 33.5% | 19.2% | 91.9 | 7.1% | |
| L14 | 2 | 4.76 | 2.38 | 14.9% | 6.4% | 42.9% | 25.0% | 22.2% | 91.7 | 6.6% | |
Many were furious that the Orioles game was postponed last night (shoutout to Kevin Roth for seeing the trouble ahead of time), but I know of at least one person that was ecstatic. The three home runs given up by Dylan Bundy were all erased from the record books. Cobb will take his turn in the rotation tonight. He’s had a down year overall, posting a 4.62 SIERA with a strikeout rate of only 15%. There isn’t much to suggest an improvement anytime soon, but he has a revenge game against the Rays, whose projected lineup has an average xwOBA of .306 with a strikeout rate of 22% against right-handed pitching.
Quick Breakdown: I likely won’t go here, but I suppose Cobb is viable as an SP2 in large-field tournaments.
Batter Grind Down
Tampa Bay
The Rays aren’t an offense that I target often, but they do see a favorable ballpark shift playing in Baltimore. They also draw an exploitable matchup against Alex Cobb, who has allowed a .366 xwOBA to lefties and a .359 xwOBA to righties this season. I won’t be going out of my way to target the Rays’ offense tonight, but it wouldn’t be the worst thing in the world if Kevin Kiermaier, Jake Bauers, or C.J. Cron found their way into a tournament lineup.
Projected Lineup (Splits vs. RH Pitching)
| # | Player | Bats | xwOBA | aEV | ISO | HC% | BB% | K% | GB% | FD Pos. | FD Sal. | DK Pos. | DK Sal. | FDRFT Pos. | FDRFT Sal. |
|---|---|---|---|---|---|---|---|---|---|---|---|---|---|---|---|
| 1 | Kevin Kiermaier | LEFT | 0.250 | 85.8 | 0.081 | 33.8% | 8.9% | 28.6% | 53.0% | OF | $2,900 | OF | $4,100 | CF | $8,100 |
| 2 | Matt Duffy | RIGHT | 0.328 | 86.9 | 0.101 | 30.9% | 6.1% | 15.0% | 51.3% | 3B | $2,800 | 3B | $4,200 | 3B | $8,300 |
| 3 | Jake Bauers | LEFT | 0.370 | 90.7 | 0.243 | 44.3% | 15.0% | 22.0% | 38.0% | 1B | $3,300 | 1B/OF | $4,500 | 1B | $9,200 |
| 4 | C.J. Cron | RIGHT | 0.349 | 87.2 | 0.220 | 36.1% | 6.1% | 24.9% | 43.3% | 1B | $3,500 | 1B | $4,800 | 1B | $9,100 |
| 5 | Ji-Man Choi | LEFT | 0.305 | 87.1 | 0.255 | 42.3% | 6.0% | 42.0% | 34.6% | 1B | $2,500 | 1B | $3,800 | IF/OF | $7,200 |
| 6 | Joey Wendle | LEFT | 0.308 | 89.7 | 0.121 | 35.7% | 5.5% | 20.6% | 47.4% | 2B | $2,900 | 2B | $4,300 | 2B | $8,100 |
| 7 | Mallex Smith | LEFT | 0.290 | 84.4 | 0.127 | 28.5% | 8.8% | 18.5% | 44.6% | OF | $2,800 | OF | $4,600 | CF | $9,200 |
| 8 | Adeiny Hechavarria | RIGHT | 0.300 | 85.7 | 0.093 | 36.2% | 4.3% | 17.3% | 38.4% | SS | $2,600 | SS | $3,300 | SS | $6,400 |
| 9 | Jesus Sucre | RIGHT | 0.257 | 83.7 | 0.027 | 25.0% | 4.9% | 12.2% | 37.9% | C | $2,000 | C | $2,600 | C | $5,000 |
| Team Averages | 0.306 | 86.8 | 0.141 | 34.8% | 7.3% | 22.3% | 43.2% |
Elite Plays – None
Secondary Plays – Kevin Kiermaier, Jake Bauers, C.J. Cron
Stackability – ORANGE / YELLOW
Baltimore
The Orioles don’t have much talent to work with at this stage of the season, but they are playing at home in a hitter-friendly ballpark and they are cheap across the industry. They are still capable of putting up runs, although with Tampa Bay’s bullpen start strategy, it’s hard to predict which hitters will square off against which pitchers. They are far from core plays, but the fact that they are so cheap puts Tim Beckham, Jonathan Schoop, Adam Jones, and Mark Trumbo on my radar.
Projected Lineup (Splits vs. RH Pitching)
| # | Player | Bats | xwOBA | aEV | ISO | HC% | BB% | K% | GB% | FD Pos. | FD Sal. | DK Pos. | DK Sal. | FDRFT Pos. | FDRFT Sal. |
|---|---|---|---|---|---|---|---|---|---|---|---|---|---|---|---|
| 1 | Tim Beckham | RIGHT | 0.284 | 86.3 | 0.081 | 28.1% | 4.8% | 27.6% | 46.3% | SS | $2,800 | 3B | $3,400 | SS | $6,300 |
| 2 | Jonathan Schoop | RIGHT | 0.263 | 85.7 | 0.208 | 27.0% | 2.1% | 22.9% | 46.3% | 2B | $3,500 | 2B | $3,800 | 2B | $7,700 |
| 3 | Adam Jones | RIGHT | 0.324 | 88.2 | 0.176 | 31.4% | 3.4% | 18.2% | 41.5% | OF | $3,100 | OF | $3,600 | CF | $7,200 |
| 4 | Mark Trumbo | RIGHT | 0.364 | 93.4 | 0.205 | 42.2% | 7.3% | 25.1% | 38.3% | OF | $3,000 | 1B/OF | $3,500 | DH | $6,600 |
| 5 | Chris Davis | LEFT | 0.293 | 87.8 | 0.109 | 34.3% | 7.4% | 36.0% | 42.4% | 1B | $2,200 | 1B | $2,800 | IF/OF | $5,400 |
| 6 | Trey Mancini | RIGHT | 0.356 | 90.3 | 0.155 | 32.4% | 8.9% | 24.7% | 51.8% | OF | $2,500 | 1B/OF | $3,300 | IF/OF | $6,400 |
| 7 | Renato Nunez | RIGHT | 0.258 | 93.2 | 0.107 | 30.0% | 3.4% | 27.6% | 40.0% | 3B | $2,200 | 3B/OF | $3,400 | IF/OF | $6,500 |
| 8 | Austin Wynns | RIGHT | 0.168 | 78.2 | 0.214 | 55.6% | 6.3% | 37.5% | 50.0% | C | $2,000 | C | $2,900 | C | $5,800 |
| 9 | Jace Peterson | LEFT | 0.310 | 87.2 | 0.162 | 31.0% | 11.8% | 25.0% | 46.3% | OF | $2,000 | 3B/OF | $3,400 | 2B | $6,800 |
| Team Averages | 0.291 | 87.8 | 0.157 | 34.7% | 6.2% | 27.2% | 44.8% |
Elite Plays – None
Secondary Plays – Tim Beckham, Jonathan Schoop, Adam Jones, Mark Trumbo
Stackability – YELLOW
Note: Unless noted, all statistics in the Grind Down are from the 2018 season.