MLB Grind Down: Tuesday, July 5th
The RotoGrinders MLB Grind Down will give you an in-depth analysis into the upcoming MLB schedule. This article will break down the numbers for every single game and give you analysis on which trends you can exploit. While matchups are a major factor in daily fantasy baseball, there are plenty of other factors to consider such as injuries, weather, and salaries.
The analysis should point you in the right direction, but it is still up to you to decipher the information and make your own selections. No sport has more variance than baseball. The best choice is not always the right choice but following the trends will win you money over time.
Note: As always, if you want to try a new DFS site, be sure to click through a RotoGrinders link and use our DraftKings promo code and FanDuel promo code to receive the best perks in the industry.
Cincinnati at Chicago Cubs – 2:20 PM ET
| Cincinnati | Chicago Cubs |
 | |  | |
| LEFT | RIGHT |
| Vegas Moneyline | Vegas Over/Under |
| CHC -240 | 9.0 |
| Stats | wOBA | HR All. | K% | BB% | Stats | wOBA | HR All. | K% | BB% |
| SP vs. Left | 0.331 | 4 | 14.2% | 12.3% | SP vs. Left | 0.316 | 15 | 16.2% | 8.5% |
| SP vs. Right | 0.316 | 18 | 20.0% | 11.1% | SP vs. Right | 0.268 | 17 | 26.0% | 4.4% |
Pitcher Grind Down
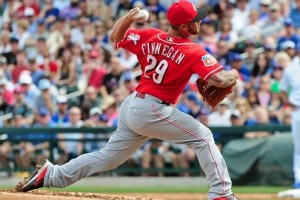
| Brandon Finnegan |
 | FanDuel | DraftKings |
| Salary: | $5,800 | Salary: | $5,400 |
| FPPG: | 20.4 | FPPG: | 10.0 |
| Pitcher Rating: | 36.3 | Pitcher Rank: | 28 |
| Statistics | Starts | PitchPS | SIERA | ERA | K% | BB% | SS% | GB% | FB% | HH% |
| L30 Days | 5 | 95.8 | 5.17 | 6.00 | 19.3% | 12.6% | 10.2% | 37.7% | 42.9% | 44.3% |
| 2016 | 17 | 96.0 | 5.35 | 4.48 | 16.6% | 11.8% | 9.0% | 39.4% | 36.6% | 36.6% |
| 2015 | 4 | 187.8 | 3.77 | 3.56 | 22.8% | 10.7% | 9.7% | 54.3% | 29.1% | 30.8% |
Finnegan is yet another Reds’ pitcher that we can pick on in daily fantasy baseball. In 17 starts this season, he has a 5.35 SIERA with a strikeout of 16.6%. He has a high fly ball rate and he gives up a lot of hard contact. Of the 30 pitchers in action today, he grades out as the third worst fantasy option. The Reds’ offense seems to love facing the Reds’ pitching staff and Finnegan comes into the game as a huge underdog on the road.
| John Lackey |
 | FanDuel | DraftKings |
| Salary: | $9,400 | Salary: | $10,800 |
| FPPG: | 37.8 | FPPG: | 20.8 |
| Pitcher Rating: | 80.3 | Pitcher Rank: | 5 |
| Statistics | Starts | PitchPS | SIERA | ERA | K% | BB% | SS% | GB% | FB% | HH% |
| L30 Days | 5 | 100.6 | 3.95 | 4.25 | 24.6% | 7.9% | 9.3% | 32.9% | 41.8% | 35.4% |
| 2016 | 16 | 98.1 | 3.65 | 3.27 | 25.9% | 7.0% | 11.8% | 39.4% | 38.3% | 35.1% |
| 2015 | 33 | 94.8 | 3.90 | 2.77 | 19.5% | 5.9% | 9.4% | 46.0% | 33.3% | 30.1% |
Lackey is having a terrific season, posting a 3.65 SIERA (2.93 ERA) with a strikeout rate of 25.9%. The fact that his ERA is nearly a full run lower than his SIERA does suggest a little regression moving forward, but he has an above-average strikeout rate and he has one of the best offenses in baseball at his back. He draws a favorable matchup against the Reds, who are ranked 28th in team wOBA and 21st in team K% against right-handed pitching. He is a safe option if you are playing in the all-day slate.
Batter Grind Down
Cincinnati
The Reds do not hit right-handed pitching well as a team and come into today’s game with the fifth lowest team total on the board. They draw a difficult matchup against , who has held left-handed hitters to a .316 wOBA and right-handed hitters to a .268 wOBA over the last two seasons. With a full slate, the Reds’ offense is an easy fade.
- Reds Offense (2016)
Team wOBA vs. RHP — 0.296 (28 of 30)
Team ISO vs. RHP — 0.159 (17 of 30)
Team K% vs. RHP — 22.3% (21 of 30)
Runs Per Game — 4.24 (18 of 30)
Projected Run Total — 3.69 (26 of 30)
Projected Lineup
| Brandon Finnegan |
| | FanDuel | DraftKings |
| Salary: | $5,800 | Salary: | $5,400 |
| FPPG: | 20.4 | FPPG: | 10.0 |
| Pitcher Rating: | 36.3 | Pitcher Rank: | 28 |
| Statistics | Starts | PitchPS | SIERA | ERA | K% | BB% | SS% | GB% | FB% | HH% |
| L30 Days | 5 | 95.8 | 5.17 | 6.00 | 19.3% | 12.6% | 10.2% | 37.7% | 42.9% | 44.3% |
| 2016 | 17 | 96.0 | 5.35 | 4.48 | 16.6% | 11.8% | 9.0% | 39.4% | 36.6% | 36.6% |
| 2015 | 4 | 187.8 | 3.77 | 3.56 | 22.8% | 10.7% | 9.7% | 54.3% | 29.1% | 30.8% |
Elite Plays – NONE
Secondary Plays – NONE
Stackability – NONE
Chicago Cubs
The Cubs are ranked fourth in both team wOBA and team ISO against left-handed pitching this season. They come into today’s game with the highest run projection of any team on the schedule. They draw an excellent matchup against , who has allowed a .331 wOBA to left-handed hitters and a .316 wOBA to right-handed hitters. If you are playing in the all-day slate, you may want to consider a mini-Cubs’ stack for cash games and GPPs.
- Cubs Offense (2016)
Team wOBA vs. LHP — 0.350 (4 of 30)
Team ISO vs. LHP — 0.192 (4 of 30)
Team K% vs. LHP — 20.1% (10 of 30)
Runs Per Game — 5.28 (2 of 30)
Projected Run Total — 5.31 (1 of 30)
Projected Lineup
| # | Player | Bats | wOBA vs. LHP | ISO vs. LHP | wOBA L14 | FD Position | FD Salary | DK Position | DK Salary |
| 1 | | SWITCH | 0.393 | 0.180 | 0.305 | 2B | $4,000 | 2B | $4,700 |
| 2 | | RIGHT | 0.376 | 0.268 | 0.475 | 3B | $3,800 | 3B/OF | $5,400 |
| 3 | | LEFT | 0.370 | 0.205 | 0.414 | 1B | $3,300 | 1B | $5,100 |
| 4 | | RIGHT | 0.431 | 0.235 | 0.426 | C | $2,800 | C/OF | $4,200 |
| 5 | | RIGHT | 0.249 | 0.137 | 0.386 | SS | $2,200 | SS | $3,600 |
| 6 | | LEFT | 0.311 | 0.097 | 0.274 | OF | $3,400 | OF | $3,300 |
| 7 | | RIGHT | 0.322 | 0.185 | 0.261 | C | $2,200 | C | $2,700 |
| 8 | | RIGHT | 0.156 | 0.000 | 0.138 | P | $9,400 | P | $10,800 |
| 9 | | RIGHT | 0.429 | 0.224 | 0.328 | SS | $2,600 | 3B/SS | $4,000 |
| | Team Averages | — | 0.337 | 0.170 | 0.334 | — | — | — | — |
Elite Plays – , ,
Secondary Plays – , , ,
Stackability – Cash & GPP
Atlanta at Philadelphia – 7:05 PM ET
| Atlanta | Philadelphia |
 | |  | |
| RIGHT | RIGHT |
| Vegas Moneyline | Vegas Over/Under |
| PHI -125 | 8.5 |
| Stats | wOBA | HR All. | K% | BB% | Stats | wOBA | HR All. | K% | BB% |
| SP vs. Left | 0.409 | 14 | 17.5% | 7.0% | SP vs. Left | 0.307 | 2 | 4.6% | 4.6% |
| SP vs. Right | 0.336 | 10 | 21.0% | 7.1% | SP vs. Right | 0.356 | 2 | 14.0% | 4.0% |
Pitcher Grind Down
| Mike Foltynewicz |
 | FanDuel | DraftKings |
| Salary: | $6,200 | Salary: | $6,200 |
| FPPG: | 25.4 | FPPG: | 12.9 |
| Pitcher Rating: | 48.7 | Pitcher Rank: | 18 |
| Statistics | Starts | PitchPS | SIERA | ERA | K% | BB% | SS% | GB% | FB% | HH% |
| L30 Days | 1 | 61.0 | 6.11 | 6.00 | 13.3% | 13.3% | 11.5% | 40.0% | 50.0% | 20.0% |
| 2016 | 7 | 90.6 | 4.33 | 3.72 | 19.5% | 6.5% | 9.0% | 39.4% | 37.6% | 27.9% |
| 2015 | 15 | 98.7 | 4.30 | 5.71 | 19.3% | 7.3% | 8.9% | 33.3% | 43.5% | 32.5% |
Foltynewicz has had some success in the minors, but that has yet to translate over to the majors. In his last 22 starts, he has a SIERA close to 4.30 with a strikeout rate just under 20%. He draws an exploitable matchup tonight against the Phillies, but that doesn’t mean that he immediately becomes a great fantasy option. Vegas has him listed as a small underdog in a game that features an over/under of 8.5 runs. You could potentially look his way in tournaments, but there are better cash game targets.
| Zach Eflin |
 | FanDuel | DraftKings |
| Salary: | $5,500 | Salary: | $4,000 |
| FPPG: | 12.3 | FPPG: | 5.2 |
| Pitcher Rating: | 34.7 | Pitcher Rank: | 29 |
| Statistics | Starts | PitchPS | SIERA | ERA | K% | BB% | SS% | GB% | FB% | HH% |
| L30 Days | 4 | 87.5 | 5.41 | 5.75 | 9.6% | 4.3% | 5.1% | 38.3% | 39.5% | 27.2% |
| 2016 | 4 | 87.5 | 5.41 | 5.75 | 9.6% | 4.3% | 5.1% | 38.3% | 39.5% | 27.2% |
Eflin is making his fourth career major league start. He has really struggled in the majors thus far, posting a 5.41 SIERA with a strikeout rate of only 9.6%. The sample size is obviously small, but he isn’t generating enough swings and misses and he his high fly ball rate could be an issue moving forward. I like his matchup against the Braves, but that’s not enough of a reason to look his way in DFS. Of the two pitchers in this game, I prefer .
Batter Grind Down
Atlanta
The Braves are ranked dead last in both team wOBA and team ISO against right-handed pitching this season, but they draw one of the best matchups on the board. In his first four major league starts, has allowed 16 runs. Hitters from both sides of the plate are in play, although is the only one that really stands out as an elite play.
- Braves Offense (2016)
Team wOBA vs. RHP — 0.284 (30 of 30)
Team ISO vs. RHP — 0.112 (30 of 30)
Team K% vs. RHP — 19.9% (11 of 30)
Runs Per Game — 3.40 (30 of 30)
Projected Run Total — 4.10 (17 of 30)
Projected Lineup
| # | Player | Bats | wOBA vs. RHP | ISO vs. RHP | wOBA L14 | FD Position | FD Salary | DK Position | DK Salary |
| 1 | | LEFT | 0.310 | 0.110 | 0.373 | 2B | $2,800 | 2B | $3,400 |
| 2 | | LEFT | 0.336 | 0.114 | 0.268 | OF | $2,700 | OF | $3,900 |
| 3 | | LEFT | 0.378 | 0.239 | 0.430 | 1B | $3,900 | 1B | $4,900 |
| 4 | | LEFT | 0.338 | 0.099 | 0.319 | OF | $2,900 | OF | $3,900 |
| 5 | | RIGHT | 0.288 | 0.150 | 0.172 | 3B | $2,100 | 3B | $3,100 |
| 6 | | SWITCH | 0.281 | 0.072 | 0.325 | SS | $2,600 | SS | $3,000 |
| 7 | | LEFT | 0.305 | 0.118 | 0.222 | C | $2,300 | C | $2,900 |
| 8 | | SWITCH | 0.171 | 0.000 | 0.169 | OF | $2,100 | 2B | $2,800 |
| 9 | | RIGHT | 0.086 | 0.032 | 0.000 | P | $6,200 | P | $6,200 |
| | Team Averages | — | 0.277 | 0.104 | 0.253 | — | — | — | — |
Elite Plays –
Secondary Plays – ,
Stackability – NONE
Philadelphia
The Phillies typically have one of the lowest team totals on the board, but they have a slightly above-average total tonight. They draw an exploitable matchup against , who has allowed a .409 wOBA to left-handed hitters and a .336 wOBA to right-handed hitters over the last two seasons. We don’t want to get too carried away with the Phillies’ offense, but there are some nice value plays in this lineup.
- Phillies Offense (2016)
Team wOBA vs. RHP — 0.300 (25 of 30)
Team ISO vs. RHP — 0.160 (16 of 30)
Team K% vs. RHP — 21.1% (17 of 30)
Runs Per Game — 3.56 (29 of 30)
Projected Run Total — 4.40 (13 of 30)
Projected Lineup
| # | Player | Bats | wOBA vs. RHP | ISO vs. RHP | wOBA L14 | FD Position | FD Salary | DK Position | DK Salary |
| 1 | | LEFT | 0.361 | 0.150 | 0.370 | OF | $3,700 | OF | $4,600 |
| 2 | | RIGHT | 0.287 | 0.146 | 0.533 | OF | $2,400 | OF | $3,300 |
| 3 | | LEFT | 0.312 | 0.175 | 0.393 | OF | $2,500 | OF | $3,100 |
| 4 | | RIGHT | 0.344 | 0.202 | 0.482 | 3B | $3,300 | 3B | $4,200 |
| 5 | | RIGHT | 0.249 | 0.218 | 0.231 | 1B | $2,800 | 1B | $3,200 |
| 6 | | RIGHT | 0.299 | 0.158 | 0.541 | C | $2,700 | C | $3,600 |
| 7 | | SWITCH | 0.289 | 0.124 | 0.299 | SS | $2,400 | SS | $3,500 |
| 8 | | SWITCH | 0.304 | 0.091 | 0.488 | 2B | $2,300 | 2B | $3,400 |
| 9 | | RIGHT | 0.207 | 0.167 | 0.311 | P | $5,500 | P | $4,000 |
| | Team Averages | — | 0.295 | 0.159 | 0.405 | — | — | — | — |
Elite Plays – NONE
Secondary Plays – , , ,
Stackability – NONE
Milwaukee at Washington – 7:05 PM ET
| Milwaukee | Washington |
 | |  | |
| RIGHT | LEFT |
| Vegas Moneyline | Vegas Over/Under |
| WAS -150 | 8.5 |
| Stats | wOBA | HR All. | K% | BB% | Stats | wOBA | HR All. | K% | BB% |
| SP vs. Left | 0.319 | 7 | 20.3% | 9.5% | SP vs. Left | 0.279 | 2 | 18.7% | 6.0% |
| SP vs. Right | 0.299 | 7 | 19.0% | 6.9% | SP vs. Right | 0.325 | 16 | 24.0% | 9.4% |
Pitcher Grind Down
| Zach Davies |
 | FanDuel | DraftKings |
| Salary: | $6,900 | Salary: | $6,300 |
| FPPG: | 27.9 | FPPG: | 14.2 |
| Pitcher Rating: | 54.6 | Pitcher Rank: | 14 |
| Statistics | Starts | PitchPS | SIERA | ERA | K% | BB% | SS% | GB% | FB% | HH% |
| L30 Days | 5 | 97.0 | 3.72 | 3.68 | 24.6% | 6.6% | 8.0% | 42.5% | 37.5% | 25.6% |
| 2016 | 14 | 92.1 | 4.13 | 4.22 | 20.6% | 7.0% | 8.0% | 46.1% | 33.0% | 33.6% |
| 2015 | 6 | 89.8 | 4.34 | 3.71 | 17.3% | 10.8% | 10.0% | 57.6% | 21.2% | 32.0% |
Davies snapped his string of quality DFS starts, allowing six earned runs in only four innings against the Dodgers. He has been in much better form over the last six weeks, but is still a risky fantasy option at this point. He draws a fairly difficult matchup against the Nationals in Washington. He is listed as a sizable underdog on the road and makes for an easy fade in cash games.
| Gio Gonzalez |
 | FanDuel | DraftKings |
| Salary: | $8,900 | Salary: | $7,700 |
| FPPG: | 29.2 | FPPG: | 14.9 |
| Pitcher Rating: | 79.3 | Pitcher Rank: | 8 |
| Statistics | Starts | PitchPS | SIERA | ERA | K% | BB% | SS% | GB% | FB% | HH% |
| L30 Days | 5 | 102.2 | 3.83 | 6.83 | 28.1% | 11.7% | 11.9% | 50.0% | 22.9% | 31.9% |
| 2016 | 16 | 99.6 | 3.84 | 4.81 | 24.0% | 7.9% | 10.0% | 47.7% | 30.6% | 32.7% |
| 2015 | 31 | 95.1 | 3.77 | 3.79 | 22.3% | 9.1% | 9.8% | 53.8% | 26.6% | 28.7% |
Gonzalez is coming off of his best start in a month. His indicators this season look good, he has just been a bit unlucky in terms of batted balls. His ERA is a full run higher than his SIERA, which suggests that he should have a better second half of the season. The one thing that has been in his favor has been his strikeout rate of 24% this season. He offers great value tonight against the Brewers, who are ranked 23rd or worse in team wOBA, team ISO, and team K% against left-handed pitching this season. Gio is worth a look in all league formats.
Batter Grind Down
Milwaukee
The Brewers struggle against left-handed pitching, they draw a difficult matchup against , and they are playing in a pitcher-friendly ballpark. With the ninth lowest team total on the board, I will be avoiding all of Milwaukee’s hitters with the potential exception of in a GPP lineup or two.
- Brewers Offense (2016)
Team wOBA vs. LHP — 0.307 (23 of 30)
Team ISO vs. LHP — 0.139 (26 of 30)
Team K% vs. LHP — 23.9% (27 of 30)
Runs Per Game — 3.99 (27 of 30)
Projected Run Total — 3.96 (22 of 30)
Projected Lineup
| # | Player | Bats | wOBA vs. LHP | ISO vs. LHP | wOBA L14 | FD Position | FD Salary | DK Position | DK Salary |
| 1 | | SWITCH | 0.358 | 0.150 | 0.310 | SS | $3,400 | SS | $4,100 |
| 2 | | RIGHT | 0.279 | 0.087 | 0.328 | 3B | $2,800 | 2B/3B | $3,000 |
| 3 | | RIGHT | 0.413 | 0.241 | 0.400 | OF | $3,800 | OF | $4,900 |
| 4 | | RIGHT | 0.276 | 0.117 | 0.238 | C | $3,200 | C | $3,600 |
| 5 | | RIGHT | 0.335 | 0.252 | 0.382 | 1B | $2,900 | 1B | $3,800 |
| 6 | | RIGHT | 0.273 | 0.159 | 0.176 | 3B | $2,400 | 3B/OF | $3,300 |
| 7 | | LEFT | 0.274 | 0.143 | 0.315 | 2B | $2,800 | 2B | $2,300 |
| 8 | | RIGHT | 0.234 | 0.028 | 0.372 | OF | $2,100 | OF | $2,600 |
| 9 | | RIGHT | 0.093 | 0.000 | 0.000 | P | $6,900 | P | $6,300 |
| | Team Averages | — | 0.282 | 0.131 | 0.280 | — | — | — | — |
Elite Plays – NONE
Secondary Plays –
Stackability – NONE
Washington
The Nationals may not have the best numbers against right-handed pitching this season, but they have a sneaky-high team total tonight of 4.54 runs. has pitched well at times this season, but he has also been hit hard. and both stand out as elite plays at their respective positions.
- Nationals Offense (2016)
Team wOBA vs. RHP — 0.312 (19 of 30)
Team ISO vs. RHP — 0.162 (15 of 30)
Team K% vs. RHP — 20.2% (13 of 30)
Runs Per Game — 4.69 (12 of 30)
Projected Run Total — 4.54 (9 of 30)
Projected Lineup
| # | Player | Bats | wOBA vs. RHP | ISO vs. RHP | wOBA L14 | FD Position | FD Salary | DK Position | DK Salary |
| 1 | | LEFT | 0.300 | 0.072 | 0.267 | OF | $3,600 | OF | $3,700 |
| 2 | | RIGHT | 0.283 | 0.125 | 0.363 | OF | $4,000 | OF | $3,600 |
| 3 | | LEFT | 0.442 | 0.308 | 0.389 | OF | $3,800 | OF | $4,900 |
| 4 | | LEFT | 0.374 | 0.219 | 0.345 | 2B | $3,600 | 2B | $5,200 |
| 5 | | RIGHT | 0.319 | 0.157 | 0.455 | C | $3,300 | C | $4,600 |
| 6 | | RIGHT | 0.284 | 0.161 | 0.221 | 1B | $2,900 | 1B | $3,200 |
| 7 | | LEFT | 0.297 | 0.212 | 0.315 | SS | $2,700 | 2B/3B | $2,800 |
| 8 | | SWITCH | 0.313 | 0.180 | 0.560 | SS | $3,100 | SS | $4,800 |
| 9 | | LEFT | 0.157 | 0.035 | 0.000 | P | $8,900 | P | $7,700 |
| | Team Averages | — | 0.308 | 0.163 | 0.324 | — | — | — | — |
Elite Plays – ,
Secondary Plays – ,
Stackability – GPP
Kansas City at Toronto – 7:07 PM ET
| Kansas City | Toronto |
 | Chris Young |  | |
| RIGHT | RIGHT |
| Vegas Moneyline | Vegas Over/Under |
| TOR -160 | 9.5 |
| Stats | wOBA | HR All. | K% | BB% | Stats | wOBA | HR All. | K% | BB% |
| SP vs. Left | 0.387 | 23 | 17.6% | 12.2% | SP vs. Left | 0.315 | 22 | 13.3% | 8.7% |
| SP vs. Right | 0.253 | 15 | 20.1% | 6.7% | SP vs. Right | 0.320 | 22 | 16.2% | 6.1% |
Pitcher Grind Down
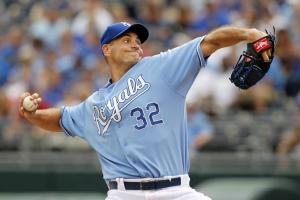
| Chris Young |
 | FanDuel | DraftKings |
| Salary: | $3,000 | Salary: | $4,600 |
| FPPG: | 7.3 | FPPG: | 8.8 |
| Pitcher Rating: | 33.6 | Pitcher Rank: | 30 |
| Statistics | Starts | PitchPS | SIERA | ERA | K% | BB% | SS% | GB% | FB% | HH% |
| L30 Days | 5 | 82.6 | 5.49 | 6.75 | 23.7% | 16.5% | 9.9% | 24.1% | 60.3% | 50.0% |
| 2016 | 12 | 89.8 | 4.71 | 6.24 | 23.2% | 11.2% | 10.3% | 28.0% | 55.4% | 42.9% |
| 2015 | 18 | 110.3 | 5.15 | 3.06 | 16.6% | 8.6% | 9.4% | 25.5% | 57.9% | 33.4% |
Young has been one of the most hittable pitchers in baseball this season. In 12 starts, he has a 4.71 SIERA with a walk rate of 11.2% and a hard hit contact rate of 42.9%. He has allowed 38 home runs in his last 30 starts and he is facing a powerful Blue Jays’ offense in a hitter-friendly ballpark. The fourth of July may be over, but there could be some fireworks tonight North of the border.
| R.A. Dickey |
 | FanDuel | DraftKings |
| Salary: | $7,000 | Salary: | $7,100 |
| FPPG: | 24.1 | FPPG: | 11.8 |
| Pitcher Rating: | 42.6 | Pitcher Rank: | 21 |
| Statistics | Starts | PitchPS | SIERA | ERA | K% | BB% | SS% | GB% | FB% | HH% |
| L30 Days | 5 | 94.8 | 4.85 | 4.20 | 14.3% | 5.6% | 9.5% | 42.6% | 38.6% | 34.7% |
| 2016 | 17 | 97.2 | 4.80 | 4.21 | 16.2% | 8.1% | 9.4% | 45.8% | 33.8% | 31.0% |
| 2015 | 33 | 98.9 | 4.76 | 3.91 | 14.3% | 6.9% | 9.1% | 41.9% | 37.2% | 23.9% |
Dickey is a large favorite tonight against the Royals at home, but that has more to do with the Royals’ starting pitcher that it does with his fantasy appeal. He is having a marginal year at best, posting a 4.80 SIERA with a strikeout rate of only 16.2%. There are enough viable options that you don’t need to consider using Dickey tonight. I expect this to be one of the highest scoring games of the night.
Batter Grind Down
Kansas City
The Royals continue to struggle to score runs, but they come into tonight’s game with the 12th highest team total on the board. They see a major ballpark boost playing in the Rogers Centre and they draw a favorable matchup against . Over the last two seasons, he has allowed a .315+ wOBA to both left and right-handed hitters.
- Royals Offense (2016)
Team wOBA vs. RHP — 0.311 (20 of 30)
Team ISO vs. RHP — 0.130 (29 of 30)
Team K% vs. RHP — 19.8% (10 of 30)
Runs Per Game — 4.04 (25 of 30)
Projected Run Total — 4.40 (12 of 30)
Projected Lineup
| # | Player | Bats | wOBA vs. RHP | ISO vs. RHP | wOBA L14 | FD Position | FD Salary | DK Position | DK Salary |
| 1 | | LEFT | 0.330 | 0.165 | 0.280 | OF | $2,900 | OF | $3,200 |
| 2 | | RIGHT | 0.302 | 0.112 | 0.230 | 2B | $3,100 | 2B/OF | $3,500 |
| 3 | | SWITCH | 0.359 | 0.226 | 0.638 | 1B | $3,100 | 1B | $4,800 |
| 4 | | LEFT | 0.374 | 0.180 | 0.310 | 1B | $3,700 | 1B | $4,000 |
| 5 | | RIGHT | 0.335 | 0.199 | 0.150 | C | $3,500 | C | $3,100 |
| 6 | | RIGHT | 0.315 | 0.158 | 0.205 | OF | $2,300 | OF | $3,200 |
| 7 | | RIGHT | 0.269 | 0.061 | 0.373 | SS | $2,500 | SS | $3,300 |
| 8 | | RIGHT | 0.306 | 0.127 | 0.364 | 3B | $2,300 | 3B | $3,300 |
| 9 | | LEFT | 0.297 | 0.112 | 0.359 | OF | $2,200 | OF | $3,200 |
| | Team Averages | — | 0.321 | 0.149 | 0.323 | — | — | — | — |
Elite Plays –
Secondary Plays – , ,
Stackability – GPP
Toronto
The Blue Jays have the highest team total outside of the Cubs and Chicago is playing in the one and only day game. Toronto could end up scoring ten or more runs in this matchup, as Chris Young continues to get battered by opposing offenses. Young gives up a much higher wOBA to left-handed hitters than he does to right-handed hitters, but you have to consider stacking the Jays in both cash games and GPPs.
- Blue Jays Offense (2016)
Team wOBA vs. RHP — 0.331 (8 of 30)
Team ISO vs. RHP — 0.194 (3 of 30)
Team K% vs. RHP — 22.0% (19 of 30)
Runs Per Game — 4.89 (8 of 30)
Projected Run Total — 5.10 (2 of 30)
Projected Lineup
| # | Player | Bats | wOBA vs. RHP | ISO vs. RHP | wOBA L14 | FD Position | FD Salary | DK Position | DK Salary |
| 1 | | LEFT | 0.302 | 0.096 | 0.314 | OF | $3,000 | OF | $3,600 |
| 2 | | RIGHT | 0.366 | 0.197 | 0.332 | 2B | $2,700 | 2B | $4,100 |
| 3 | | RIGHT | 0.395 | 0.268 | 0.505 | 3B | $4,700 | 3B | $5,600 |
| 4 | | RIGHT | 0.386 | 0.278 | 0.440 | 1B | $4,300 | 1B | $5,300 |
| 5 | | LEFT | 0.350 | 0.200 | 0.268 | OF | $3,500 | OF | $4,300 |
| 6 | | RIGHT | 0.328 | 0.182 | 0.457 | SS | $3,100 | SS | $4,400 |
| 7 | | RIGHT | 0.308 | 0.176 | 0.323 | C | $2,400 | C | $3,600 |
| 8 | | SWITCH | 0.331 | 0.227 | 0.201 | 1B | $3,400 | 1B | $3,600 |
| 9 | | RIGHT | 0.306 | 0.136 | 0.251 | OF | $2,200 | OF | $3,400 |
| | Team Averages | — | 0.341 | 0.196 | 0.343 | — | — | — | — |
Elite Plays – , , ,
Secondary Plays – , , /
Stackability – Cash & GPP
Detroit at Cleveland – 7:10 PM ET
| Detroit | Cleveland |
 | |  | |
| RIGHT | RIGHT |
| Vegas Moneyline | Vegas Over/Under |
| CLE -190 | 8.5 |
| Stats | wOBA | HR All. | K% | BB% | Stats | wOBA | HR All. | K% | BB% |
| SP vs. Left | 0.318 | 18 | 22.2% | 10.0% | SP vs. Left | 0.280 | 14 | 27.6% | 7.0% |
| SP vs. Right | 0.374 | 27 | 17.5% | 6.4% | SP vs. Right | 0.286 | 14 | 29.3% | 5.1% |
Pitcher Grind Down
| Anibal Sanchez |
 | FanDuel | DraftKings |
| Salary: | $5,100 | Salary: | $4,000 |
| FPPG: | 15.5 | FPPG: | 6.7 |
| Pitcher Rating: | 41.6 | Pitcher Rank: | 23 |
| Statistics | Starts | PitchPS | SIERA | ERA | K% | BB% | SS% | GB% | FB% | HH% |
| L30 Days | 1 | 87.0 | 4.36 | 4.08 | 15.3% | 5.6% | 9.8% | 47.3% | 36.4% | 29.8% |
| 2016 | 12 | 100.4 | 4.92 | 6.05 | 17.9% | 10.0% | 8.9% | 40.3% | 43.3% | 33.1% |
| 2015 | 25 | 101.3 | 4.03 | 4.99 | 20.9% | 7.4% | 9.3% | 40.0% | 39.1% | 27.1% |
After struggling as a starter, the Tigers moved Sanchez to the bullpen. However, he will draw another start tonight as Detroit had to place on the DL. In 12 starts this season, he has a 4.92 SIERA with a strikeout rate of 17.9% and a walk rate of 10%. He has always been a fly-ball pitcher, but he is allowing more hard contact this season, which has led to a high home run rate as well. He is an easy fade tonight against and the Indians.
| Carlos Carrasco |
 | FanDuel | DraftKings |
| Salary: | $10,200 | Salary: | $11,500 |
| FPPG: | 37.3 | FPPG: | 21.3 |
| Pitcher Rating: | 92.5 | Pitcher Rank: | 2 |
| Statistics | Starts | PitchPS | SIERA | ERA | K% | BB% | SS% | GB% | FB% | HH% |
| L30 Days | 5 | 106.6 | 2.96 | 2.23 | 29.3% | 6.4% | 13.5% | 54.5% | 25.0% | 27.0% |
| 2016 | 10 | 92.4 | 3.34 | 2.56 | 25.4% | 6.1% | 12.2% | 52.7% | 27.5% | 34.3% |
| 2015 | 30 | 92.6 | 2.74 | 3.63 | 29.6% | 5.9% | 14.0% | 51.2% | 29.8% | 27.5% |
The Tigers aren’t usually an offense that we like to target pitchers against, but we can make the exception for right-handed pitchers with a high strikeout rate. Carrasco certainly fits the bill, as he has a 3.34 SIERA with a strikeout rate of 25.4% on the season. Over the course of the last two years, he has held right-handed hitters to a .286 wOBA. Carrasco grades out as the second best pitcher in the slate and is worth a look in all league formats.
Batter Grind Down
Detroit
The Tigers’ offense could really end up struggling tonight against . They only have two or three left-handed hitters that they can throw at him and they are large underdogs on the road. is always worth a look as a one-off in a GPP, but I will be avoiding the rest of the Tigers’ hitters.
- Tigers Offense (2016)
Team wOBA vs. RHP — 0.332 (6 of 30)
Team ISO vs. RHP — 0.172 (12 of 30)
Team K% vs. RHP — 22.4% (23 of 30)
Runs Per Game — 4.88 (9 of 30)
Projected Run Total — 3.73 (25 of 30)
Projected Lineup
| # | Player | Bats | wOBA vs. RHP | ISO vs. RHP | wOBA L14 | FD Position | FD Salary | DK Position | DK Salary |
| 1 | | RIGHT | 0.336 | 0.151 | 0.316 | 2B | $3,400 | 2B | $4,300 |
| 2 | | RIGHT | 0.307 | 0.081 | 0.372 | OF | $2,700 | OF | $3,700 |
| 3 | | RIGHT | 0.412 | 0.221 | 0.345 | 1B | $3,300 | 1B | $3,900 |
| 4 | | SWITCH | 0.304 | 0.153 | 0.351 | C | $3,100 | 1B | $3,600 |
| 5 | | RIGHT | 0.317 | 0.170 | 0.398 | 3B | $3,000 | 3B | $3,200 |
| 6 | | RIGHT | 0.332 | 0.193 | 0.223 | OF | $2,600 | OF | $3,000 |
| 7 | | LEFT | 0.359 | 0.273 | 0.500 | OF | $2,700 | OF | $2,300 |
| 8 | | RIGHT | 0.249 | 0.075 | 0.284 | C | $2,200 | C | $2,100 |
| 9 | | RIGHT | 0.289 | 0.059 | 0.343 | SS | $2,400 | SS | $2,600 |
| | Team Averages | — | 0.323 | 0.153 | 0.348 | — | — | — | — |
Elite Plays – NONE
Secondary Plays –
Stackability – NONE
Cleveland
The Indians have quietly been a top ten offensive ball club this season. They are ranked ninth in team wOBA against right-handed pitching and they come into tonight’s game with the sixth highest team total on the board. They draw a favorable matchup against , who is a fly-ball pitcher that has allowed 45 home runs over the last two seasons. During that stretch, he has given up a .374 wOBA to right-handed hitters.
- Indians Offense (2016)
Team wOBA vs. RHP — 0.328 (9 of 30)
Team ISO vs. RHP — 0.189 (5 of 30)
Team K% vs. RHP — 20.5% (15 of 30)
Runs Per Game — 4.82 (10 of 30)
Projected Run Total — 4.77 (6 of 30)
Projected Lineup
| # | Player | Bats | wOBA vs. RHP | ISO vs. RHP | wOBA L14 | FD Position | FD Salary | DK Position | DK Salary |
| 1 | | SWITCH | 0.349 | 0.229 | 0.440 | 1B | $3,700 | 1B | $4,800 |
| 2 | | LEFT | 0.375 | 0.179 | 0.388 | 2B | $3,000 | 2B | $5,100 |
| 3 | | SWITCH | 0.346 | 0.156 | 0.257 | SS | $3,200 | SS | $4,700 |
| 4 | | RIGHT | 0.297 | 0.180 | 0.338 | 1B | $3,100 | 1B | $3,600 |
| 5 | | SWITCH | 0.314 | 0.137 | 0.363 | 3B | $2,800 | 3B/OF | $4,100 |
| 6 | | LEFT | 0.314 | 0.147 | 0.446 | OF | $2,800 | OF | $4,100 |
| 7 | | RIGHT | 0.259 | 0.172 | 0.212 | C | $2,200 | C | $3,400 |
| 8 | | LEFT | 0.395 | 0.244 | 0.401 | OF | $3,700 | OF | $3,800 |
| 9 | | RIGHT | 0.327 | 0.169 | 0.392 | OF | $2,800 | OF | $5,000 |
| | Team Averages | — | 0.331 | 0.179 | 0.360 | — | — | — | — |
Elite Plays – ,
Secondary Plays – , , ,
Stackability – GPP
Want to discuss strategy for today’s games? Head over to the RotoGrinders Forums
Jump to Page 1 2 3
